
Understand Profiling Results
After you run profiling or a documentation flow, profiling results are available at the catalog item and the attribute level. The catalog item statistics present a summary of the attribute statistics, which can then be viewed in detail for each attribute.
View profiling results
To view aggregated profiling results for a catalog item, open the catalog item Profile & DQ insights tab. Here you can switch between sample and full profiling results, see how the records and their number changed over time, and find out more about the catalog item attributes.
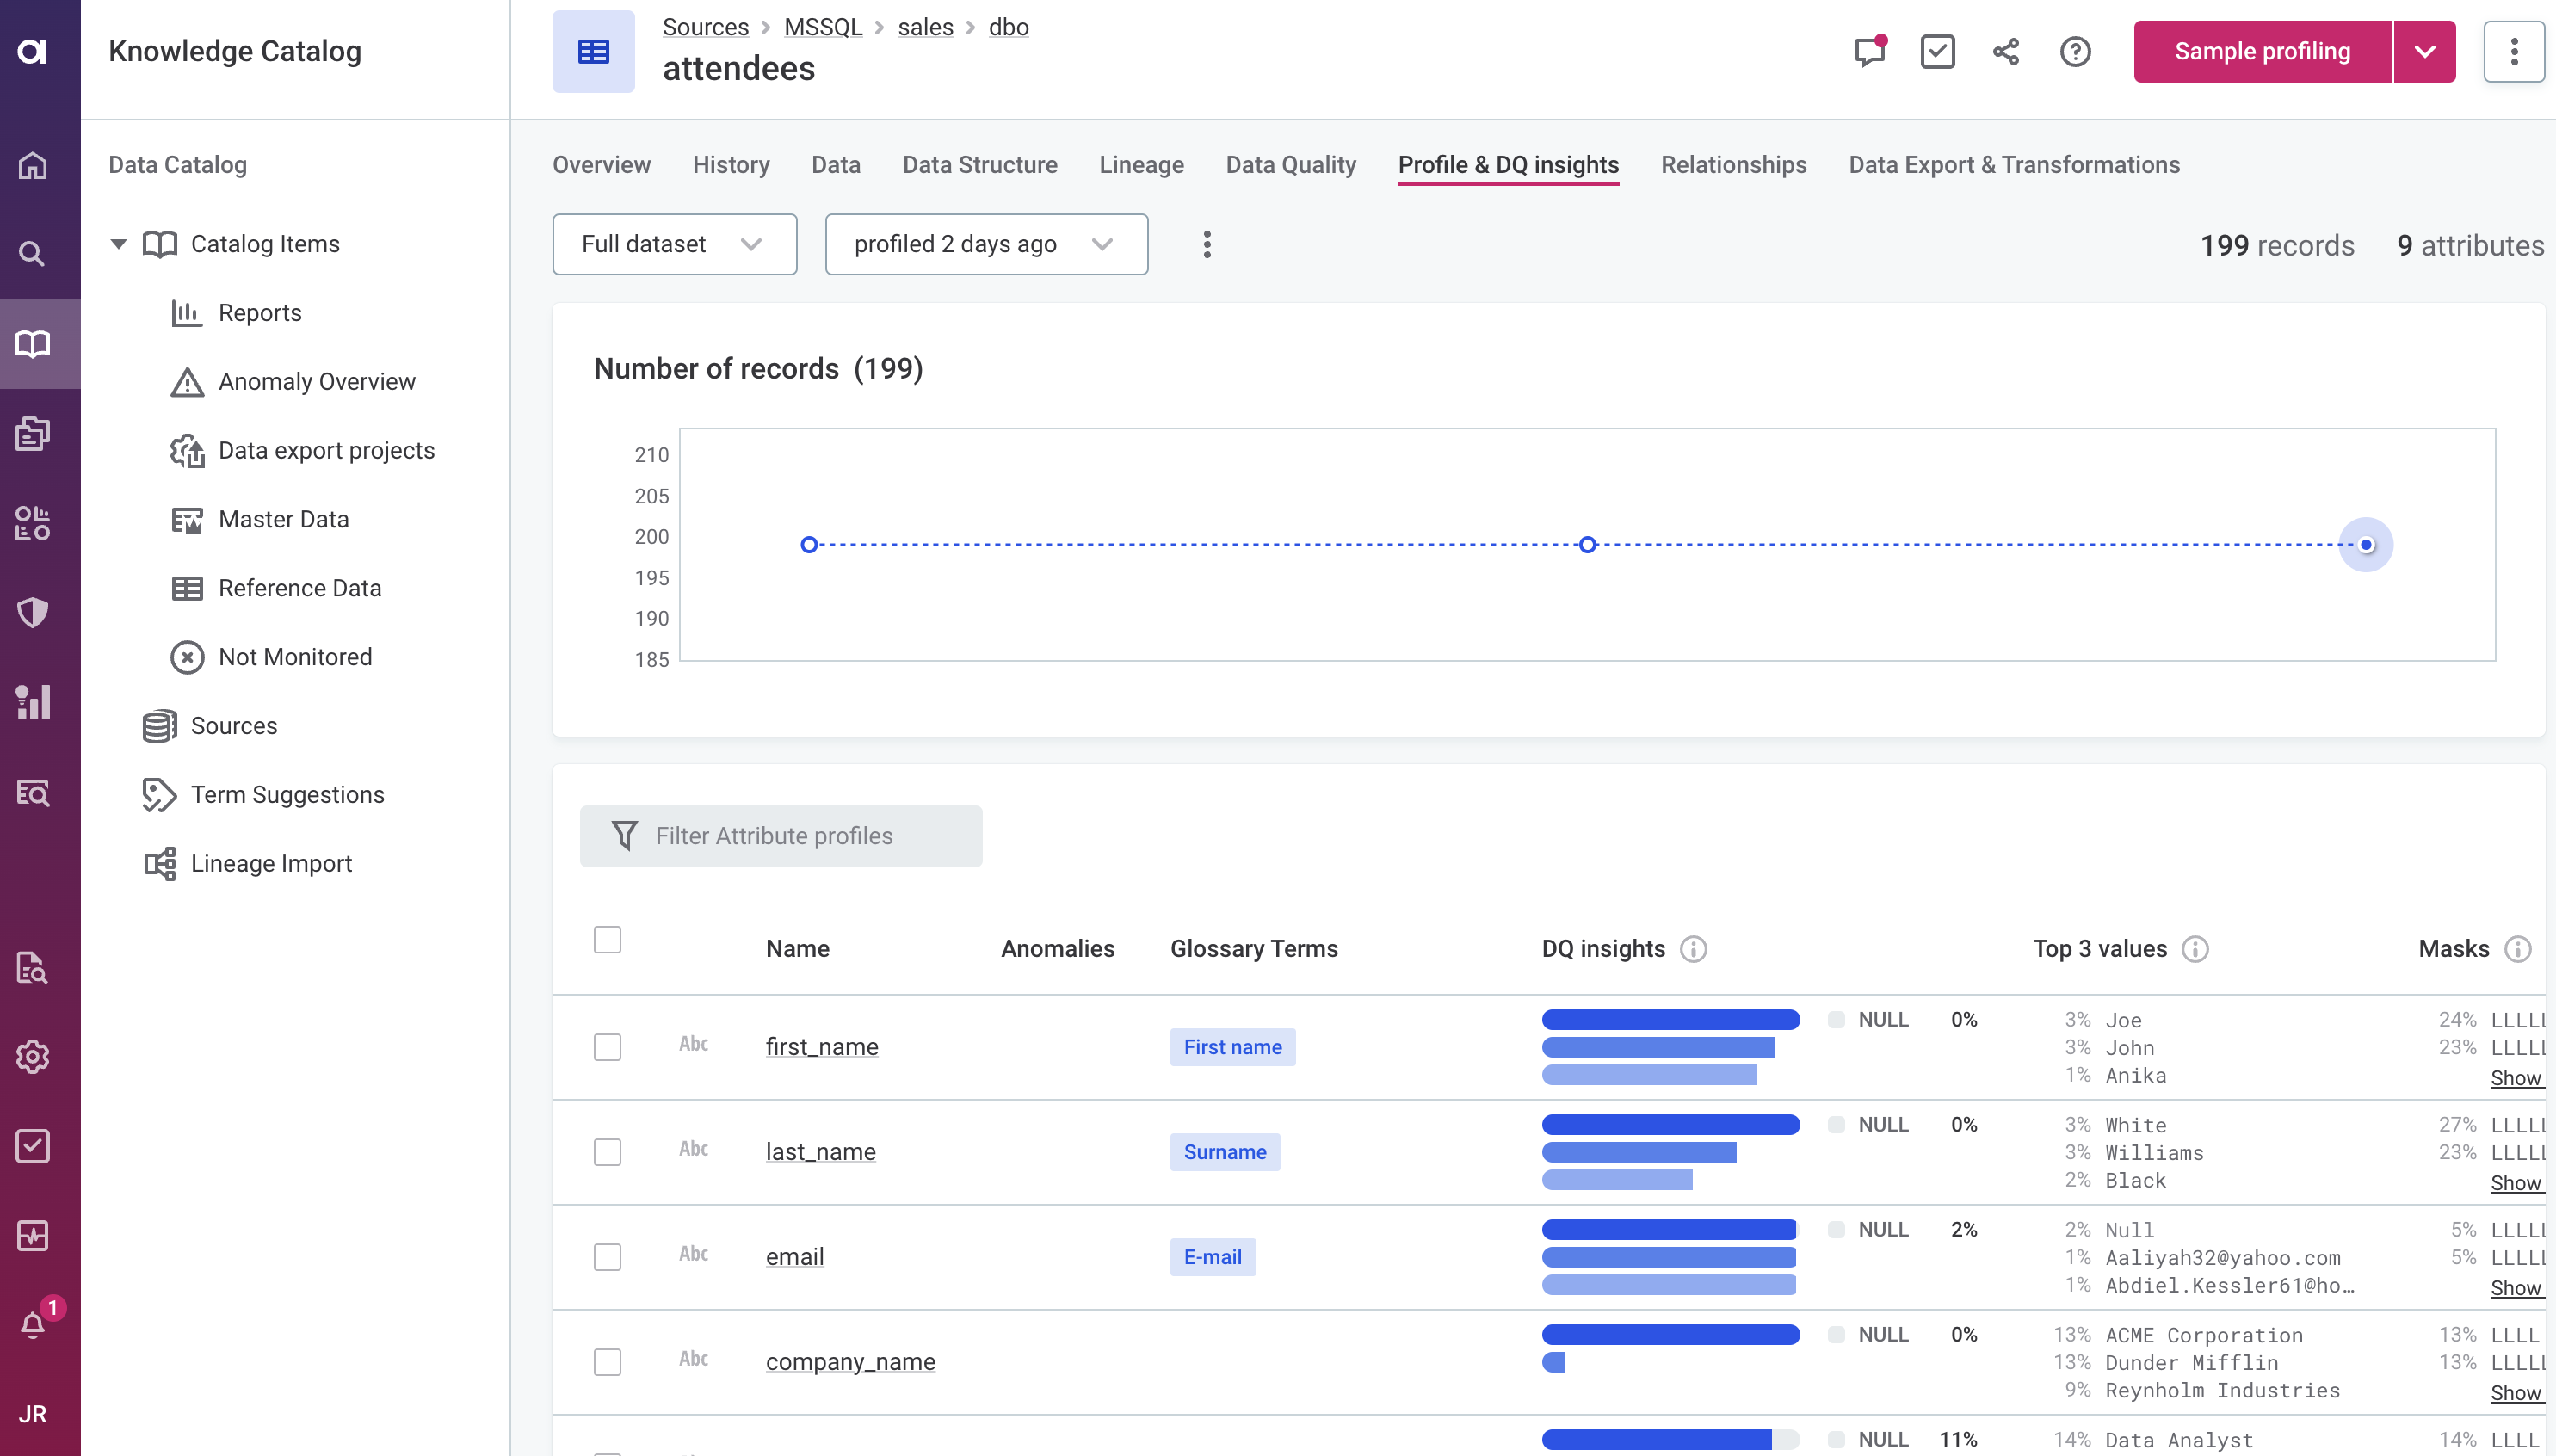
To learn more about a specific attribute, select the attribute name from the list.
Alternatively, select the attribute name from the catalog item Overview tab and open the attribute Profile & DQ insights tab. You can also view profiling results for a specific attribute in a sidebar by clicking anywhere on the attribute row.
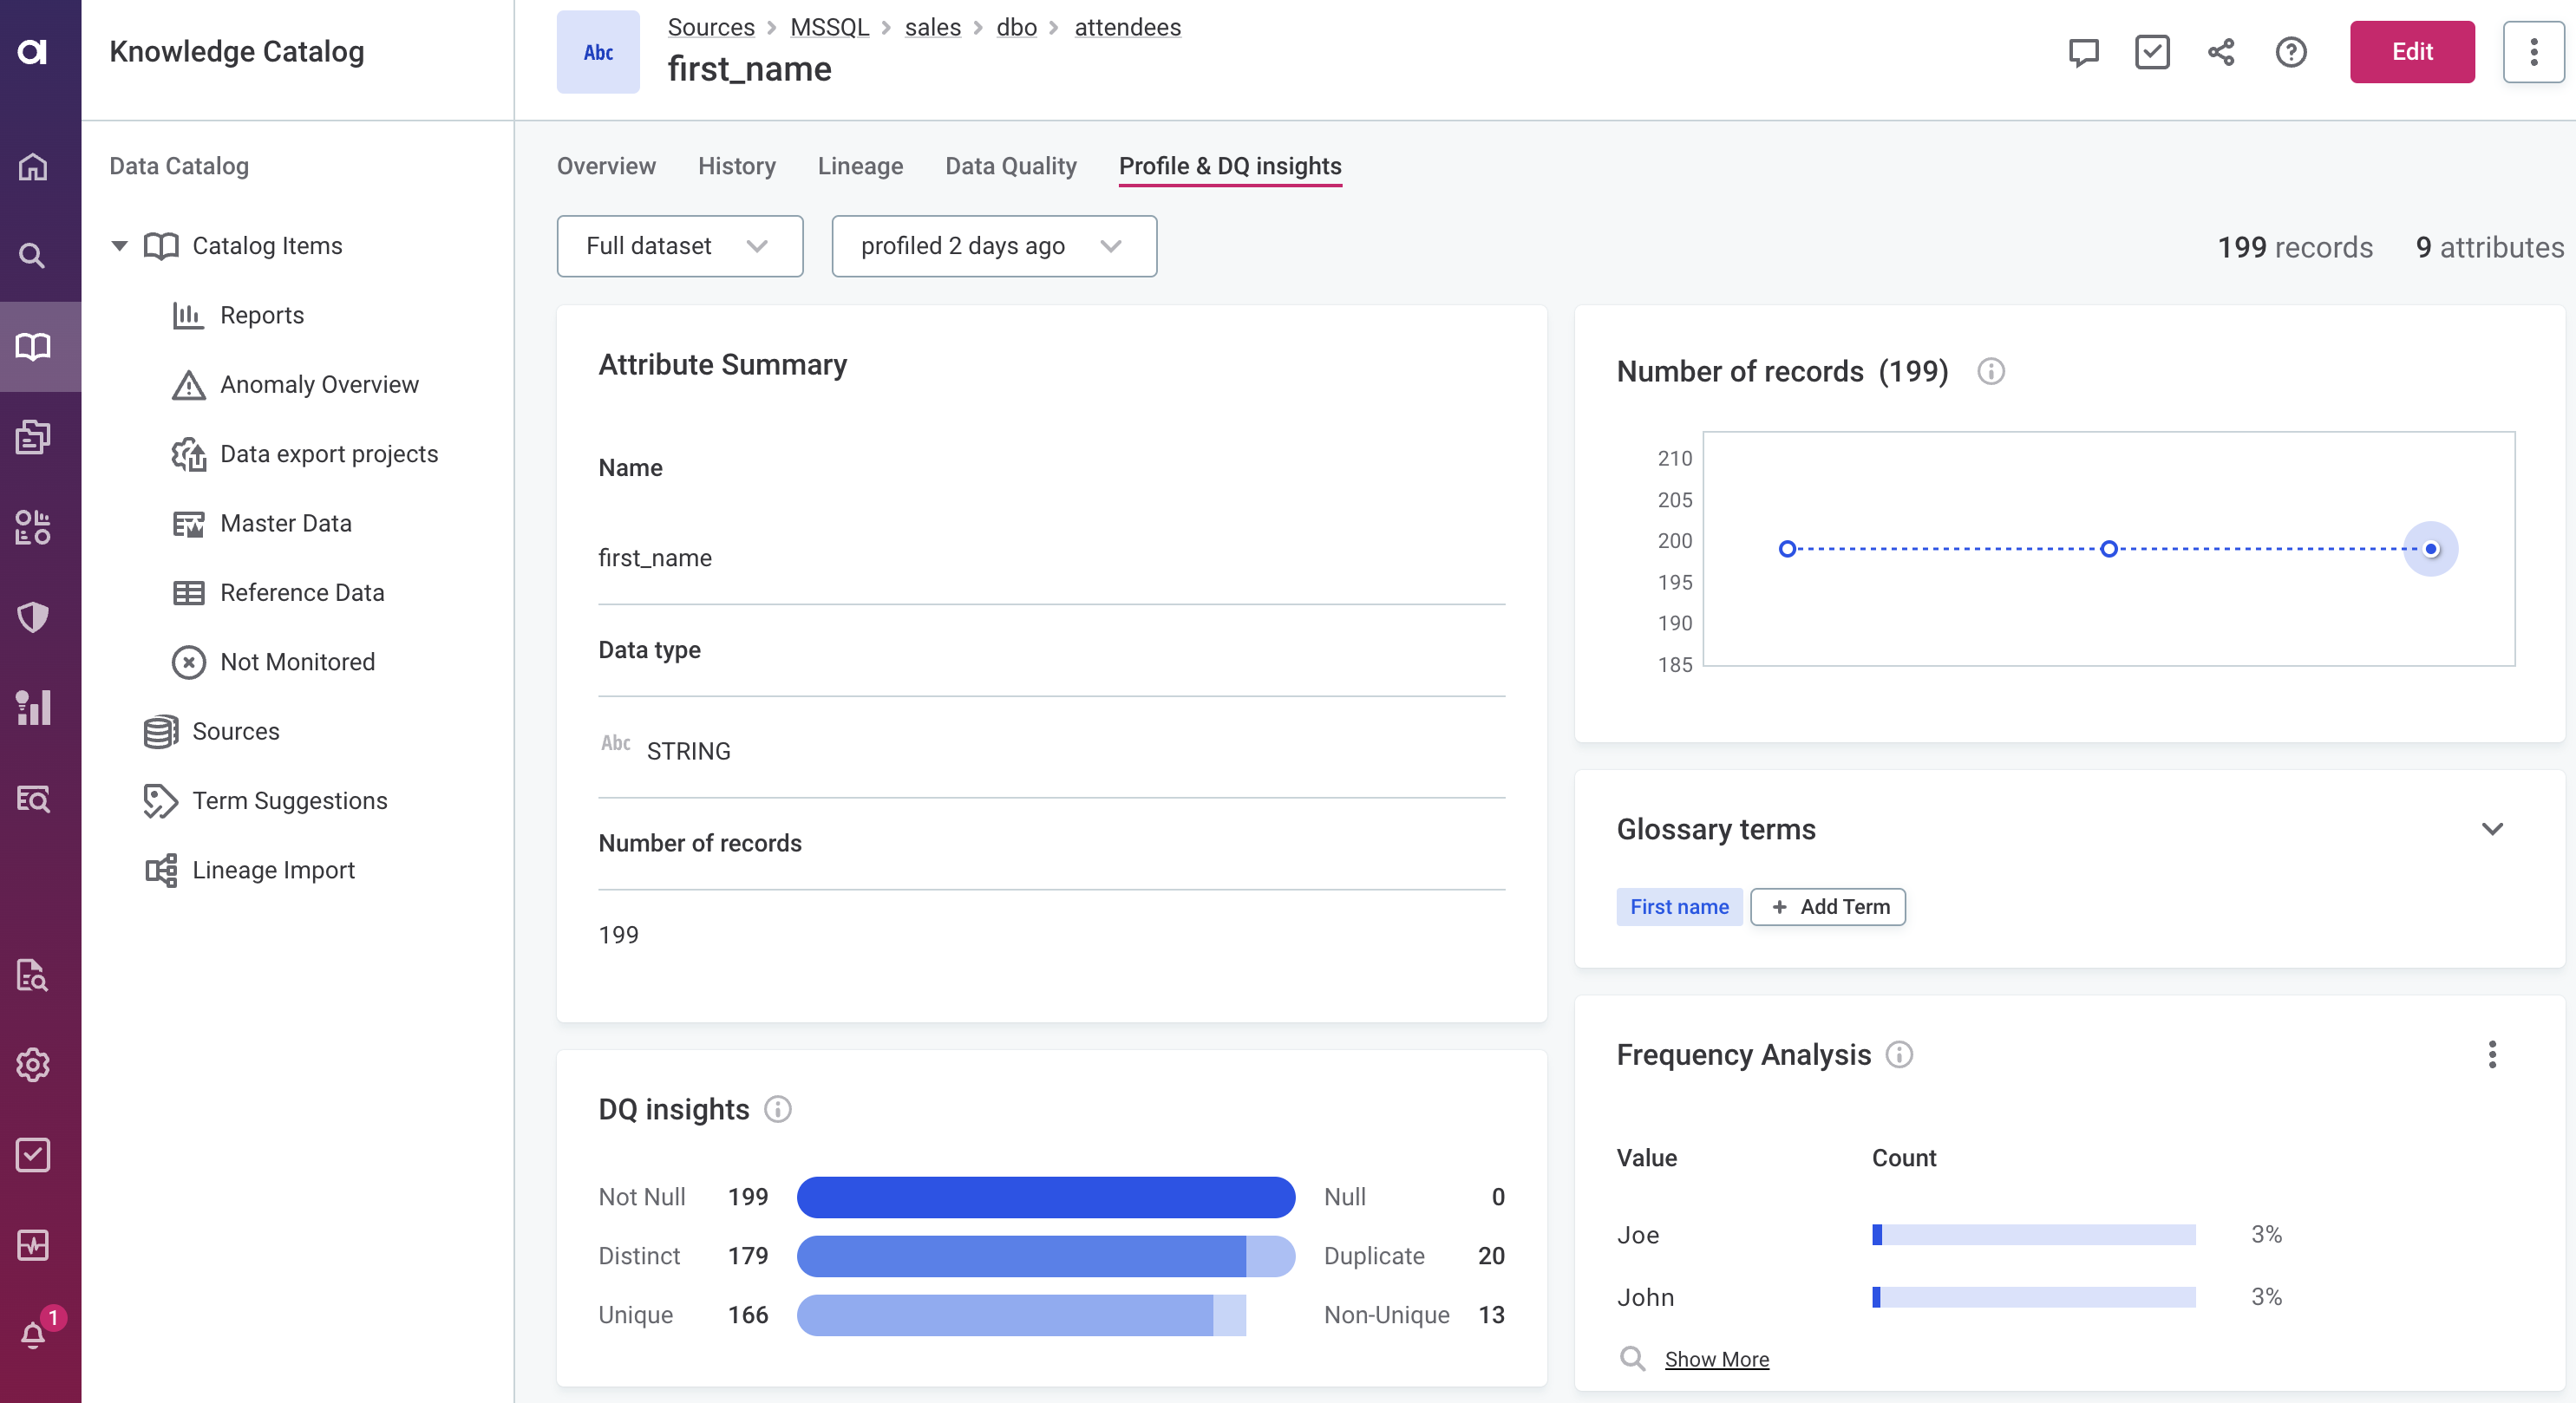
The attribute Profile & DQ insights tab displays the following information:
-
The general information about the attribute, such as Attribute datatype, Name, Number of records.
-
Potential Anomalies, that is, unexpected values in your data that might point to issues in your data. See also Next steps.
-
Applied or suggested Glossary Terms. See also Next steps.
-
The count and percentage of values that are null, not null, unique, and distinct (see DQ insights).
-
How often each of the most frequent three values occur in the data (Top 3 values).
-
The syntactic format of data (Masks) for non-numeric attributes. See pattern, length statistics.
Frequency, frequency groups, quantile statistics
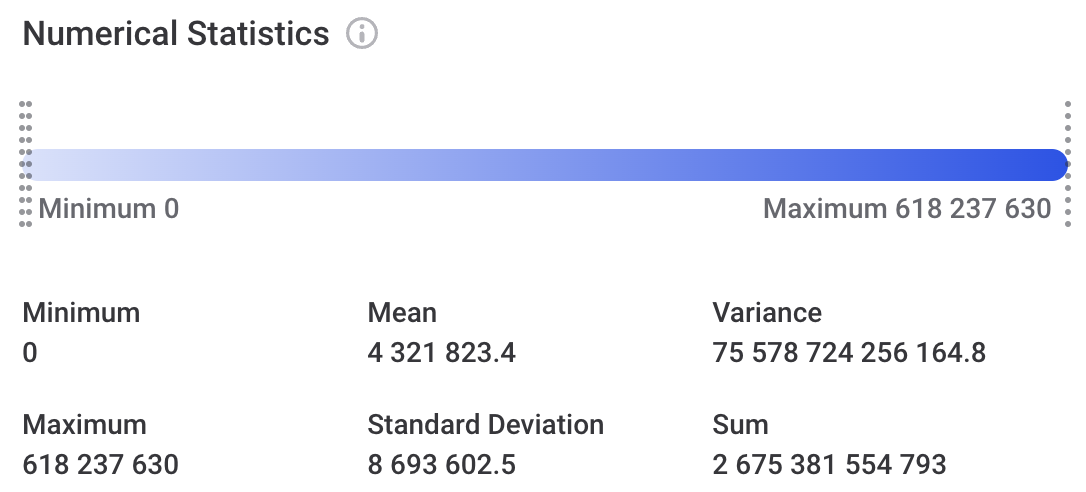
Profiling results include distribution statistics for all attributes, regardless of their data type.
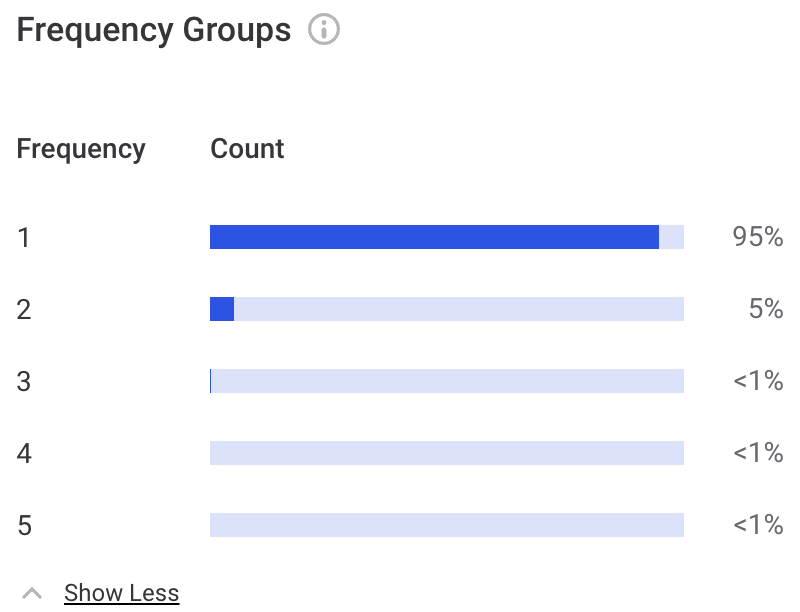
Use frequency groups and frequency analysis together to gain more insight into the data and determine what percentage of data contains duplicated values.
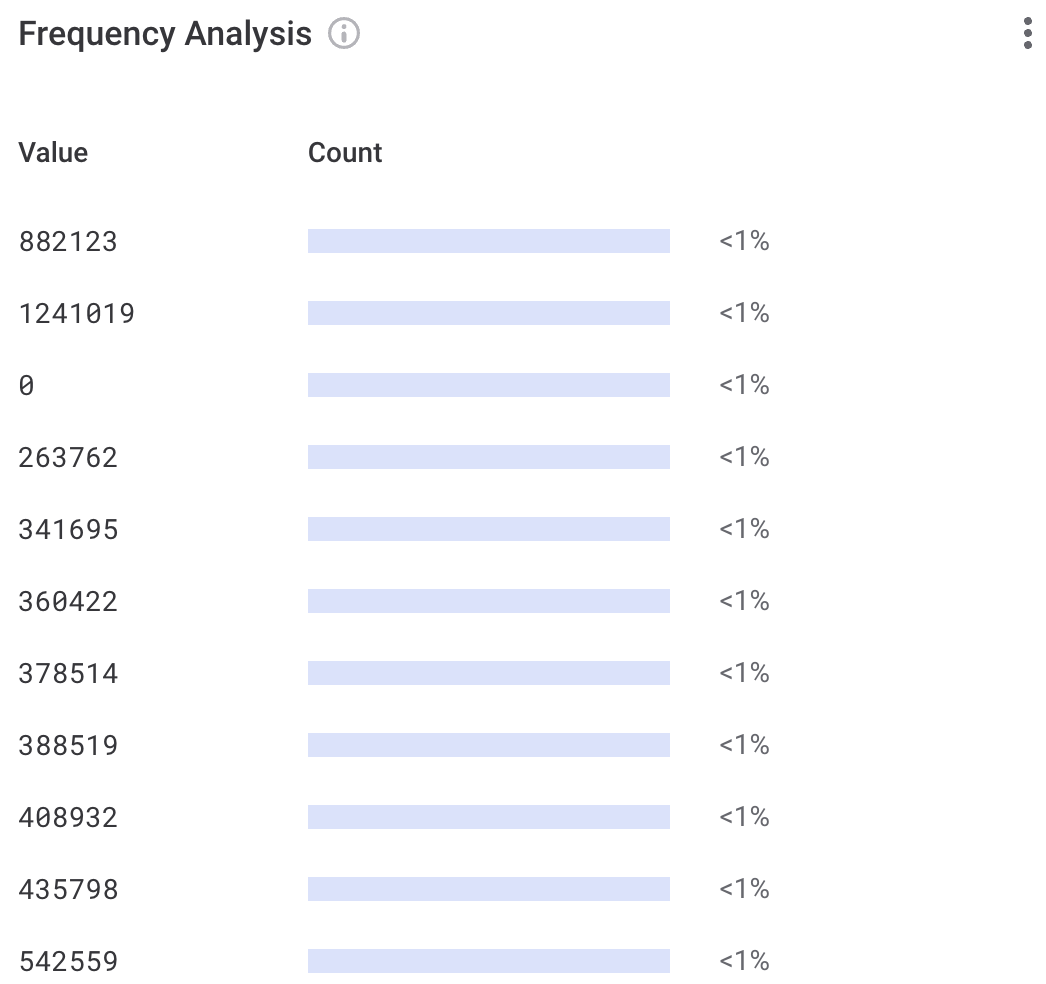
- Frequency Analysis
-
Shows how many times each value occurs in the data.
- Frequency Groups
-
Helps you determine how many unique and duplicated values there are in the data. Null values are exluded from this analysis.
In other words, each time a value occurs more than once in your data, a new frequency group is formed. If the data contains only unique values, the group size is 1.
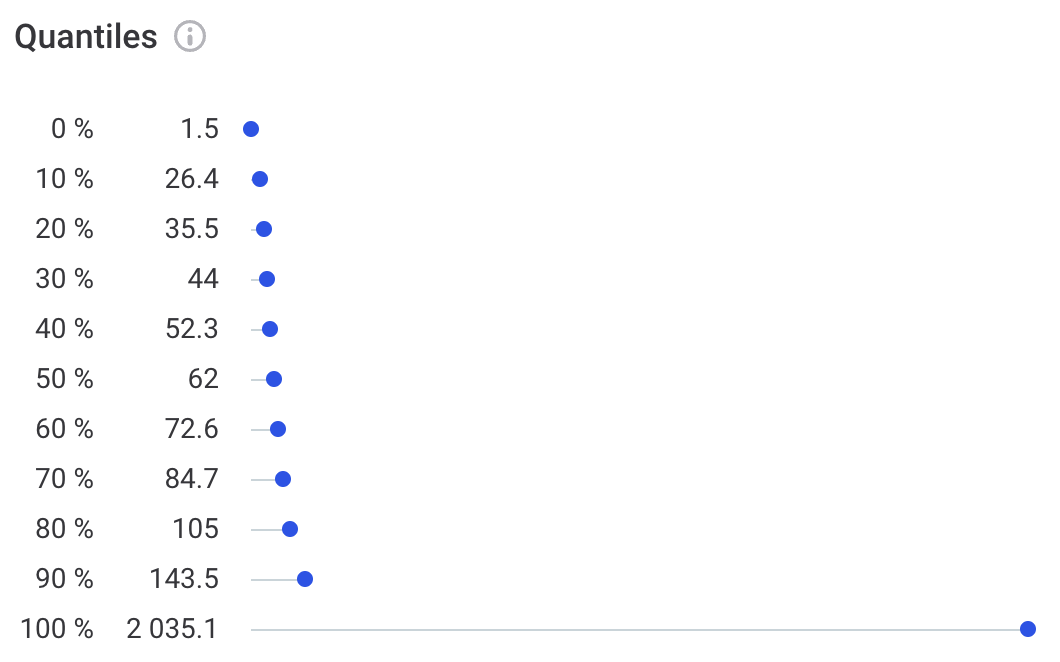
- Quantiles
-
Displays the values that occur at designated intervals in the ordered data set, with the first value on the list shown at 0% and the last value at 100%. The median value is at the 50% marker.
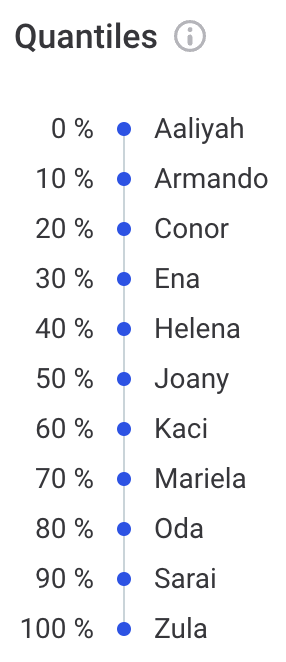
Quantiles are presented differently for numeric and non-numeric attributes:
-
Numeric quantiles analysis results
-
Non-numeric quantiles analysis results
-
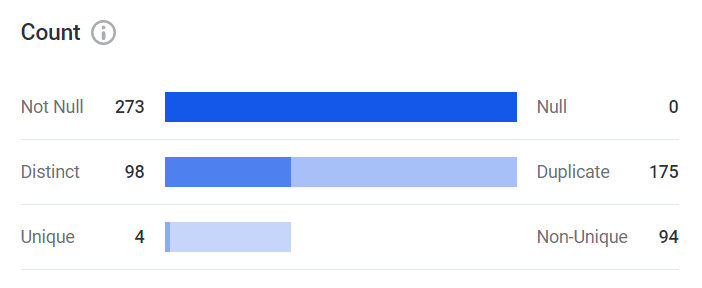
DQ insights
DQ insights display the following information:
-
Not Null - The number of values that are not null.
-
Null - The number of
NULLvalues in the data. -
Distinct - The number of values that are different from others (that is, the number of records that are either unique or non-unique).
-
Duplicate - The number of values that occur twice or more times in the data.
-
Unique - The number of values that occur only once in the data (that is, they have no duplicates).
-
Non-Unique - The number of values that have at least one duplicate.
Mask, pattern, length statistics
These analyses are only performed on non-numeric attributes.
| You can use Mask, Pattern, and Frequency analysis results to create a rule. See Create Rule from Profiling Results. |
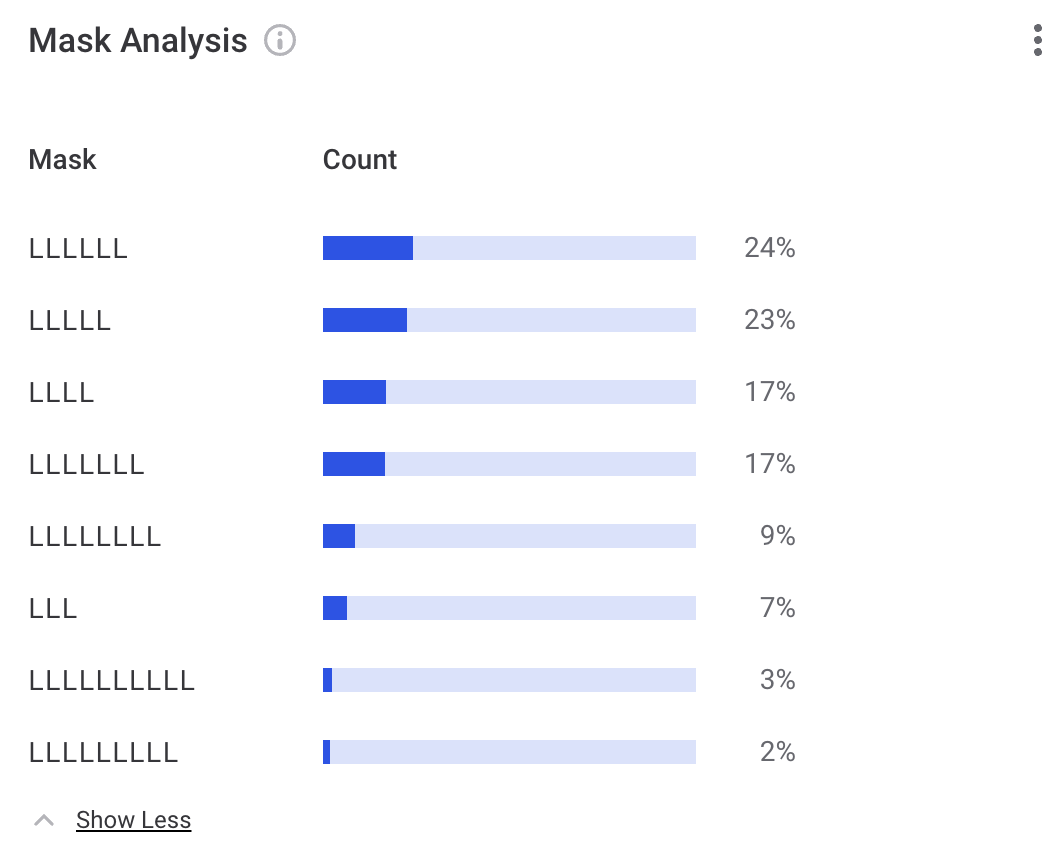
- Mask Analysis
-
Shows the structure of values in the data, where "L" corresponds to a letter and "D" corresponds to a digit.
This can help you discover unexpected patterns in data, such as finding single character records or records with digits in an attribute containing first names.
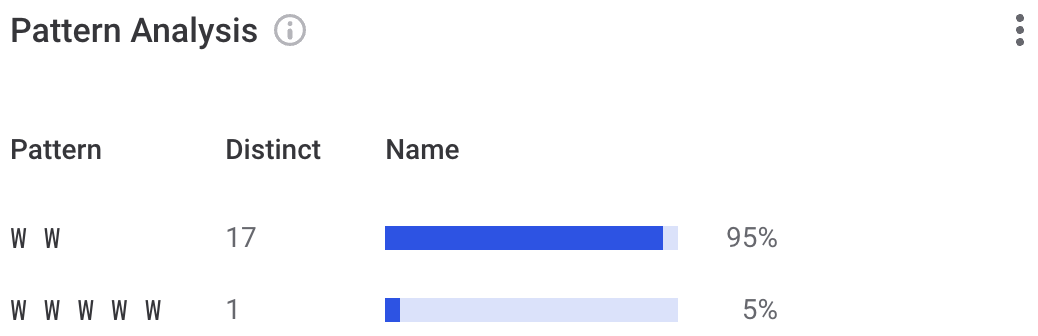
- Pattern Analysis
-
Similarly to mask analysis, it describes the structure of values in the data. The structure of the data is represented in the form of codes consisting of the following symbols: “W” represents a word, "N" a number, and “L” represents a letter.
It also shows how many records have the same pattern and how many of them are distinct.
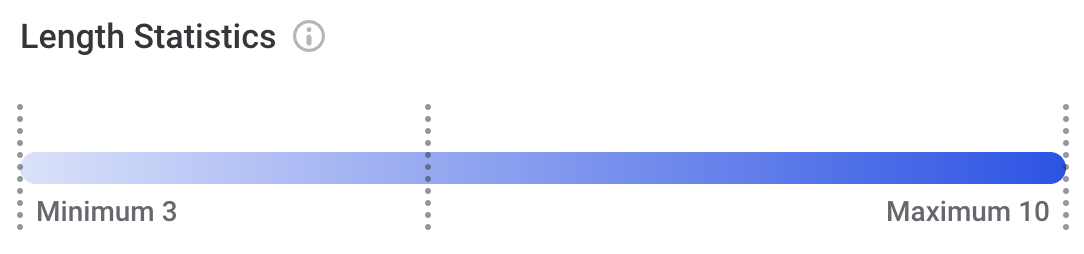
- Length Statistics
-
Provides statistics about the length of record values, including the minimum and maximum lengths, as well as the mean.
Next steps
After viewing the profiling results, you can start taking first steps to evaluate and improve the quality of your data.
For each attribute, you can:
-
Apply additional terms as needed: open the attribute detail and select Add Term.
-
Accept or reject the suggested glossary terms. See Term Suggestions.
-
Review and confirm or dismiss anomalies. See Anomaly Detection in Catalog Items.
-
Add rules to the attributes:
-
Apply an existing rule: in the three dots menu select Apply DQ rule. See Add DQ Rules to Attributes.
-
Select Check for Rule suggestions to get list of DQ rules suggested based on the profiling results, and accept or reject the suggestions. See Rule Suggestions.
-
Create a new rule from the Mask, Pattern, and Frequency analysis results. See Create Rule from Profiling Results.
-
Create a new rule: in the three dots menu select Create DQ rule. See Create DQ Evaluation Rule.
-
-
Create a reference table in ONE Data: in the three dots menu select Create reference table. See Import Data from a Catalog Item.
Was this page useful?