
Visualization Filters
Filters defined for the currently selected visualization apply only on the level of that visualization. To define global filters that apply to all the visualizations in your report instead, see Dashboards and Stories.
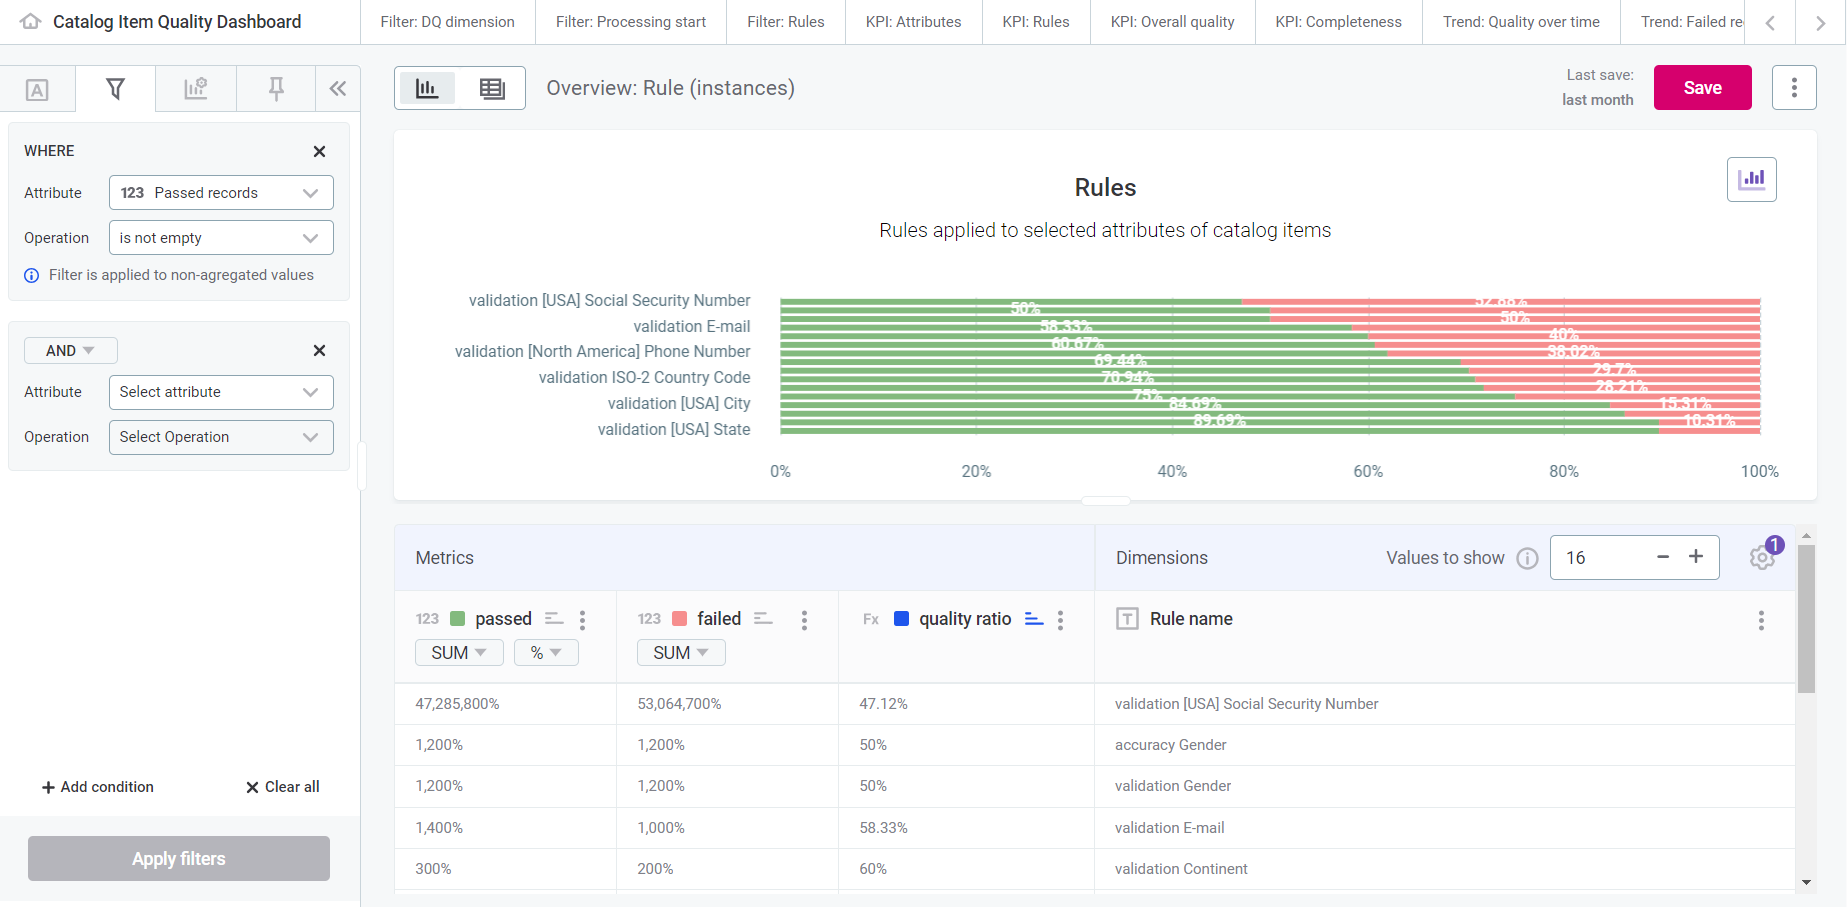
Filters tab
To include filters in your visualization, follow these steps.
Select data attributes
| From 15.3.0, Data Stories leverages data protection classification that prevents unauthorized access to protected data, as signaled by visual indicators (lock icons) and notifications. For more information, see Data Protection Classification in Data Stories. |
-
Open your visualization.
-
Go to the Filters tab.
You can also filter directly: open the three dots menu for a specific value in the Dimensions column and select Add to filter. This is available for text and date attributes, and the attribute value is added to the filter conditions using the equal to operation. -
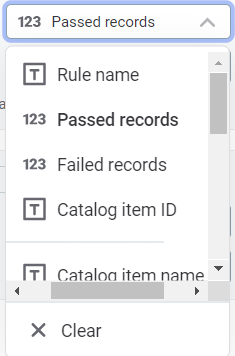
In Attribute, choose an attribute from the list. Recommended attributes (usually dimensions and metrics utilized in your chart) are displayed first.
Add more attributes as needed.
Specify the operation
In Operation, select an operation based on the data type of the chosen attribute: Numeric, Text, and Date.
The full list is as follows:
-
Numeric
-
Text
-
Date
-
>: Data from the selected column is displayed if it is greater than the value entered.
-
< : Data from the selected column is displayed if it is less than the value entered.
-
>=: Data from the selected column is displayed if it is greater than or the same as the value entered.
-
<=: Data from the selected column is displayed if it is less than or the same as the value entered.
-
=: Data from the selected column is displayed only if it matches the value entered.
-
≠ : data from the selected column is not displayed if it matches the value entered.
-
is empty: Data from the selected column is displayed if the cells have NULL values (no data).
-
is not empty: Data from the selected column is displayed if the cells do not have NULL values (data).
-
in range: Data from the selected column is displayed if it is in the range entered.
-
not in range: Data from the selected column is displayed if it is not in the range entered.
-
equal to: Data from the selected column is displayed only if it matches the value entered.
-
not equal to: Data from the selected column is not displayed if it matches the value entered.
-
contains: Only applicable to text (strings). Data from the selected column is displayed if it matches the text specified in the filter.
-
does not contain: Only applicable to text (strings). Data from the selected column is displayed if it doesn’t match the text specified in the filter.
-
is empty: Data from the selected column is displayed if the cells have NULL values (no data).
-
is not empty: Data from the selected column is displayed if the cells do not have NULL values (data).
-
equal to: Data from the selected column is displayed only if it matches the date entered.
-
not equal to: Data from the selected column is not displayed if it matches the date entered.
-
in range: Data from the selected column is displayed if it falls within the selected time period range.
-
not in range: Data from the selected column is displayed if it falls outside the selected time period range.
-
before: Data from the selected column is displayed only if the date registered occurred before the chosen date.
-
after: Data from the selected column is displayed only if the date registered occurred after the chosen date.
-
is empty: Data from the selected column is displayed if the cells have NULL values (no data).
-
is not empty: Data from the selected column is displayed if the cells do not have NULL values (data).
-
in last: Data from the selected column is displayed only if it falls within the last time frame chosen by the user and its unit: Days, Weeks, Quarters, Months, Years.
-
in current: Data from the selected column is displayed only if it falls within the current time period chosen by the user: Day, Week (Sun-Sat), Week (Mon-Sun), Month, or Year.
Enter values
Here, the steps diverge depending on the type of attribute and operation chosen:
Numeric attributes
-
Simple Comparisons (
>,<,>=,⇐,=,≠): An additional input field appears where you can enter a numerical value. Use the plus and minus icons to increase or decrease the value by one unit. -
No Data (is empty, is not empty): No additional input field appears as these filters validate cells based on the presence or absence of NULL values.
-
Range (in range, not in range): Two adjacent input fields appear where you need to enter the lower and upper limits of the range.
Text attributes
-
No Data (is empty, is not empty): No additional input field appears as these filters validate cells based on the presence or absence of NULL values.
-
Text Entry: An input field appears. Select Add items to provide the specific text values you want to filter by.
Initially, the menu shows a limited set of recommended values at the top. Choose from this list or use search to find the desired values. The search is case-sensitive.
By default, the search only looks in the recommended results. To broaden the search to all column values, select Search in all column values. -
Wildcard Search (contains, does not contain): You can add a percentage sign (
%) before or after the text. This restricts the results to show only the ones that either finish or start (respectively) with the expression indicated.For example,
%sshows the results that end with-s, ands%shows the results that start withs-.
Date attributes
-
Specific Date (equal to, not equal to, before, after): A single input field appears. Click it to open a calendar and select the date.
-
No Data (is empty, is not empty): No additional input fields are required.
-
Date Range (in range, not in range): Two fields appear for entering the start and end dates.
-
Relative Date (in last): Two adjacent fields appear, one for entering the number of periods and the other for choosing the type of period (Days, Weeks, Quarters, Months, Years).
-
Current Period (in current): A field appears for specifying the current time period: Day, Week (Sun-Sat), Week (Mon-Sun), Month, Year.
Manage filters
-
Select Apply filters so your filters are updated on the dashboard.
-
To add more filters, select Add condition and repeat the previous steps. If you add more than one condition, you have the possibility to alternate between
ANDandORoperators.-
AND: Both conditions need to be met in order for the results to display. -
OR: One of the two conditions needs to be met in order for the results to display.
-
-
To remove all filters, select Clear all.
-
For each filter, you can perform some additional actions:
-
To modify a filter, select the condition and make the necessary adjustments.
-
To remove a single filter, select the trash icon next to the filter you wish to delete.
-
Was this page useful?