
Get Started with Data Observability
Welcome to Ataccama Data Observability. Here we’ll help you discover the key features of Ataccama Data Observability (DO) module and help you gain a basic understanding of the tool.
Once you learn your way around the platform, start using it for your own projects or explore other topics in more depth.
|
How to use the guide?
You can follow the steps one by one, in the order in which they’re given, or choose the topic you’re most interested in and revisit other sections later. Don’t hesitate to make adjustments to the steps along the way. This will give you a better idea of the actual workflow as the process is often not linear and consists of multiple iterations. This guide assumes some initial data (Demo content pack) is already available in the application. |
Before you start
We recommend you begin with Get Started with Catalog and Glossary and Get Started with Data Quality as this guide builds on the concepts described there. However, you’ll be able to follow this tutorial without completing all the steps from these guides.
The Ataccama Data Observability module is built on and expands existing data quality monitoring capabilities of the ONE platform. This allows you to understand the state of your data based on the information you’re collecting or signals you’re receiving about that data, such as data quality issues, anomalies, or schema changes.
The key components of data observability are the following:
-
Data quality monitoring regularly evaluates data against predefined data quality rules, providing you insights into trends in your data. DQ results are based on business terms, with defined DQ rules mapped to terms.
-
AI-powered anomaly detection helps you identify unpredictable data quality issues, such as sudden drops in data volumes or average values in a specific attribute.
-
Data discovery consists of monitoring and tracking data issues with the goal of understanding what data appears in your critical systems (especially if you work with a lot of PII).
Continuous data discovery within an automated data catalog (including a business glossary) also plays a critical role in data quality monitoring as it lets you track schema changes, such as newly added tables, deleted tables, and changes in attribute types.
Overall, data observability offers a more holistic approach compared to data quality monitoring, leading to a deeper understanding of how your data systems interconnect and helping you uncover actionable insights into the health of your system.
|
Recommended resources
|
Configure data observability for a source
Let’s take a look at how you can configure data observability for your data source. This way, you’ll be able to continuously discover new or modified data and observe health levels of data in selected business domains, all from a single location.
You configure not only what you want to observe and how regularly but also how often you want to be notified about any issues, for example, if there’s an anomaly detected, the data quality in the source drops under the set threshold, or there are some schema changes in the source system.
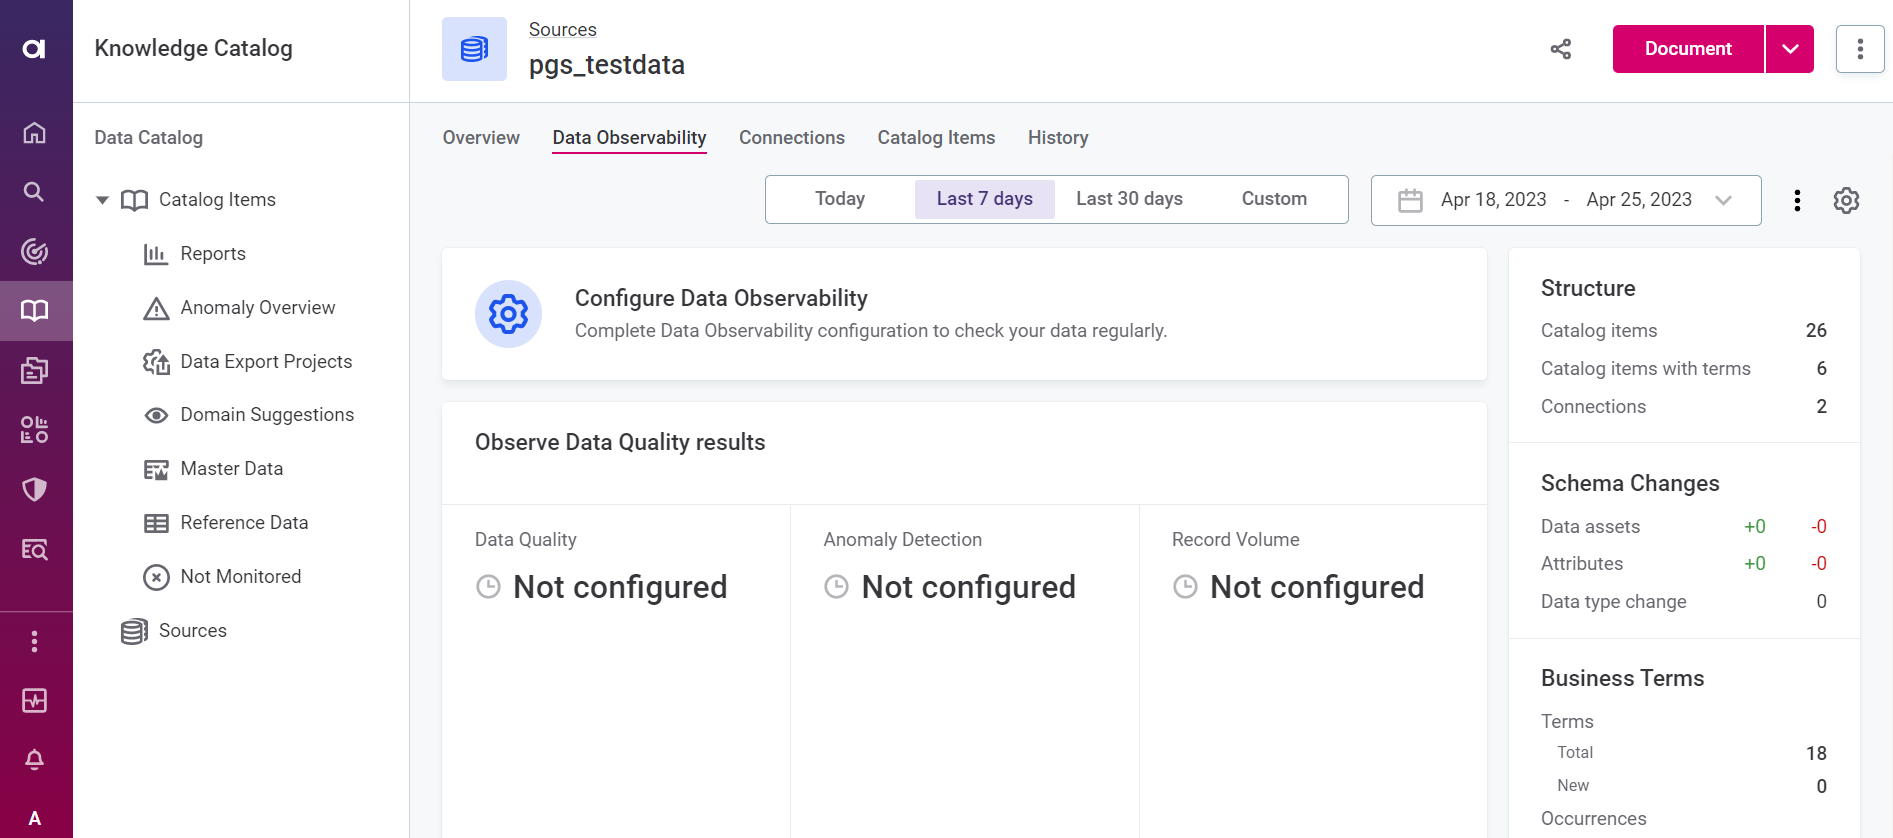
To start, find and open the source you want to work with in Knowledge Catalog. In our case, this will be pgs_testdata (available with the Demo content pack).
On the Data Observability tab, verify that there is no configuration in place. Select Configure Data Observability and opt for Basic configuration.
|
You can continue working with the source you selected even if data observability has already been configured. Access the configuration using the gear icon. |
Select Add Term and choose the business terms (domains) you want to monitor.
These should be the terms that make the most sense for your organization.
For pgs_testdata, these could be E-mail, Surname, and First name.
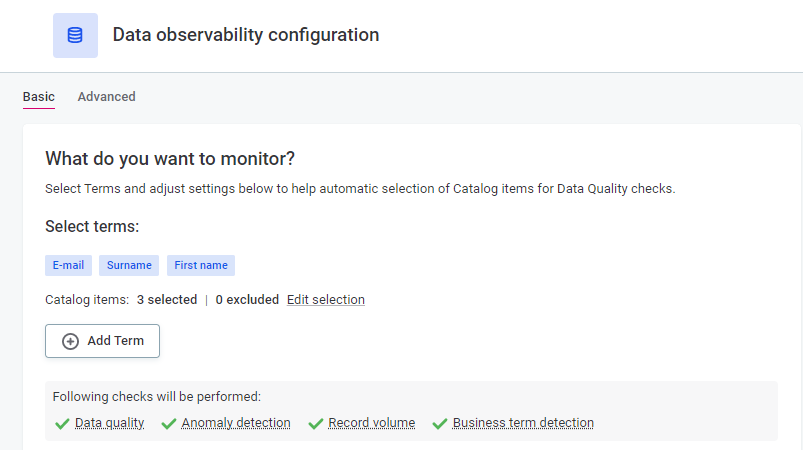
Once you select the terms, you can see how many catalog items this includes. Review and remove some of these as needed using the Edit selection option.
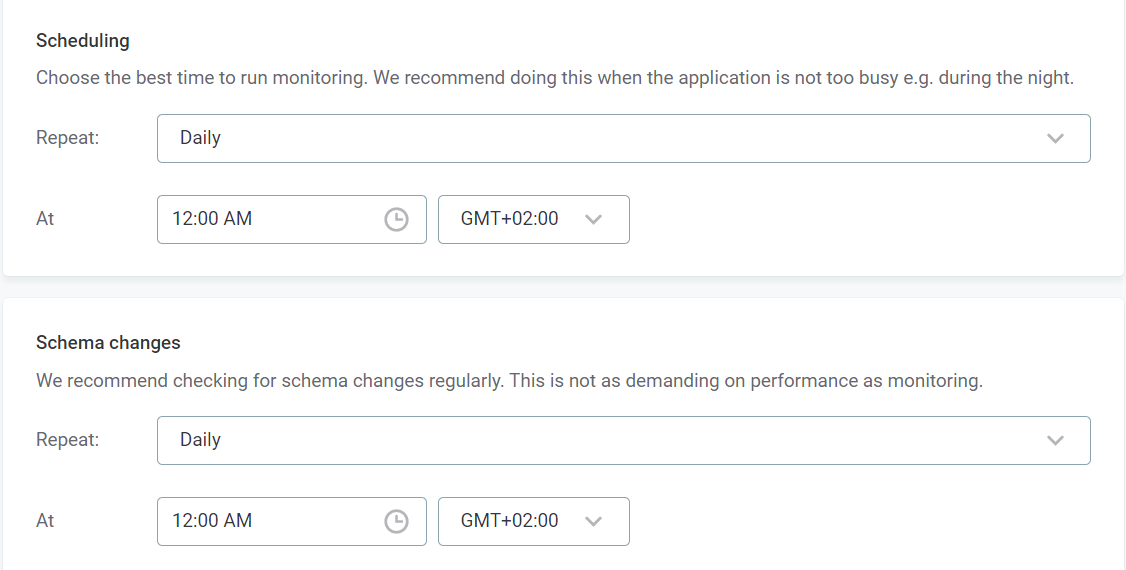
Next, define the schedules for monitoring and detecting schema changes. Pick any time pattern that works for you. Ideally, monitoring should run when there aren’t many users active.
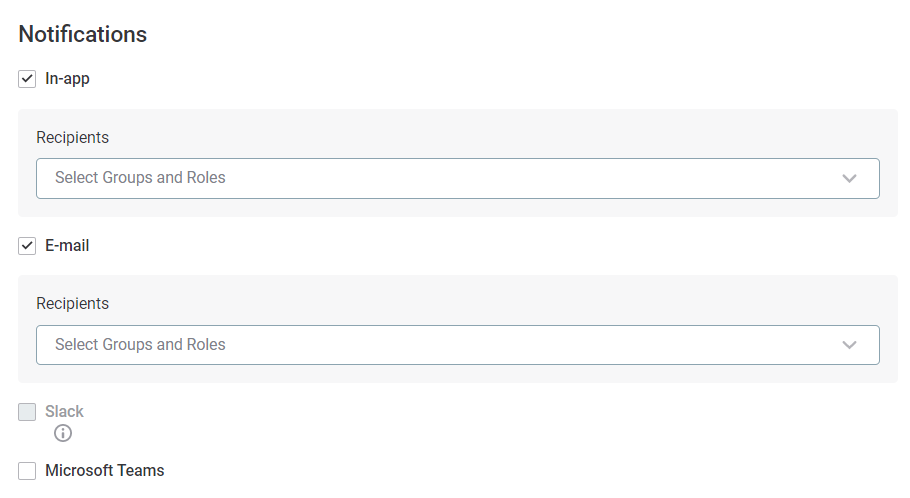
Choose how you want to be notified. To receive notifications in the application, select In-app. You can also select more than one option, although additional configuration is needed to integrate with Slack and Microsoft Teams.
|
The basic configuration is enough in most cases. If you’re looking for a challenge, use the Advanced configuration option. This way, you can fine-tune the settings further: set specific thresholds for DQ evaluation and the anomaly detection sensitivity, adjust schema changes detection, and more. 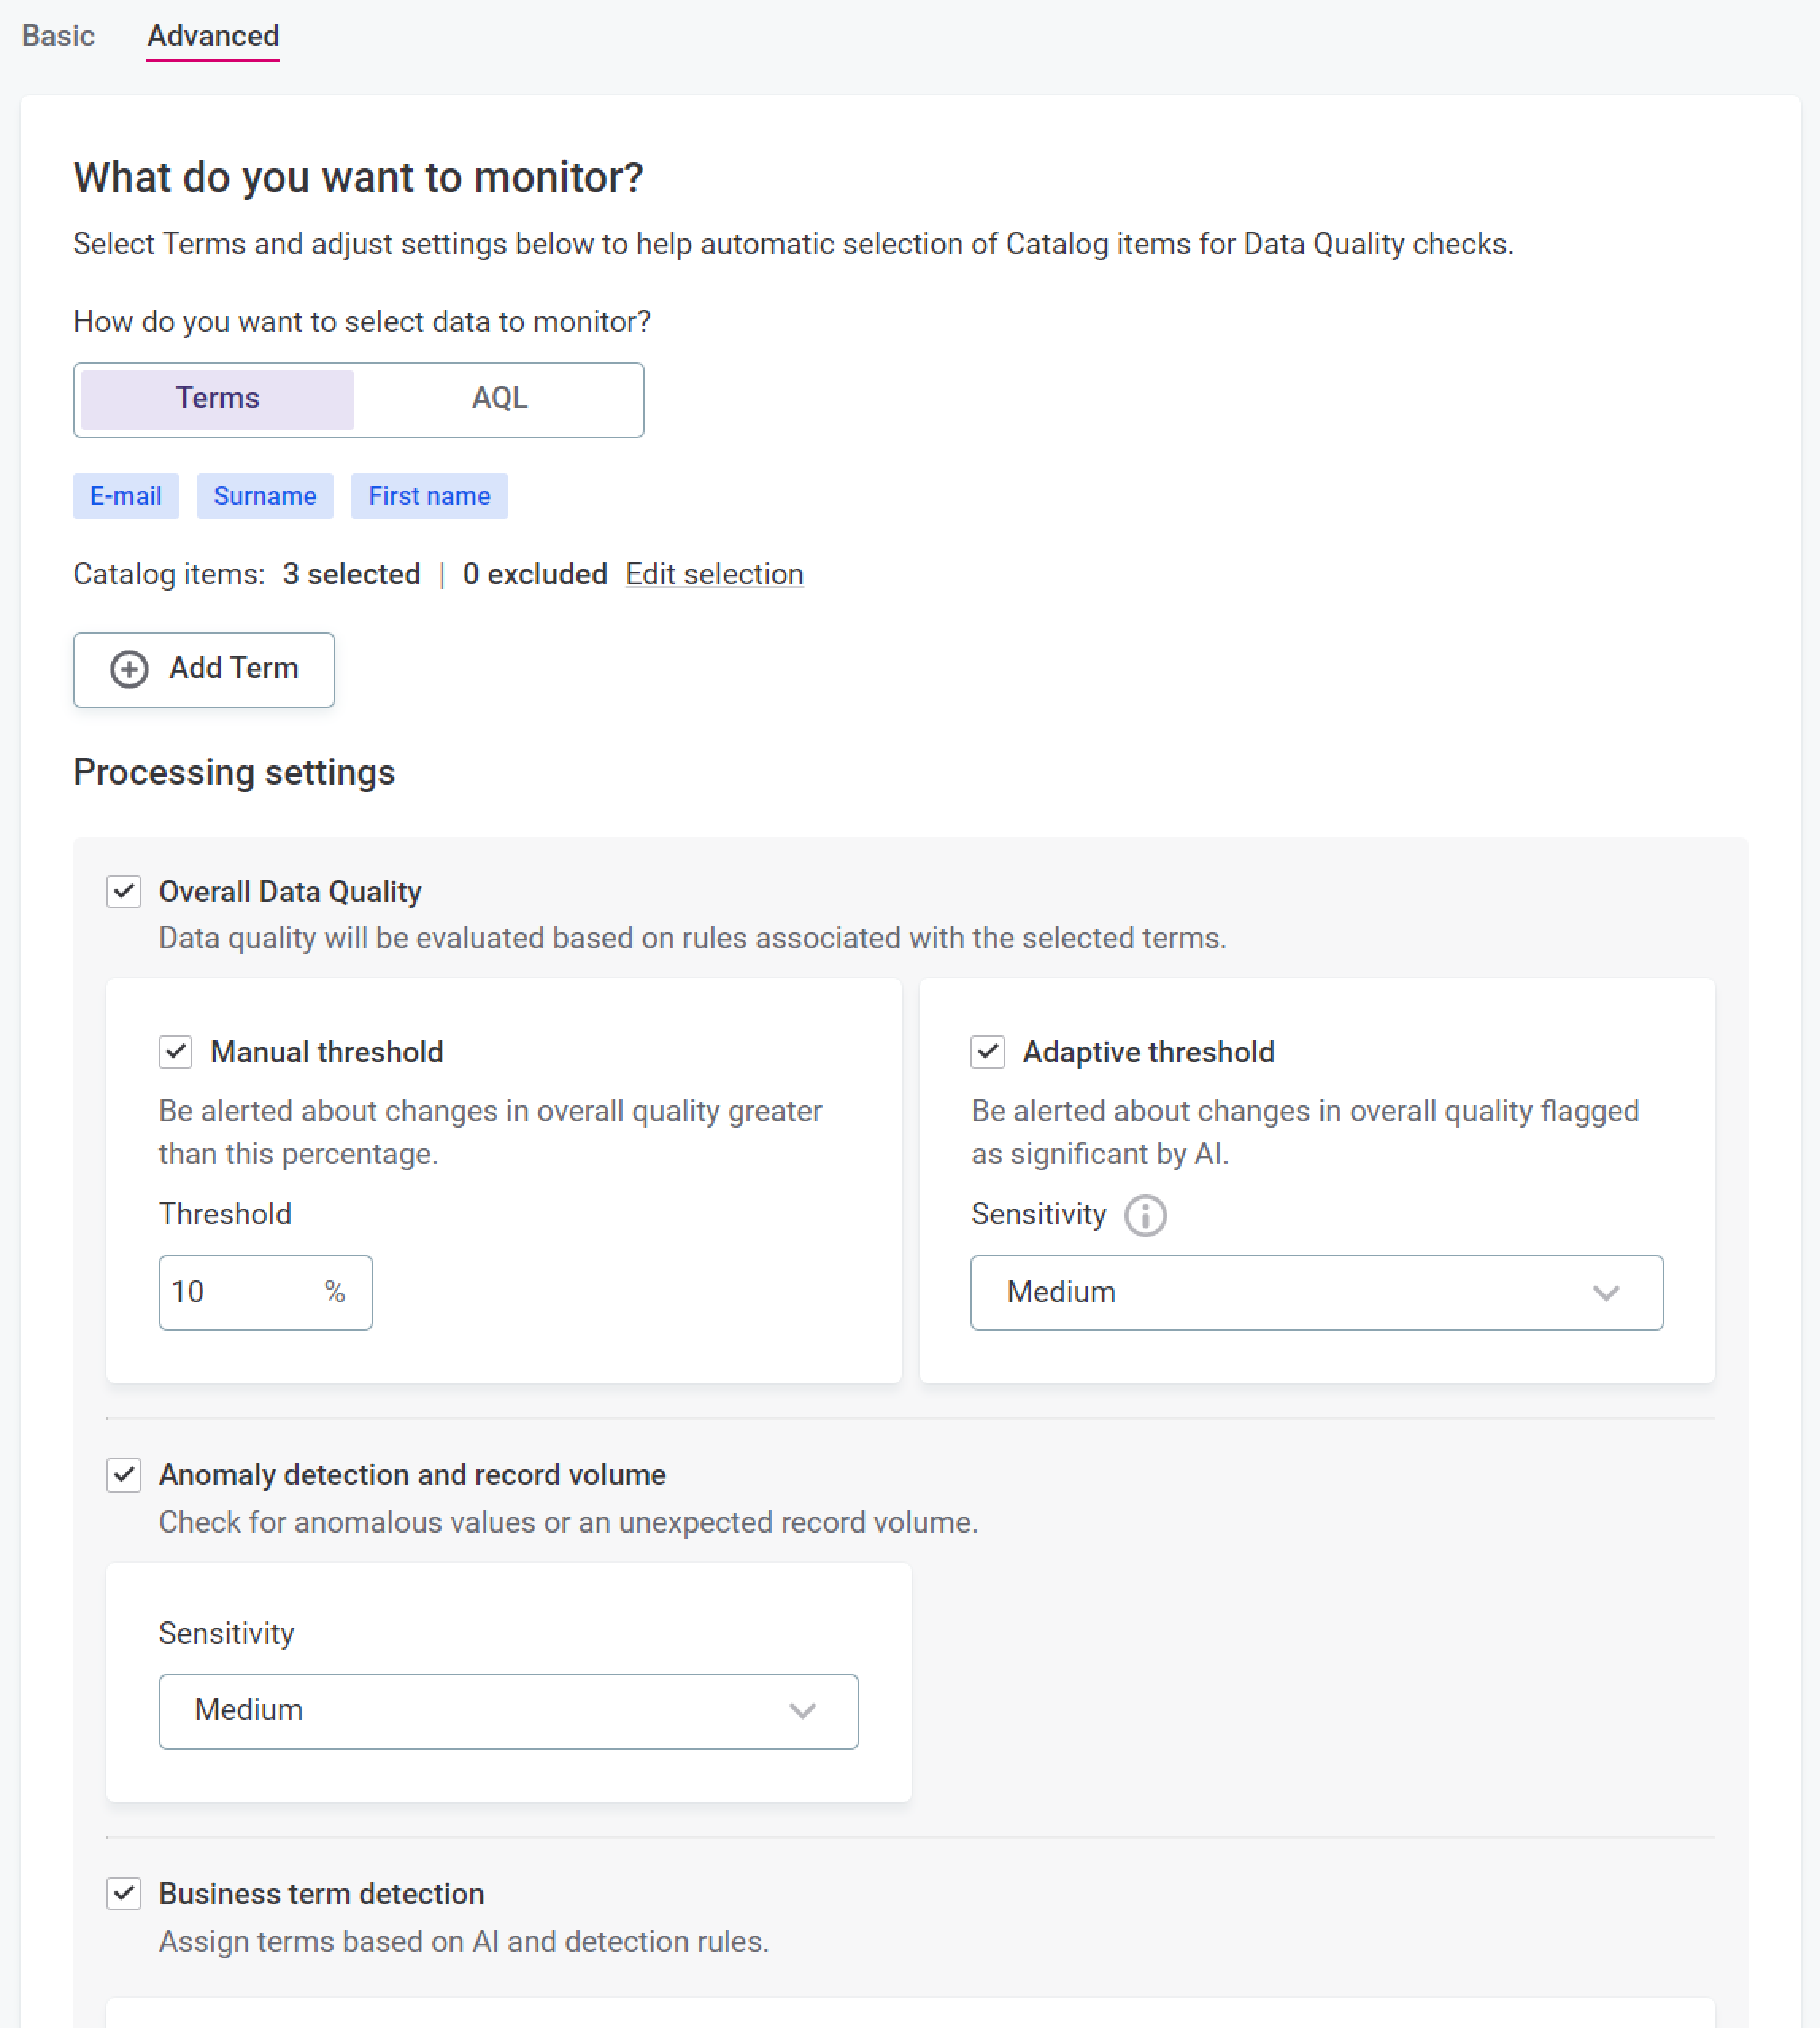
|
Once you’re done with the configuration, save your changes. The tool now observes the data in your source based on the schedule you defined.
|
If you want to check the monitoring results right away, select Manual Run in the three dots menu. 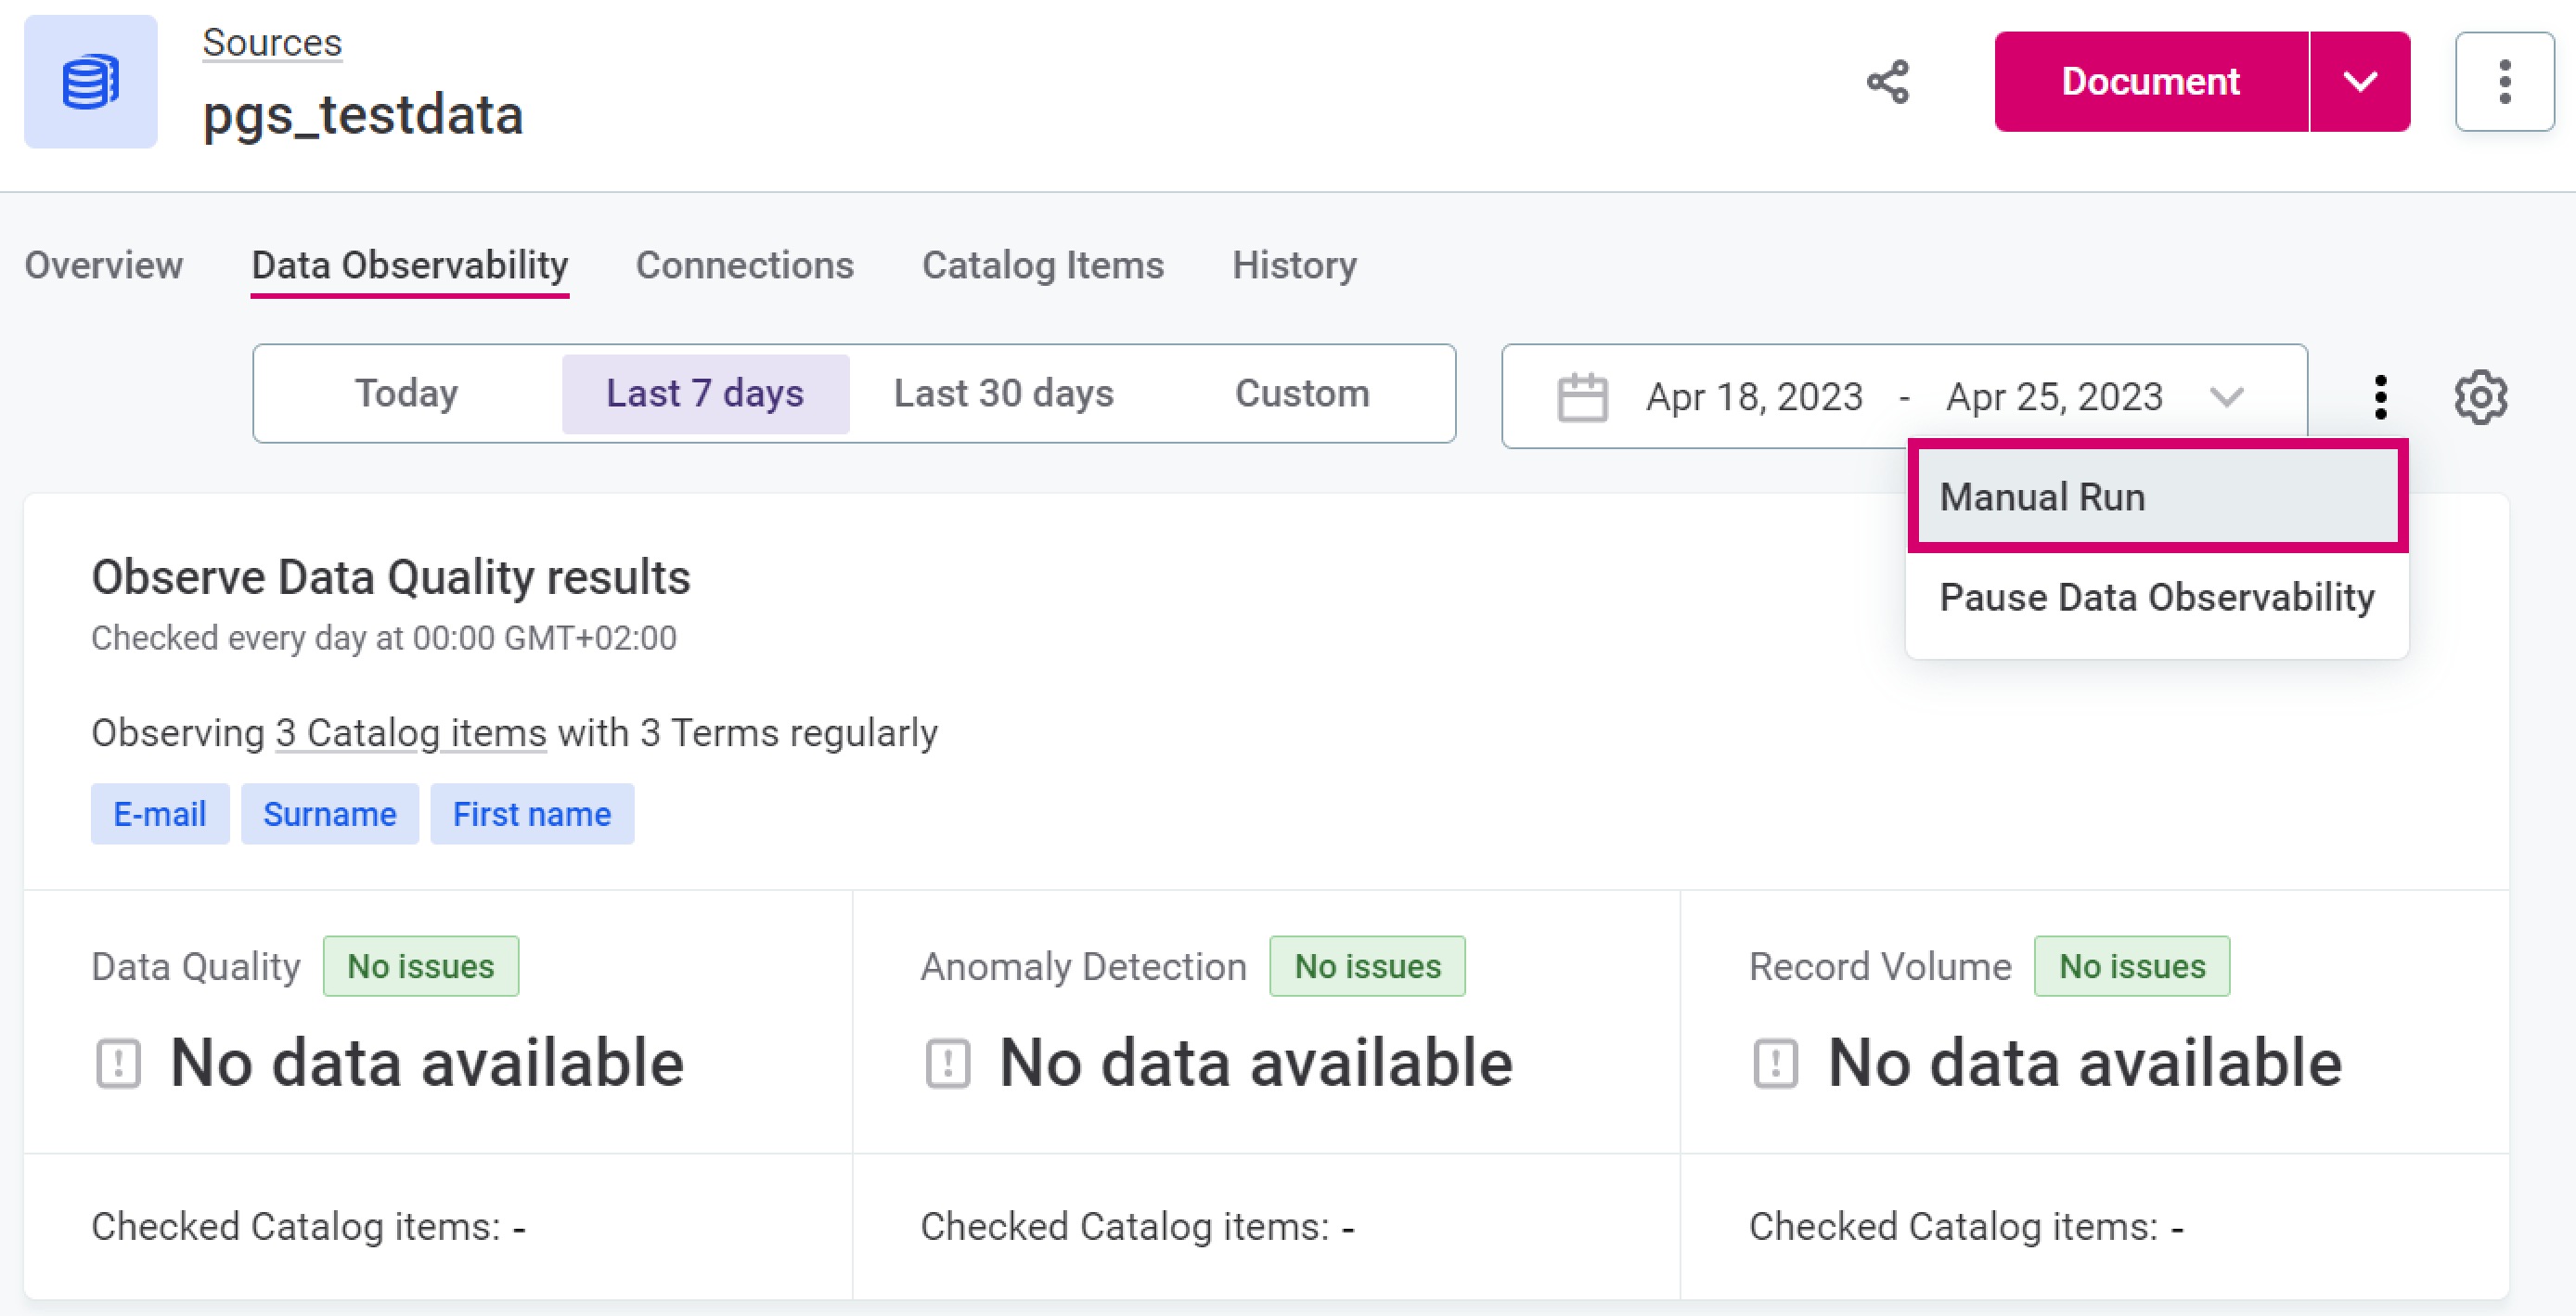
|
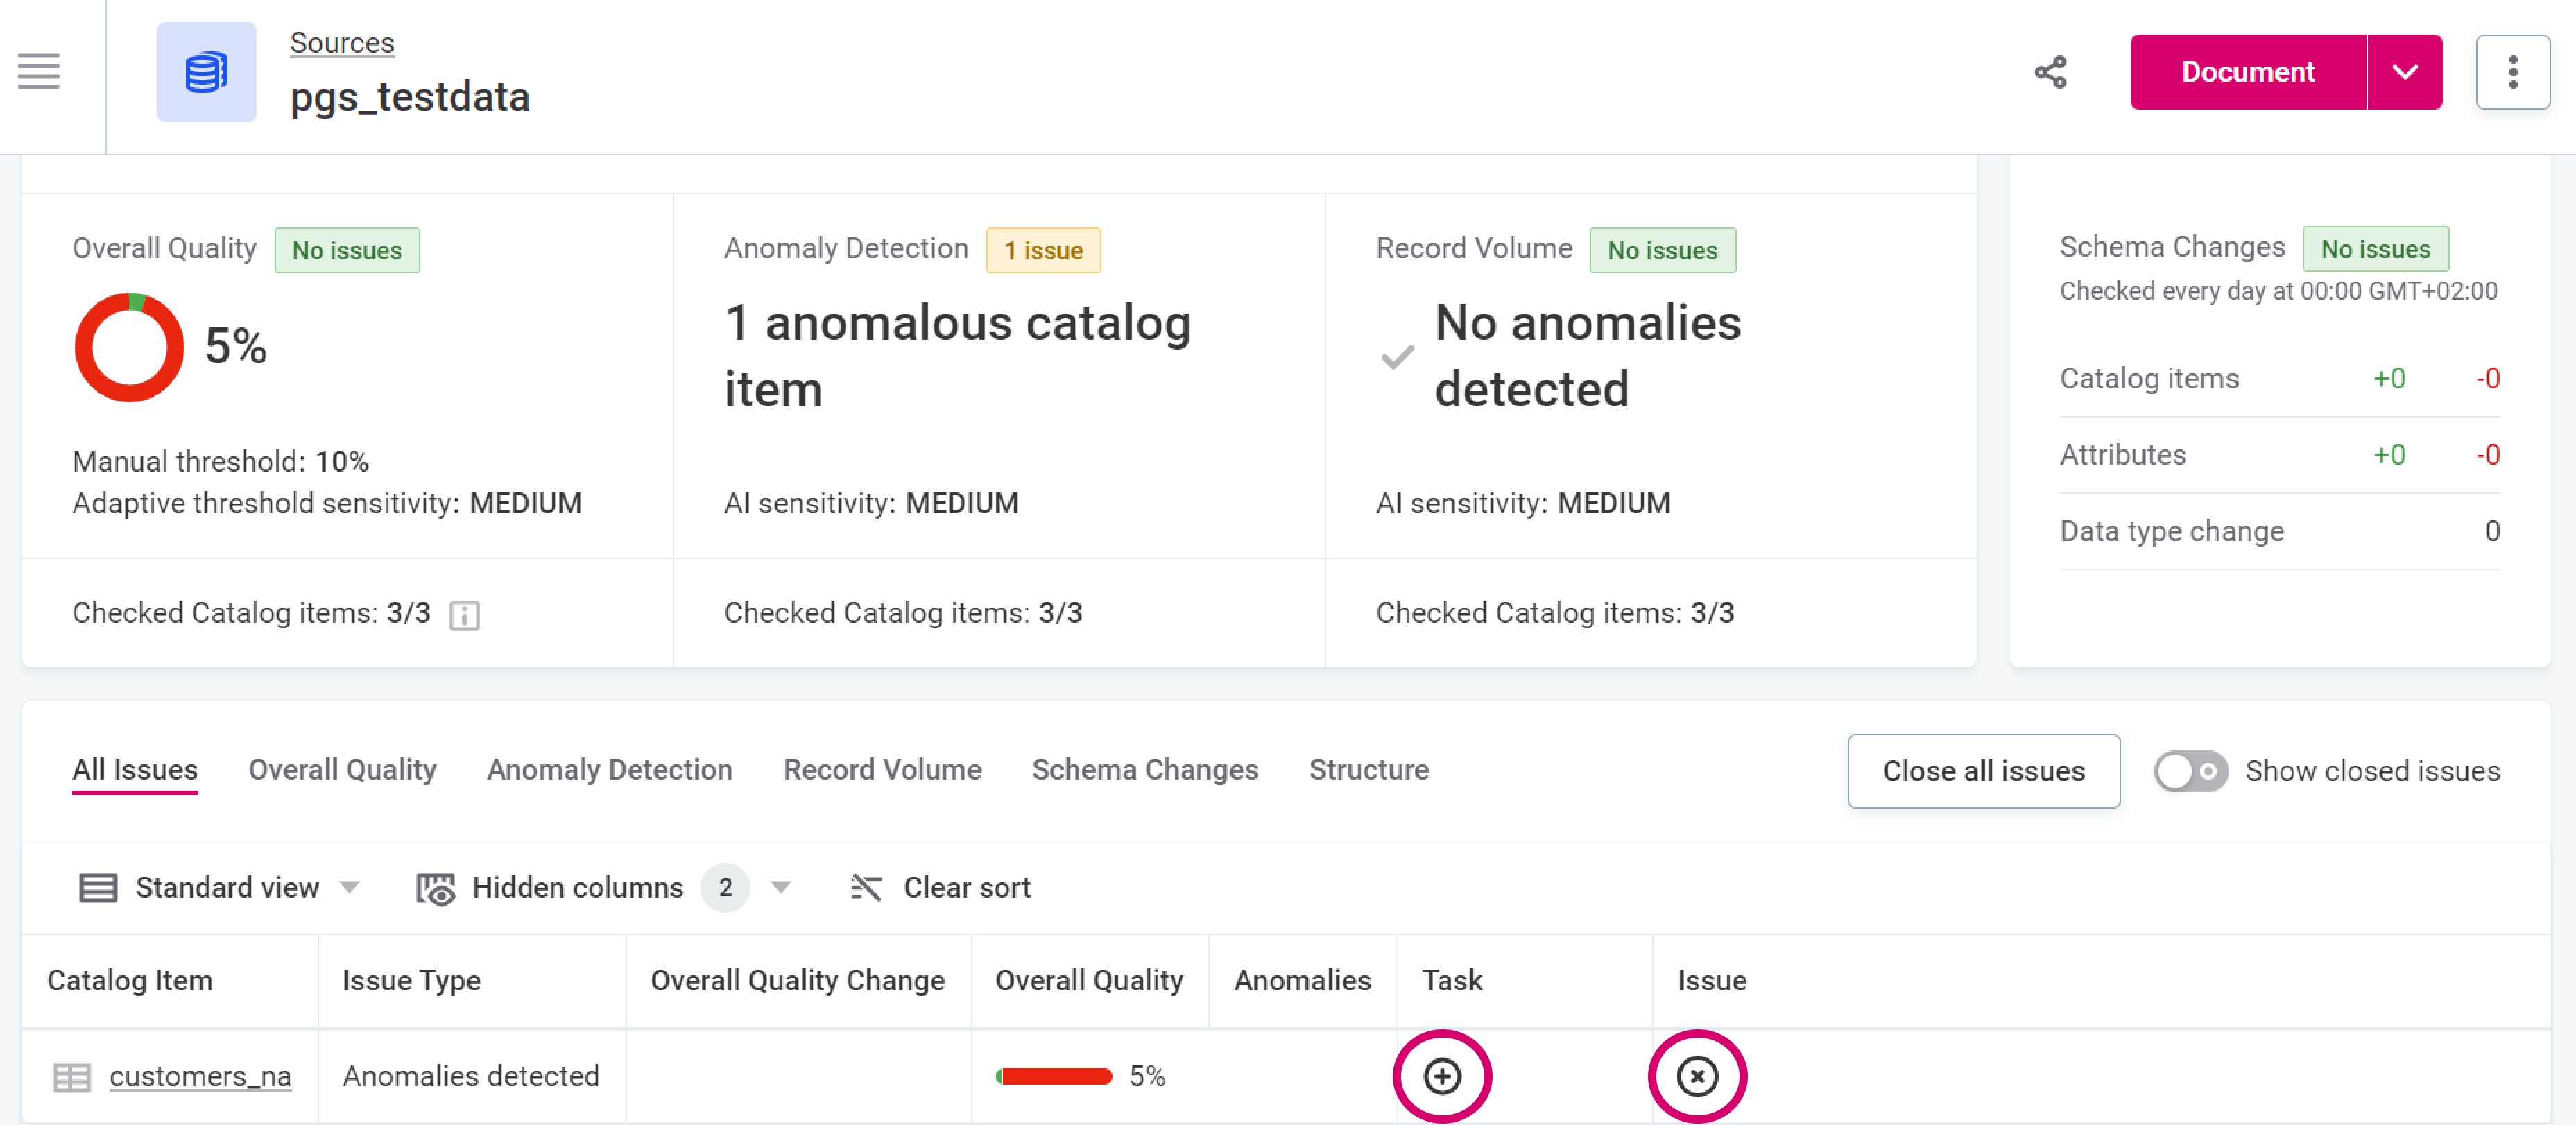
View and interpret the results obtained: these vary depending on the source selected and the current state of data in it.
Check the reported issues more closely. Close the issue if it is not relevant or create a task and assign it to the coworker responsible for the asset.
|
View the status of all your sources from the Data Observability tab. 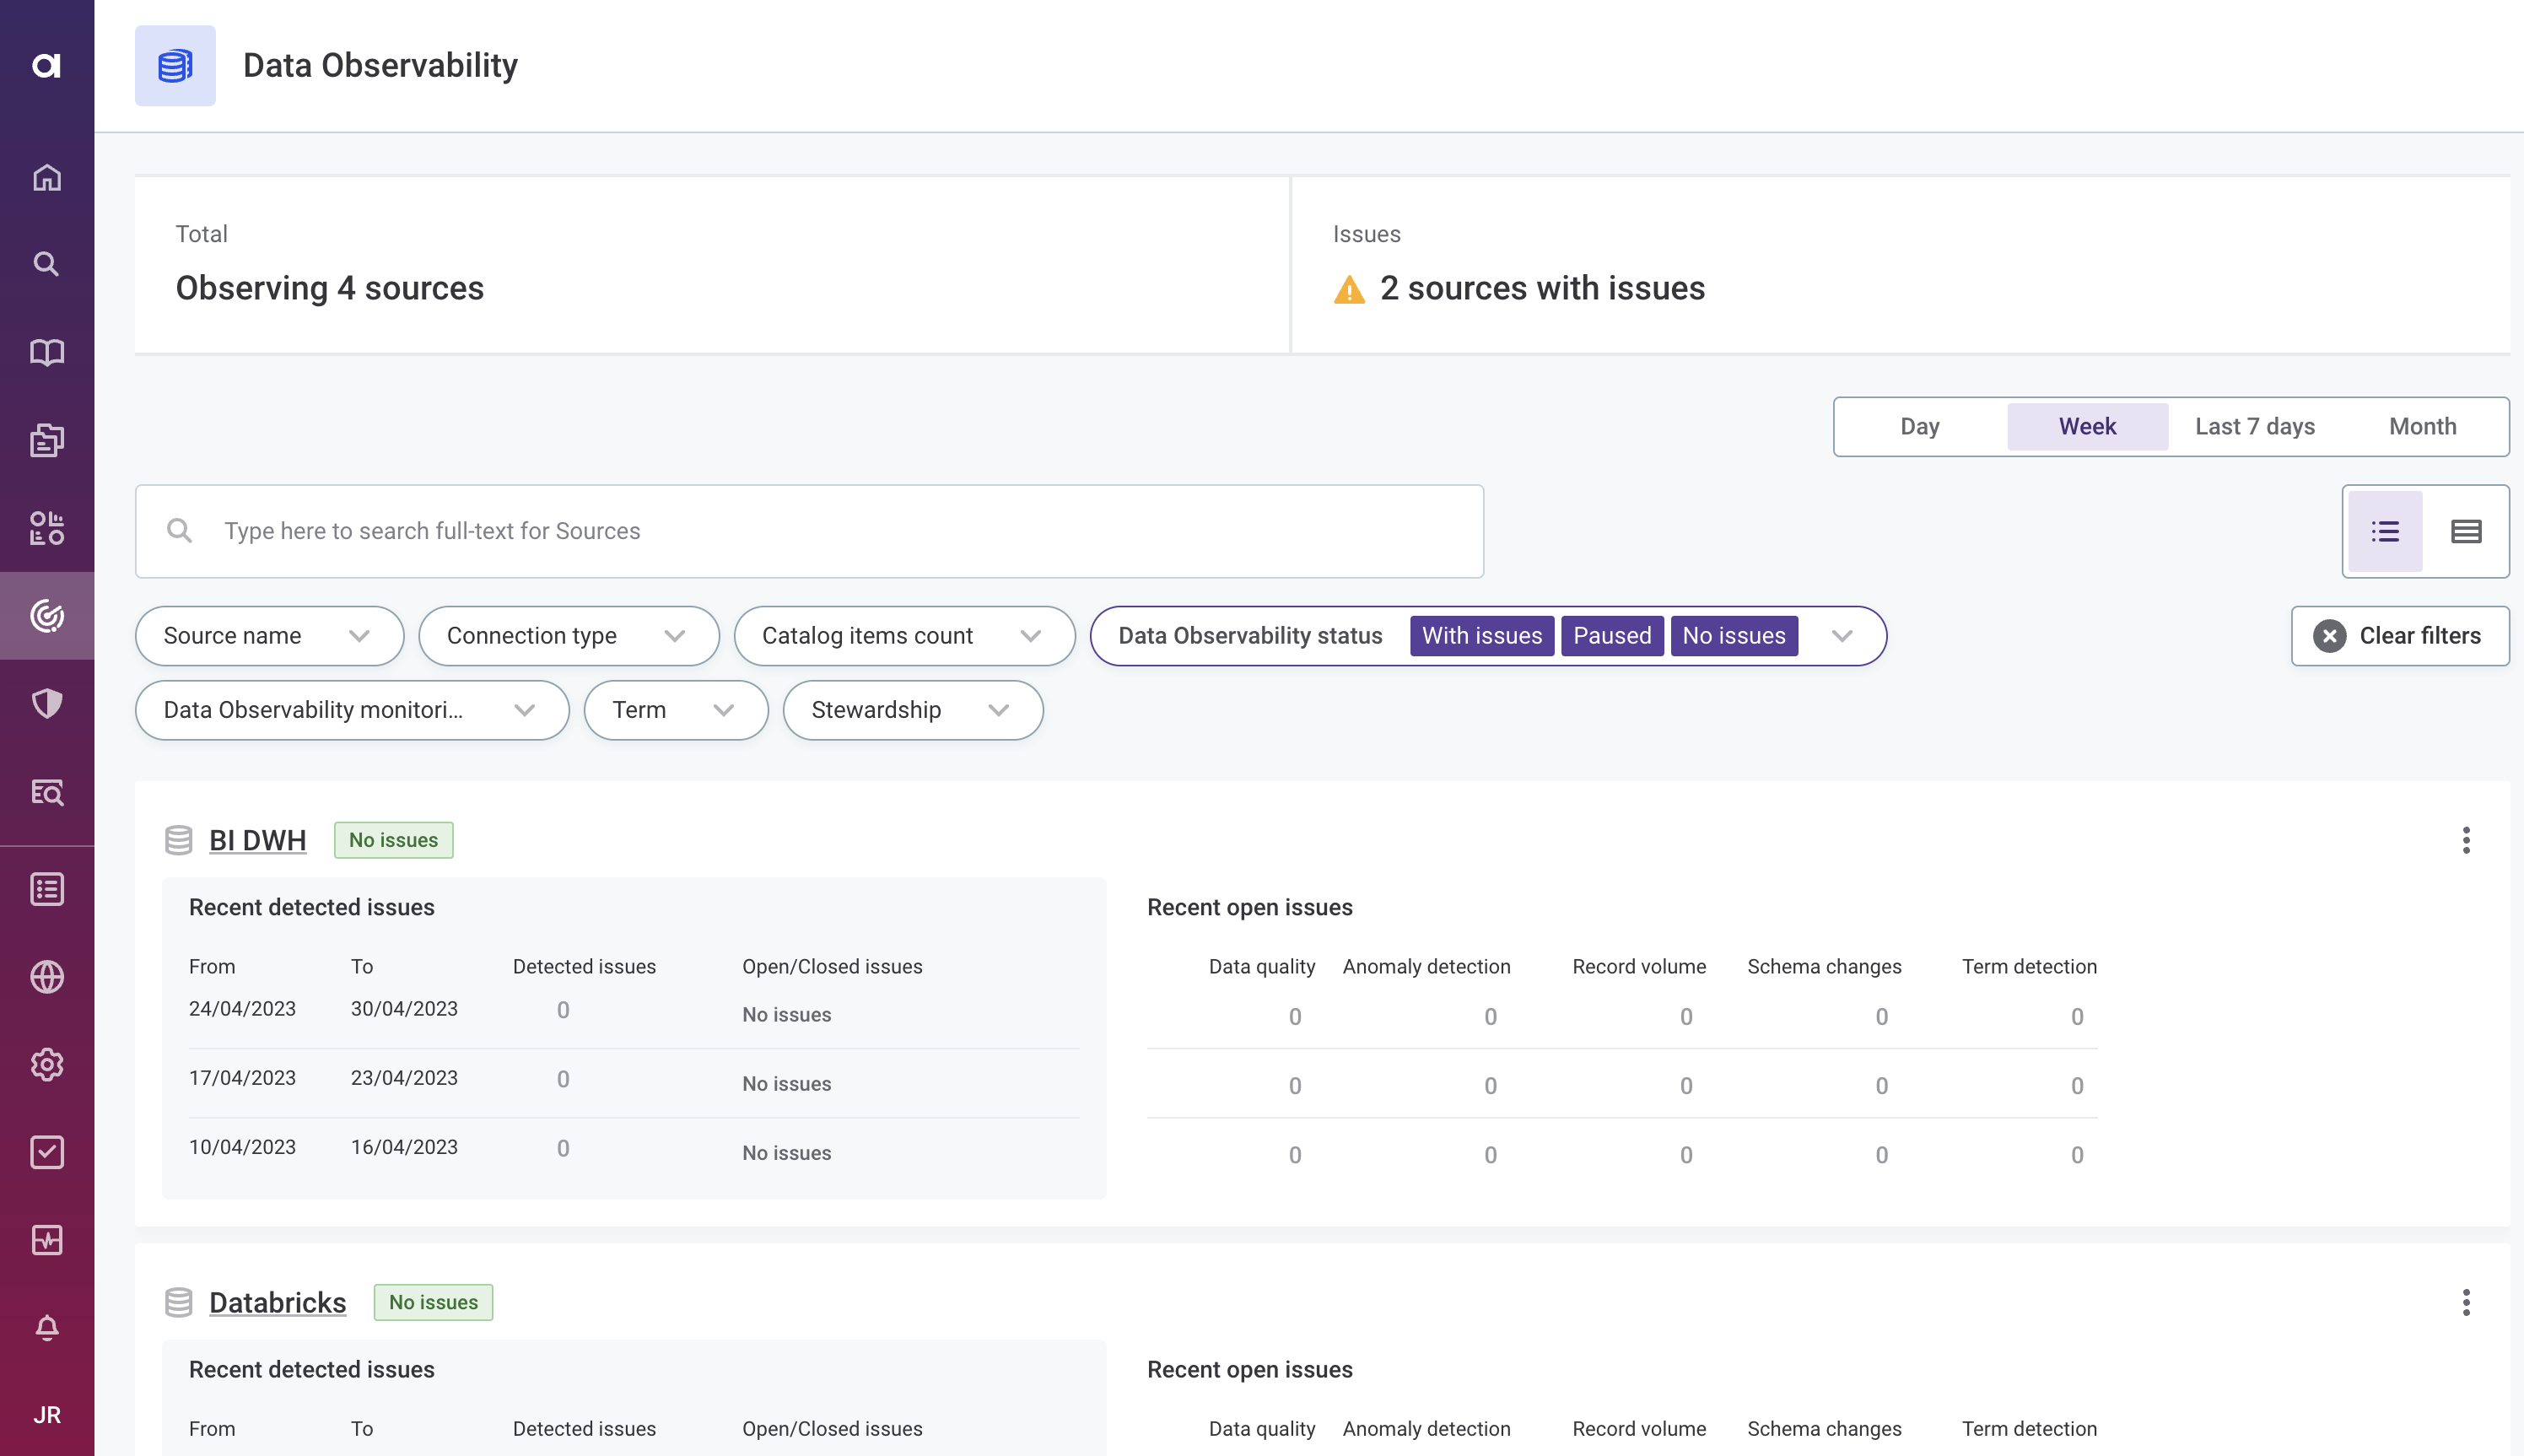
|
|
Recommended resources
|
Was this page useful?