
Anomaly Detection in Monitoring Projects
Anomaly detection in monitoring projects can use either the time-independent (Isolation Forest) or time-dependent model. For more information, see Anomaly Detection: Behind the Scenes.
|
The time-dependent model of anomaly detection used in monitoring projects detects anomalies on the profiles of the items being monitored. You can enable this for any item for which there are sufficient historic profile versions. This should not be confused with the time series analysis, which can be configured on transactional data catalog items. See Time Series Data. |
Enable anomaly detection
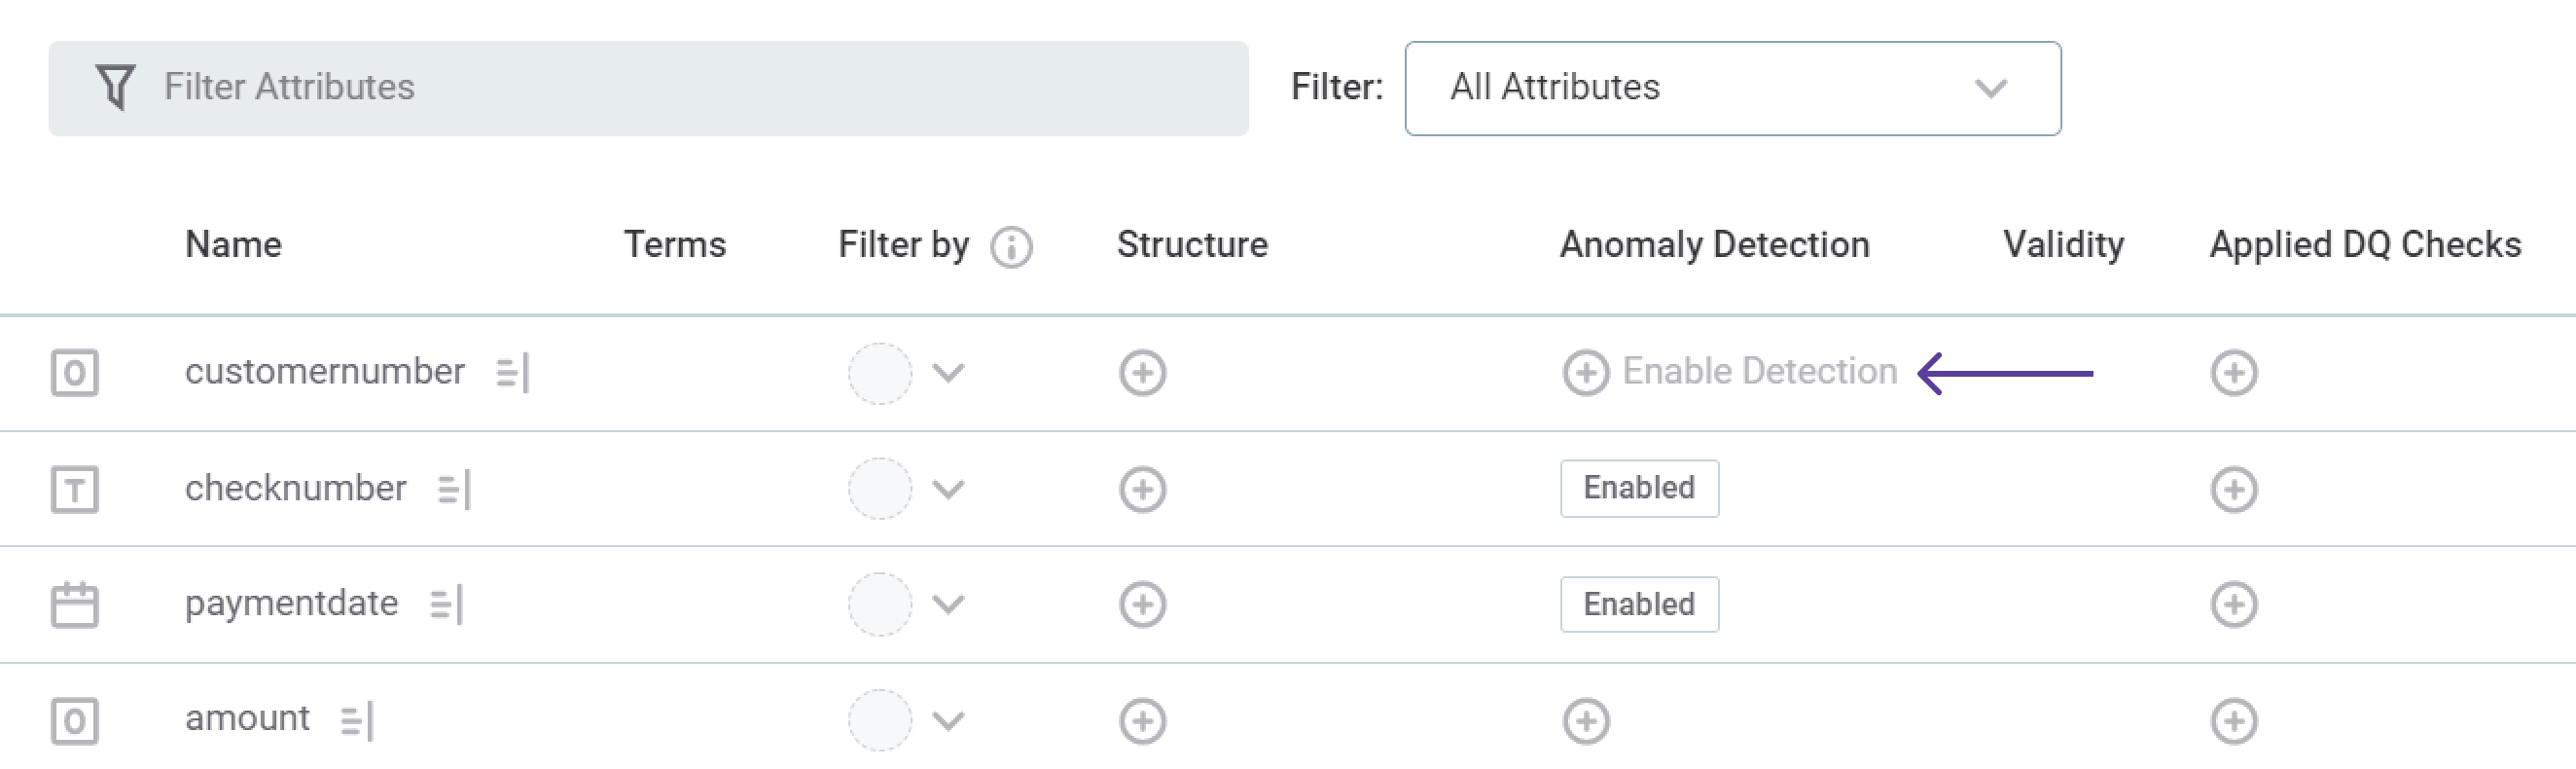
| Within monitoring projects, anomaly detection can be enabled on an attribute-by-attribute basis. |
To do this:
-
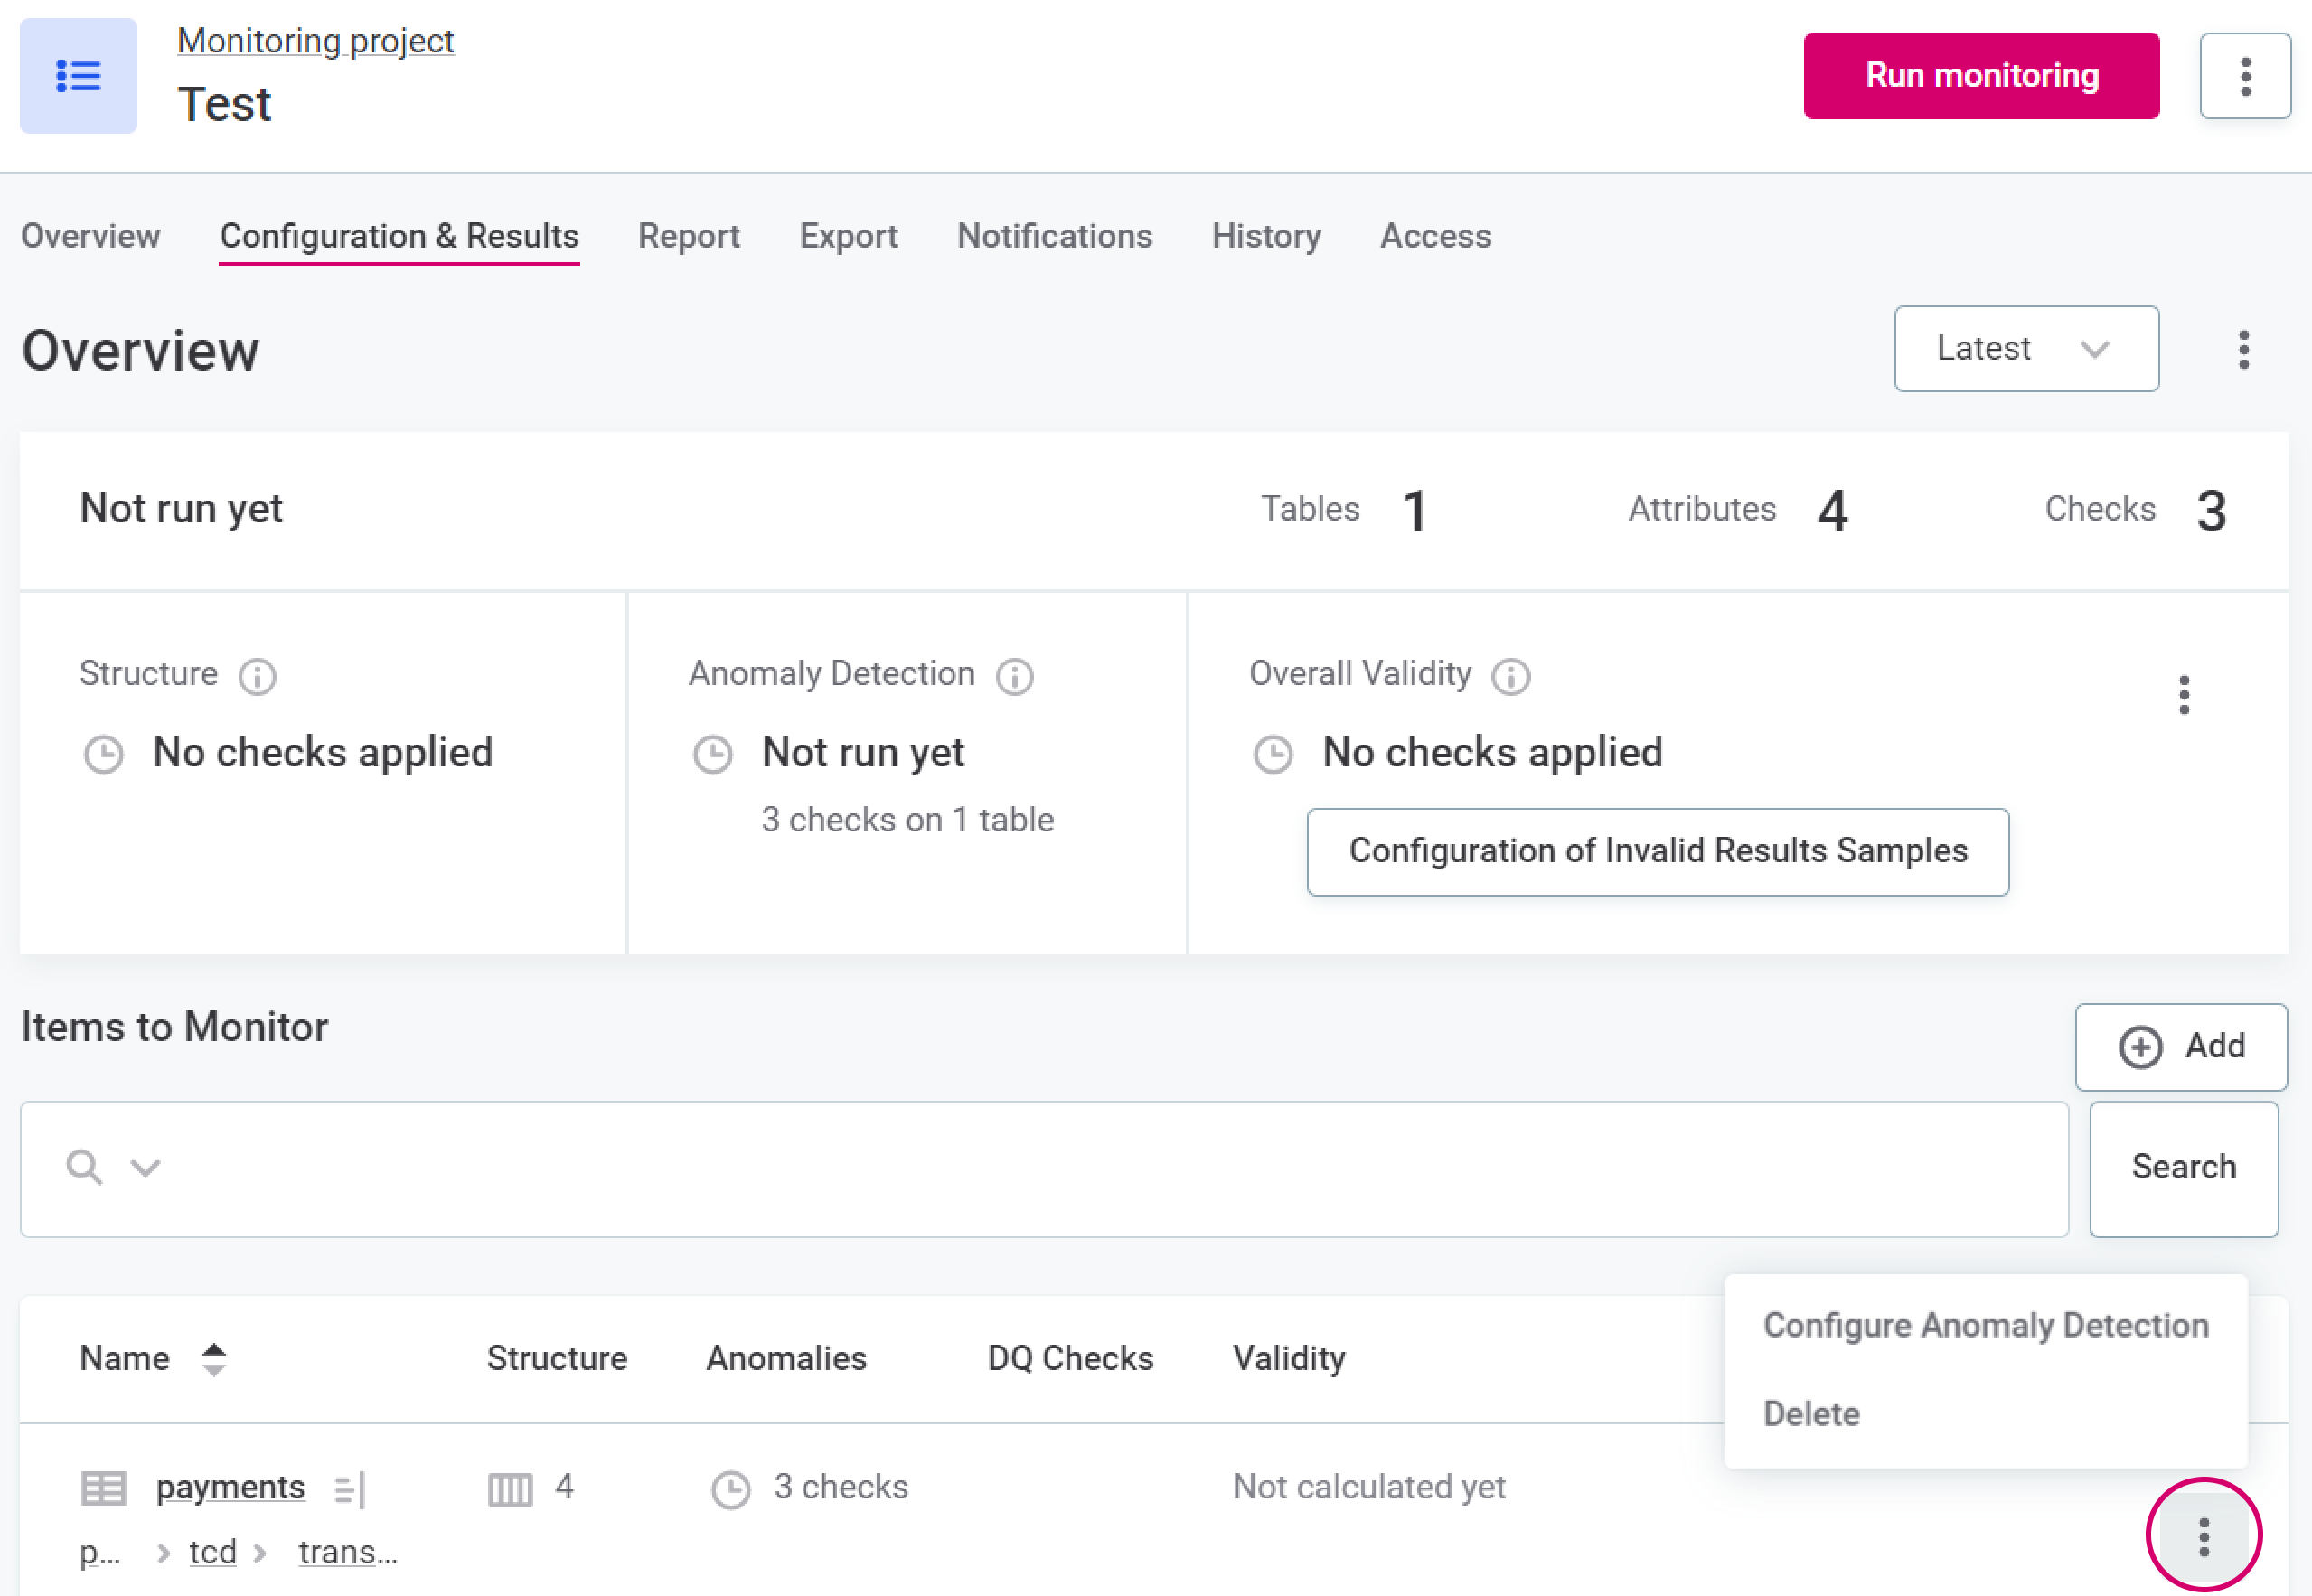
In the required monitoring project, select the Configuration & Results tab.
-
Select a catalog item by clicking the catalog item name.
-
Select Enable Detection.
-
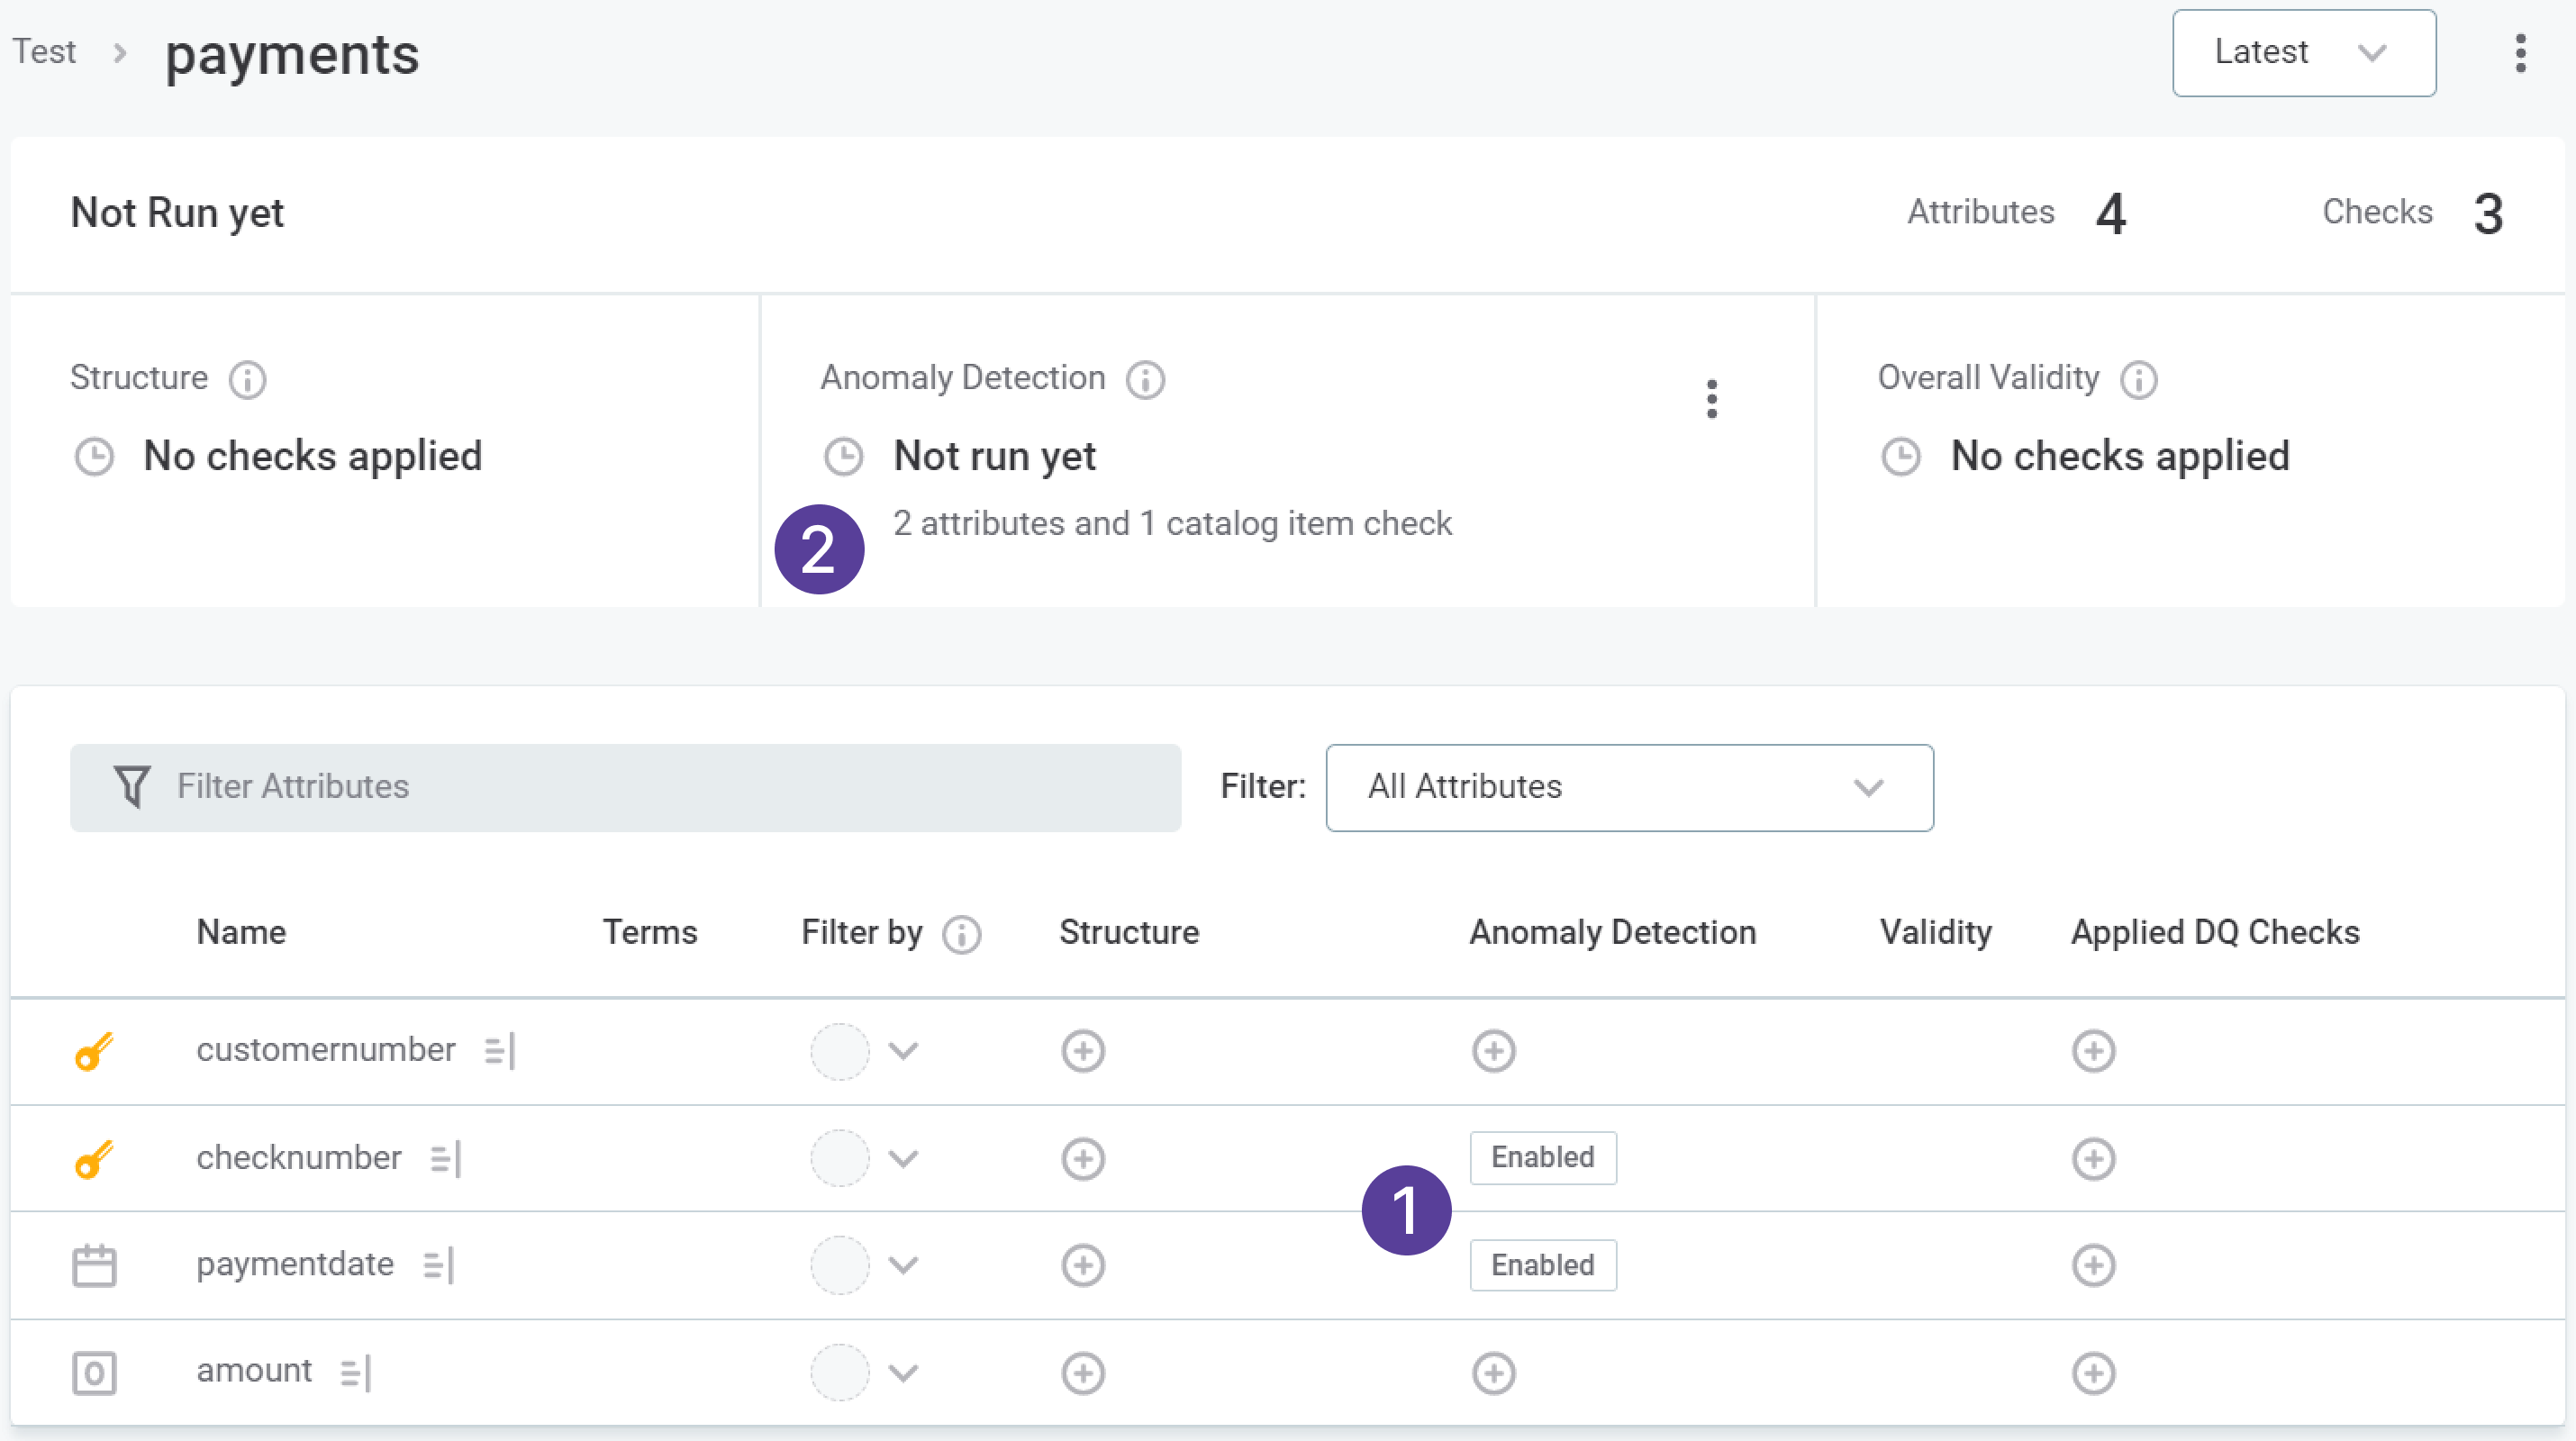
In the Anomaly Detection section, you can see how many anomaly detection checks are enabled in the catalog item or monitoring project.
-
-
Publish the changes to the project.
-
For attributes with anomaly detection enabled, anomaly detection is run in the course of the monitoring project.
Configure anomaly detection
Configuration of anomaly detection in monitoring projects allows you to define which anomaly detection model should be used, time-dependent or time-independent, as well as the required sensitivity of detection.
To configure anomaly detection:
-
Go to the monitoring project Configuration & Results tab and open the configuration in one of the two following ways:
-
Use the three dots menu on a given catalog item and select Configure Anomaly Detection.
-
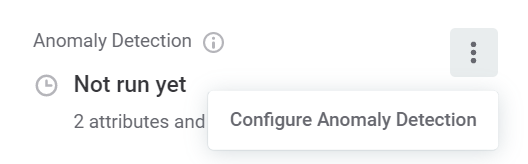
In the Anomaly Detection section within a catalog item, use the three dots menu and select Configure Anomaly Detection.
-
-
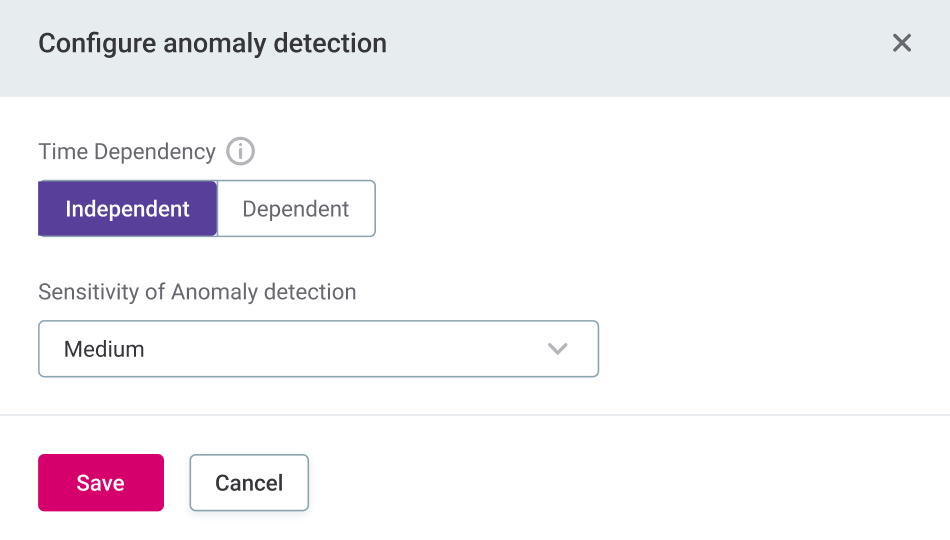
In Configure Anomaly Detection, define the time dependency (that is, whether the time-dependent or time-independent model should be used).
Time-independent anomaly detection detects anomalies in catalog items and attributes according to metrics such as number of records, minimum and maximum values, and duplicates. The full list can be found in Anomaly Detection: Behind the Scenes.
Time-dependent anomaly detection detects anomalies according to whether the metadata deviates from an established pattern or trend over time.
-
If you select Independent, proceed to step 3.
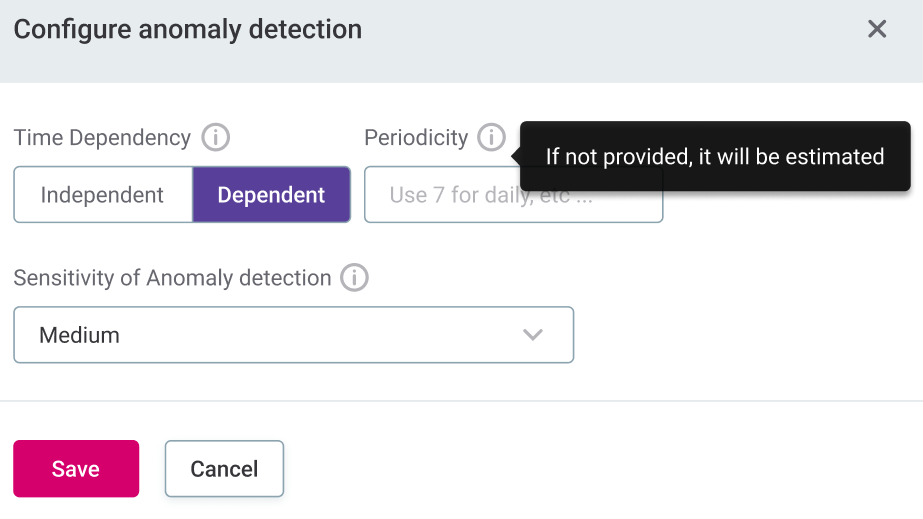
-
If you select Dependent, you have the option to specify periodicity. If no value is given for periodicity, the system derives it for you.
For more information about this setting, see Periodicity.
-
-
Select the required Sensitivity.
For more information about this setting, see Sensitivity.
-
Publish the changes to the project.
Periodicity
Periodicity describes how often a pattern is repeated in the data in regular, fixed intervals, for example:
-
7: The data pattern is repeated every seven profile versions and suggests that we are dealing with daily profiling.
-
12: The data pattern is repeated every 12 profile versions. This suggests that the data is profiled on a monthly basis.
-
24: There is a repeating pattern in the data every 24 data points or profiles. In other words, it indicates we have hourly data as the data is profiled every hour.
You can specify the periodicity yourself, or let the system derive it for you. However, in both cases the data history must be sufficiently long, or an error is returned:.
-
User provided periodicity: The time-dependent model requires the number of data points to be more than two times greater than the periodicity value as well as greater than five.
For example, if the periodicity is seven, there needs to be at least 15 profile versions. If the periodicity is set to two, you need at least six profile versions.
-
AI derived periodicity: The strict minimum is the same as that for user provided periodicity, however, that would only apply if the time series was completely clean (that is, no duplicated, irregular, or missing timestamps).
Generally, additional data points are required to account for any noise in the time series and allow the system to reliably derive periodicity.
| If you choose AI derived periodicity, the AI aims derives the periodicity by cleaning the timestamps and filtering out potential missing or duplicated timestamps. Whether the AI derives the correct periodicity can depend on how clean and regular the timestamps are, so we recommend providing the periodicity if it is known. |
Sensitivity
Select how sensitive you would like the anomaly detection to be. The options are: Very low, Low, Medium, High, and Very high.
High sensitivity means more points might be detected as anomalous but can result in false positives. Low sensitivity reduces the total number of anomalies detected but can result in false negatives.
Sensitivity in this context is measured as the number of standard deviations from the mean after which a point is considered as anomalous. The five options available correlate to the following values:
-
Very low: 4.5.
-
Low: 4.0.
-
Medium: 3.5.
-
High: 3.0.
-
Very high: 2.5.
This means, for example, that with the chosen sensitivity as Medium, anything which is further than 3 and half standard deviations from the mean is marked as anomalous.
Detected anomalies
|
It is important to note that anomalies displayed in monitoring projects are derived from all available data on catalog items included in the monitoring project. This means that if you have profiled the catalog item manually within the catalog, as part of data observability, or as part of a documentation flow, this information is reflected in the monitoring project results in addition to the information from the project runs. |
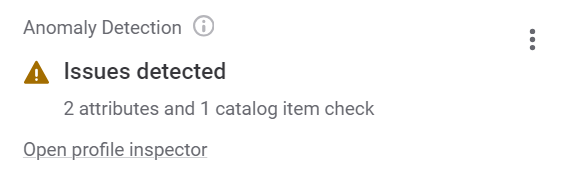
If anomalies are detected, you can view these in detail by selecting Open profile inspector. Alternatively, click the warning icon where anomalies are present.
Profile inspector
Once you have opened the profile inspector, you can select whether you would like to view only anomalous items and metrics, or all, by using the Display only anomalous items and Display only anomalous metrics, respectively.
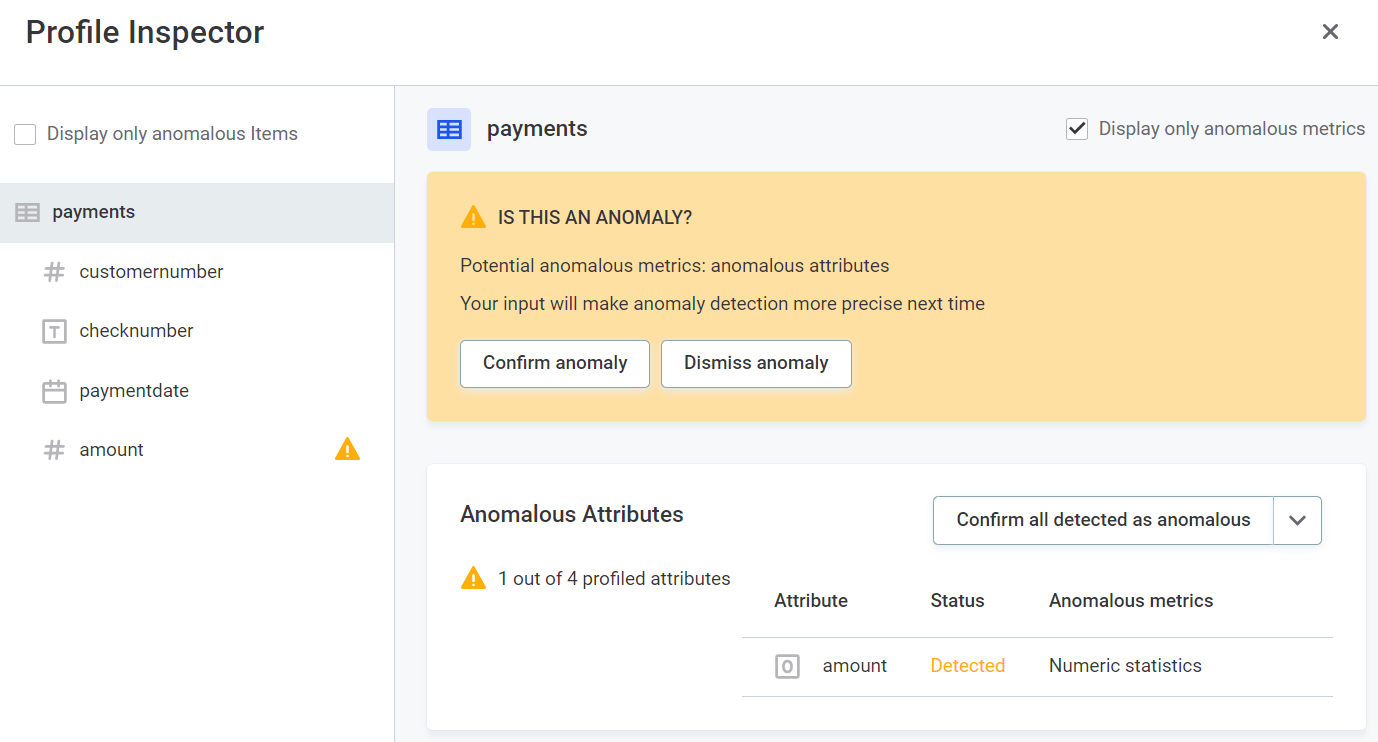
Before confirming or dismissing the anomaly, you can view the metrics in detail.
Catalog item metrics
-
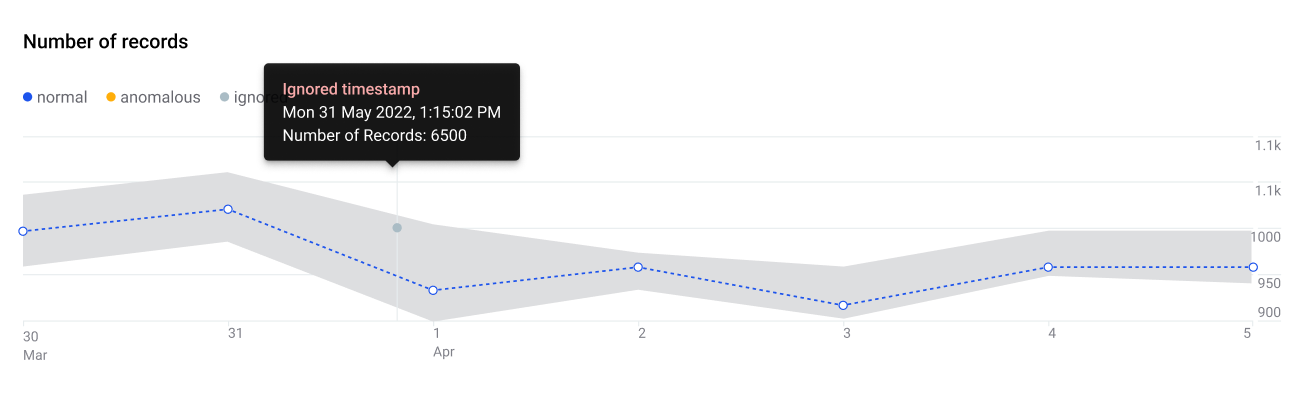
Number of records: the number of records in the catalog item is checked with every profiling.
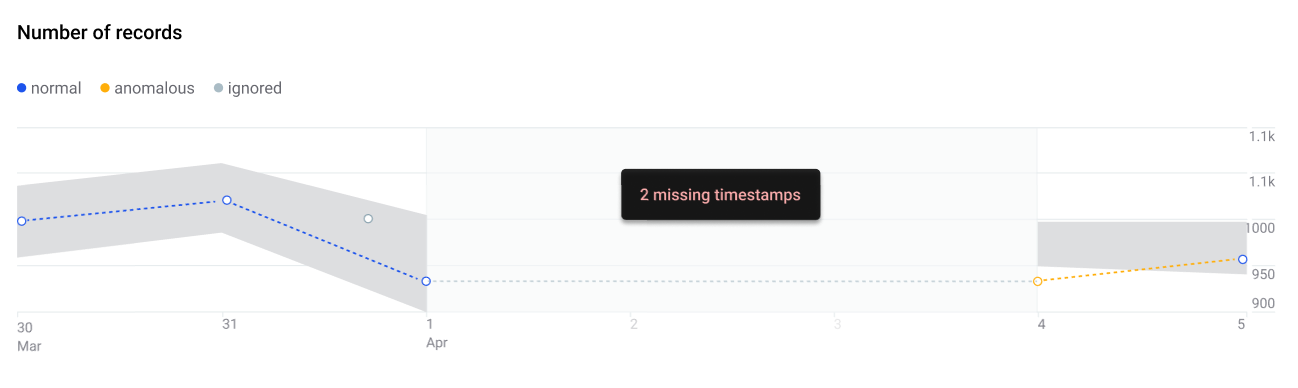
The gray background in the chart indicates the expected range of the values. Hover over the data points on the chart to see more details.
Attribute metrics
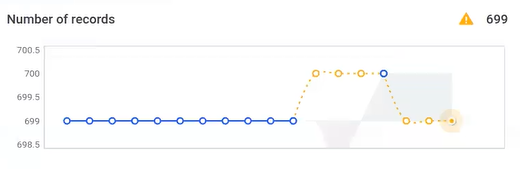
The anomalous results for a particular metric are shown over time with the highlighted outliers. Hover over the points on the chart to see more details such as values, profiling versions, and time.
-
Number of records
-
Mean
-
Minimum
-
Standard deviation
-
Numeric sum
-
Variance
-
Distinct count
-
Duplicate count
-
Non-unique count
-
Null count
-
Maximum
-
Unique count
-
Frequency, masks, and patterns
Ignored and missing timestamps
If time-dependent anomaly detection is being used, and no periodicity is specified, the system uses timestamps to derive periodicity.
-
Timestamps which are outside of the schedule are detected and are not used in the anomaly detection algorithm. This is shown in the application as Ignored timestamp.
-
Timestamps which are missing are detected and the values are imputed for the purpose of anomaly detection. This is shown in the application as Missing timestamp.
Confirm or dismiss anomalies
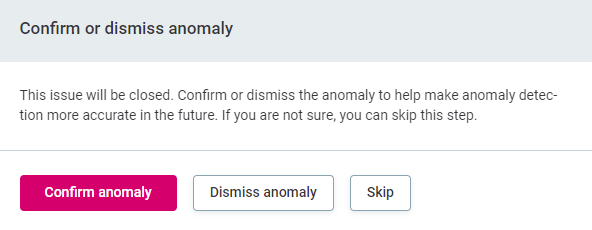
Once anomalies have been detected, you can either confirm them or dismiss them. The anomaly detection model is constantly improved based on this user feedback.
To do this:
-
Select the required catalog item or attribute in the Profile Inspector, and select Confirm anomaly or Dismiss Anomaly.
-
If an anomaly has been incorrectly confirmed or dismissed, select Review decision.
Confirm or dismiss all
In the Anomalous Attributes widget in Profile Inspector, use the dropdown to select either Confirm all detected as anomalous or Dismiss all detected. Anomalies are confirmed or dismissed accordingly.
| If an anomaly is dismissed on a particular attribute, this isn’t overridden if you subsequently select Confirm all detected as anomalous. |
Unconfirmed anomalies
If detected anomalies are not confirmed, the system does not know to exclude them from the expected range. After some time (depending on the length of profiling history), the unsolved anomalies are considered the 'new normal', and a return to the expected values can subsequently be identified as anomalous.
Was this page useful?