
Run DQ Evaluation
Identify issues in your dataset by running DQ evaluation and checking the quality of records according to the conditions you have set in your DQ evaluation rules. For example, ensure that all fields are filled, there are no duplicates, or a value has been entered in the correct format.
Prerequisites
It is necessary to run data discovery before running DQ evaluation in Ataccama ONE so glossary terms are mapped to catalog items and attributes. You also need to have DQ evaluation rules mapped to those terms. For more information, see Rule Types: DQ and Detection.
Alternatively, map DQ rules directly to attributes before running DQ evaluation. For more information, see Add DQ Rules to Attributes.
See the following guides for in-depth instructions, or head back to Data Quality Overview for a general overview of the data quality evaluation process.
Essential:
Related:
How is data quality calculated?
The data quality, represented by the Overall Quality metric found throughout the application, is calculated according to the number of values which pass the DQ rules applied to them.
| This calculation further depends on whether the DQ rules applied are of a DQ dimension type which is contributing to overall quality. |
You can also see data quality results for individual DQ dimensions by selecting the respective tab. For more information, see Data Quality Dimensions.
Evaluate data quality
Data quality evaluation occurs during a number of processes in Ataccama ONE:
Ad hoc DQ evaluation
You can run DQ evaluation on the catalog item, attribute, or term level on an ad hoc basis.
To do this:
Catalog items and attributes
-
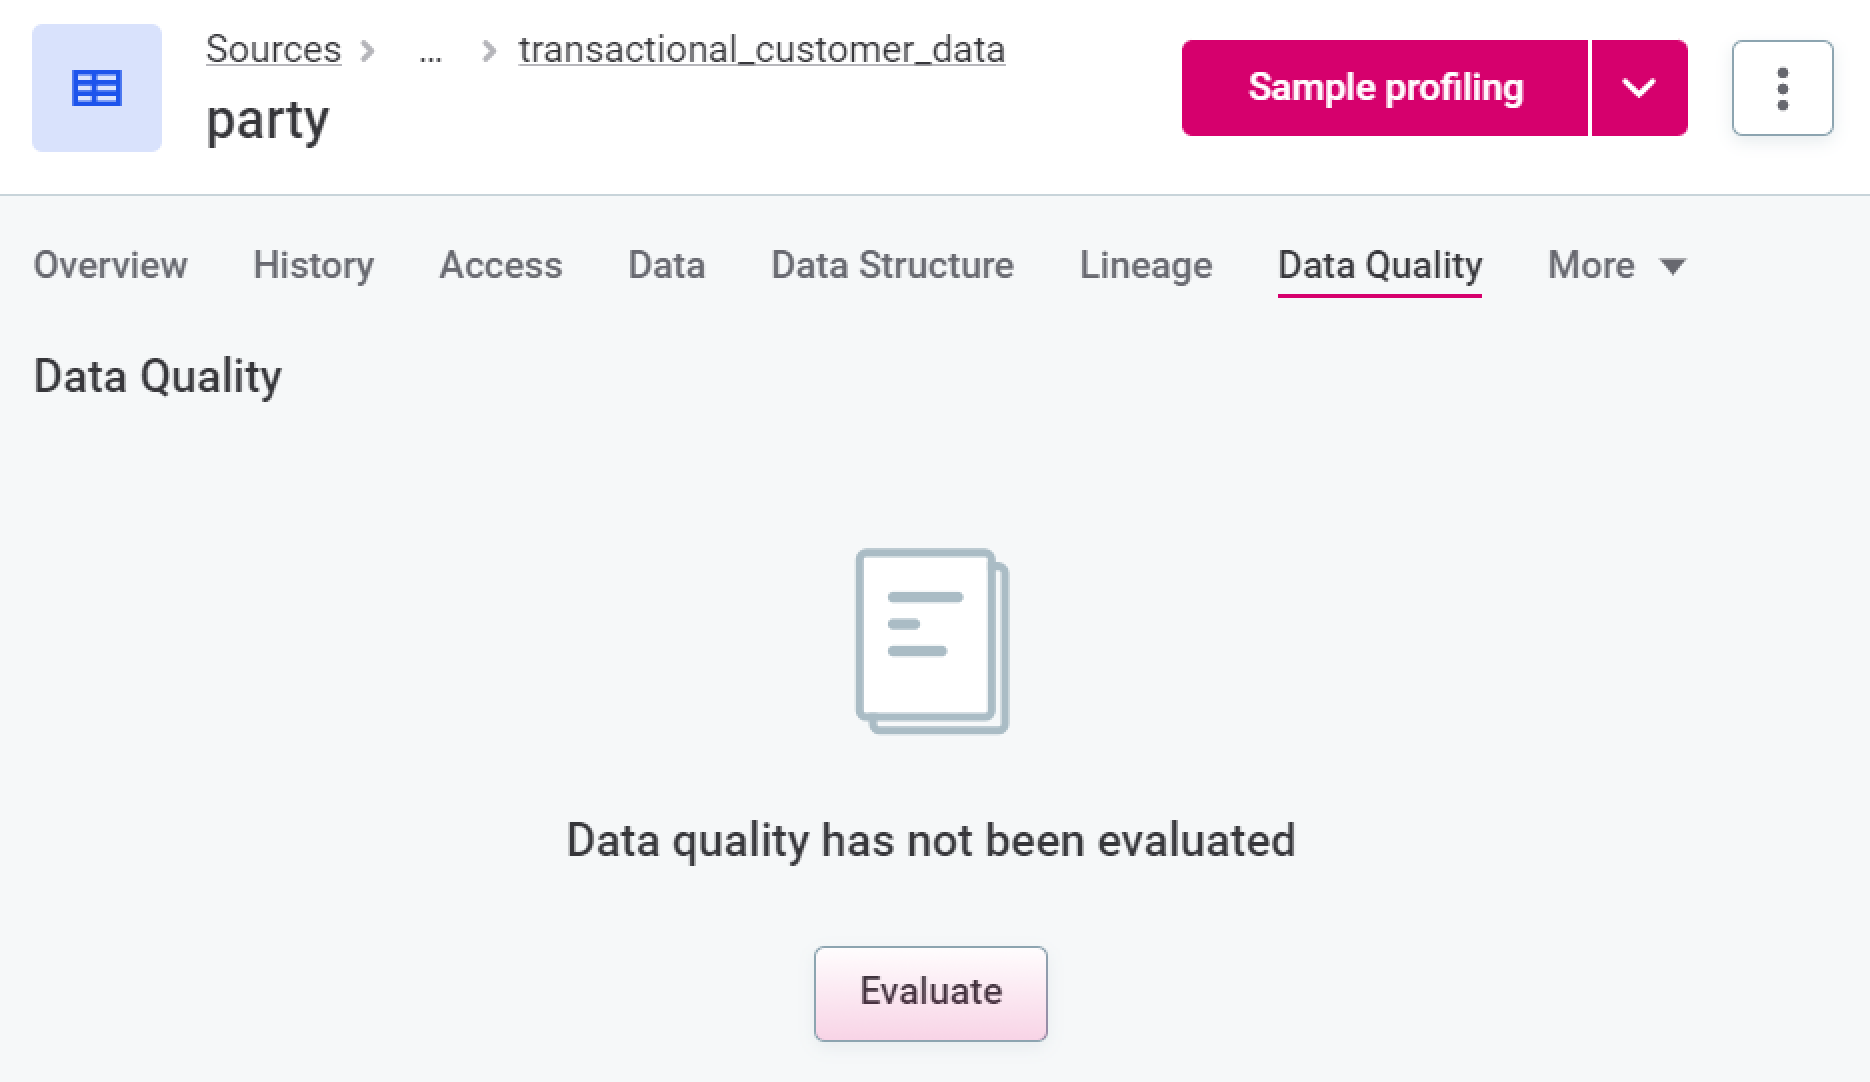
In Knowledge Catalog > Catalog Items, select the required catalog item or attribute, and from the Overview or Data Quality tab, select Evaluate.
Terms
-
In Business Glossary > Terms, select the required term, and from the Overview or Data Quality tab, select Evaluate.
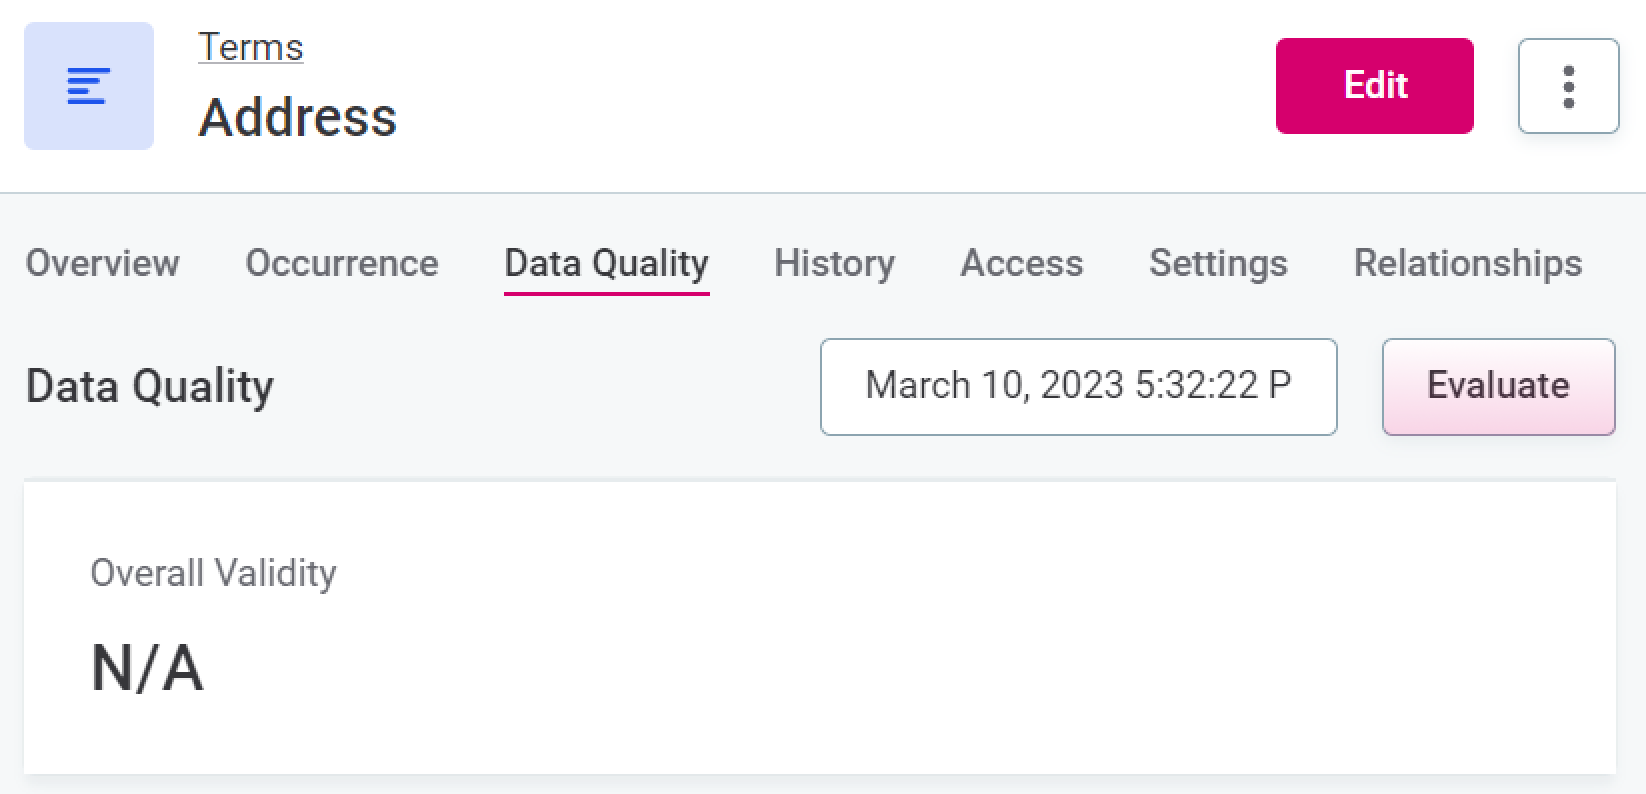
The data quality of a term is an aggregation of the data quality of the attributes to which the term is added.
Schedule DQ evaluation
You can schedule DQ evaluation at the catalog item level.
To do this:
-
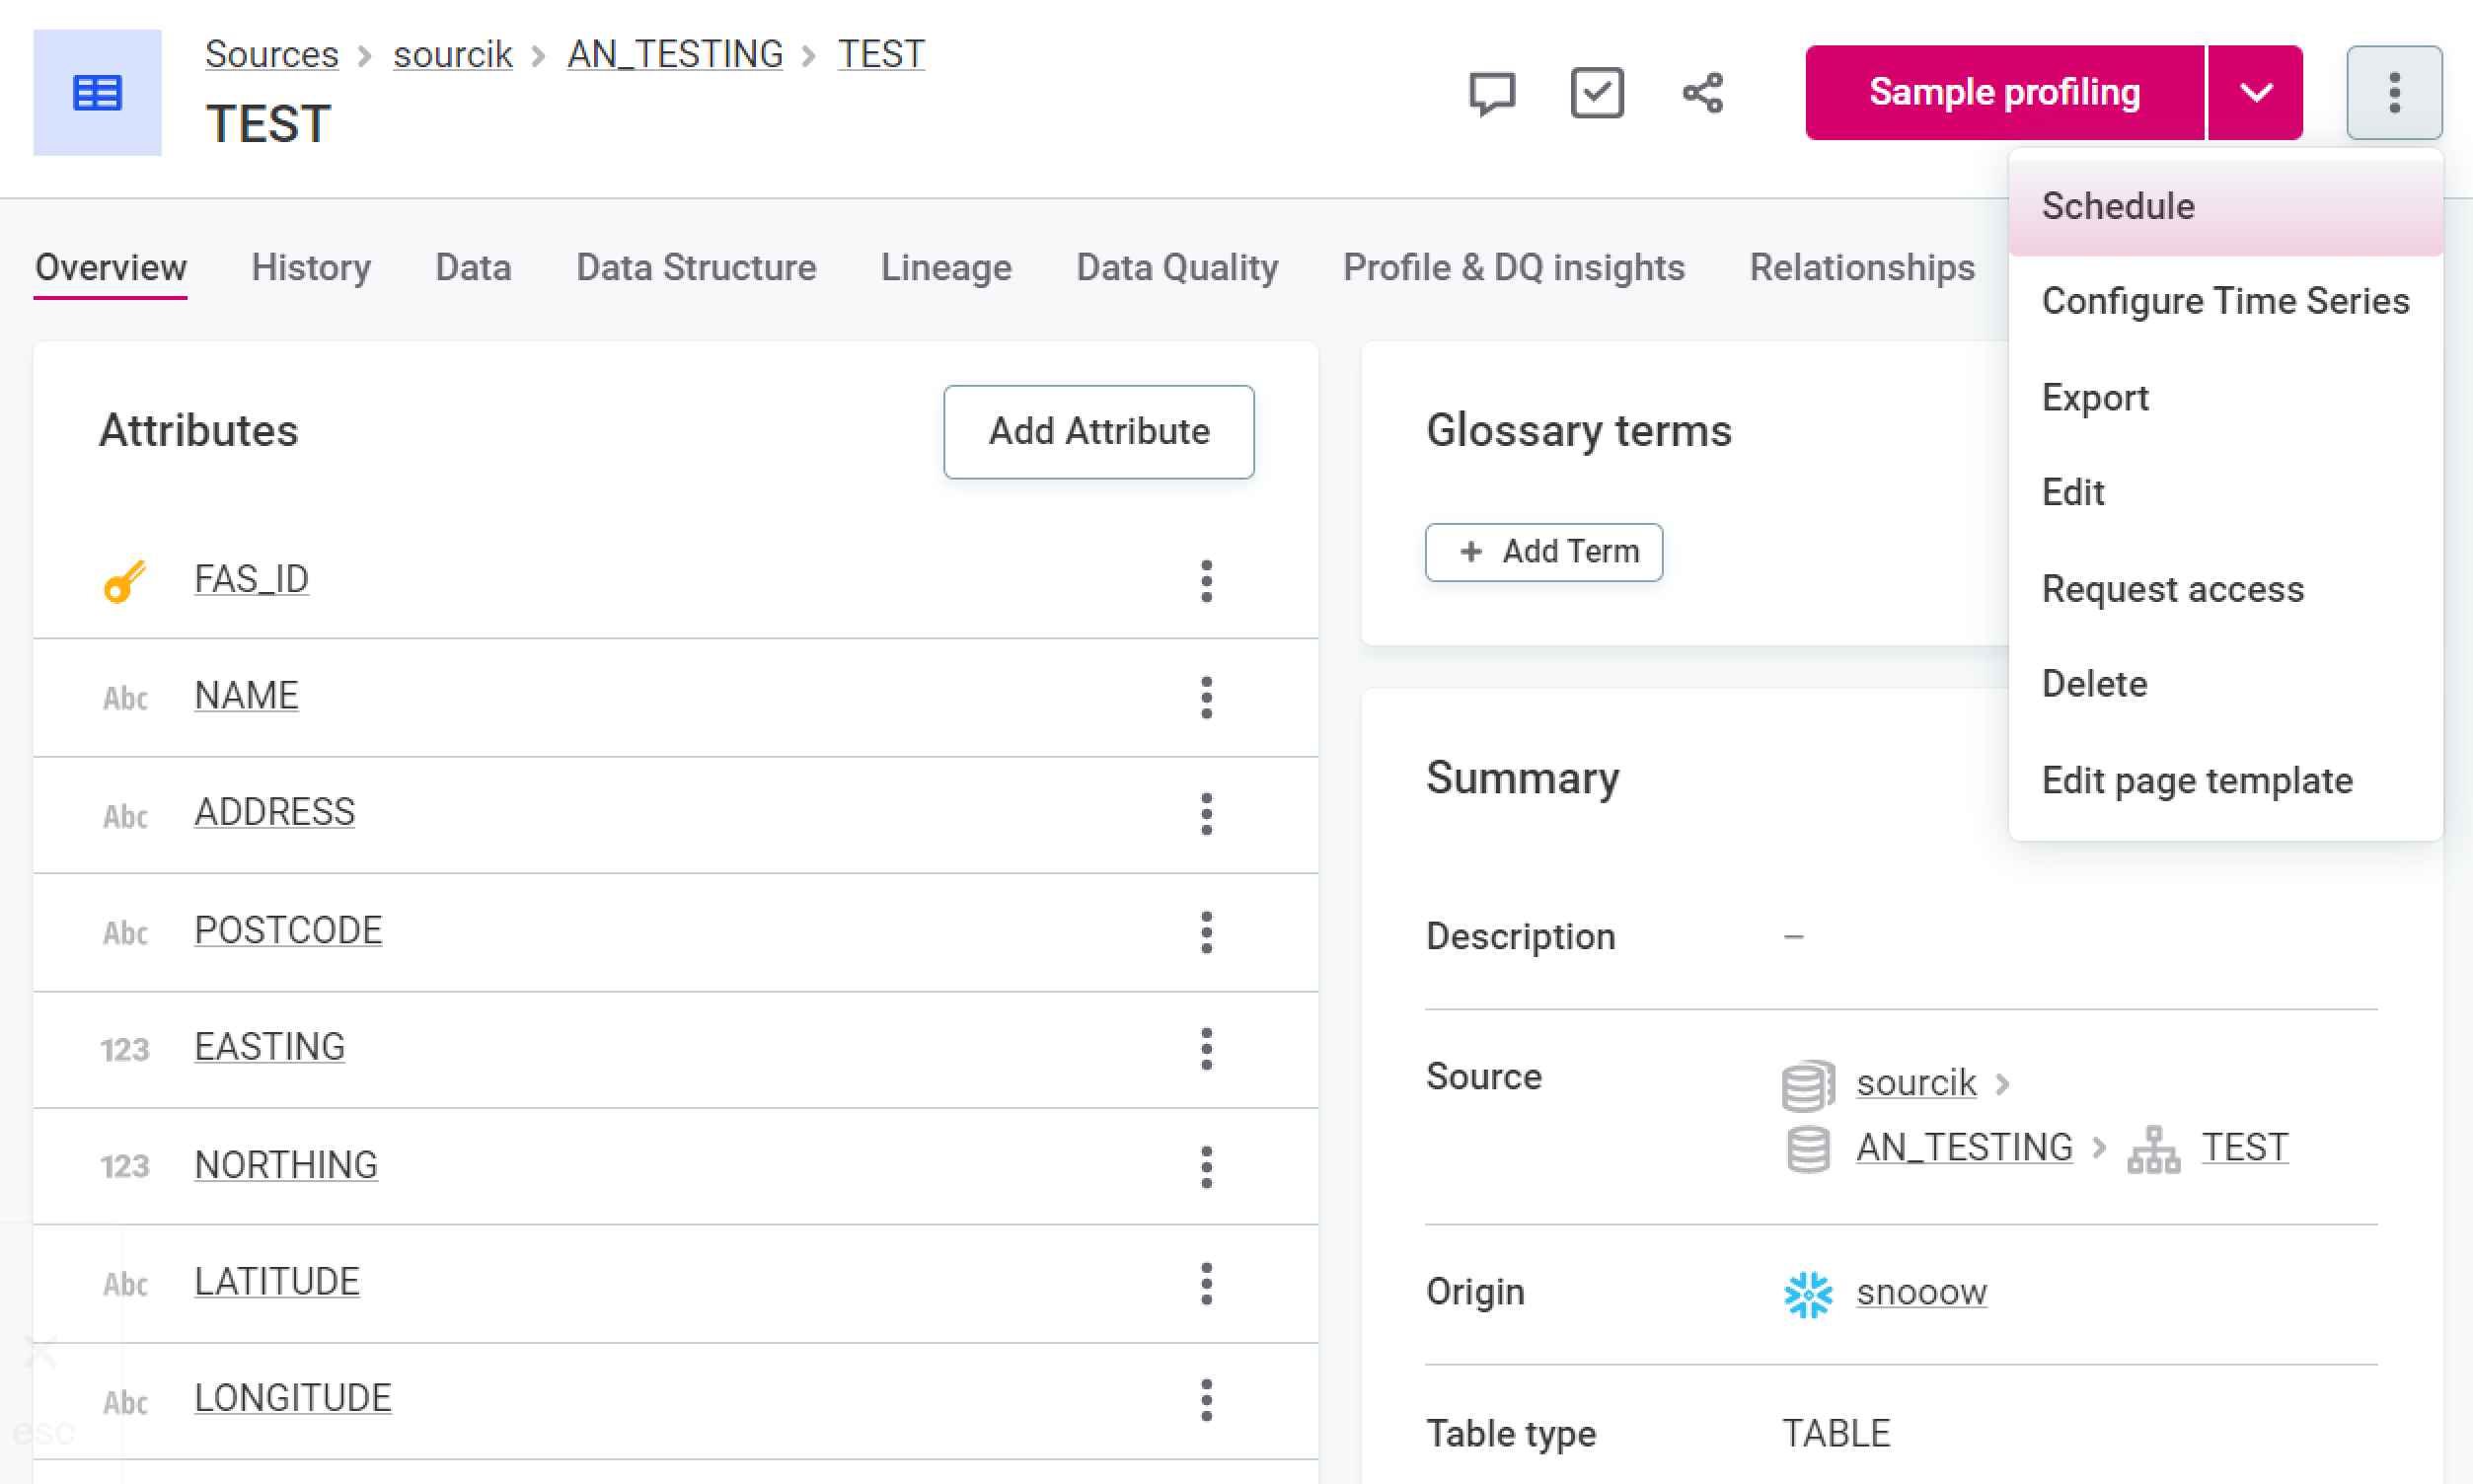
In Knowledge Catalog > Catalog Items, select the required catalog item, and in the three dots menu select Schedule.
-
Select Add Scheduled Event.
-
In Type, select DQ eval schedule.
-
Define the schedule using either Basic or Advanced configuration:
-
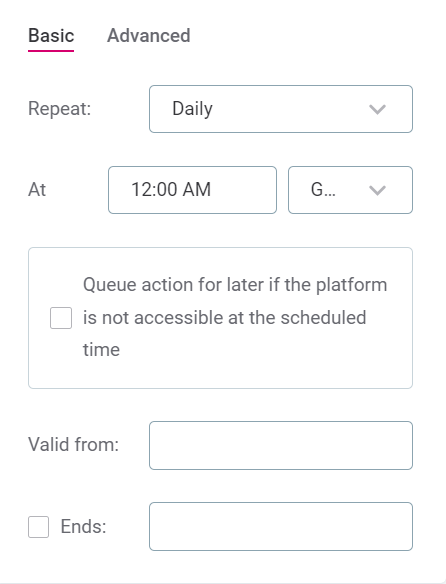
For Basic configuration:
-
In Repeat, select from the list of options how often DQ evaluation should run.
-
In At, specify the time (24-hour clock) at which the evaluation should be run, and select from the list of available time zones.
-
If required, select Queue action for later if the platform is not accessible at the scheduled time.
-
In Valid from, define the date from which the schedule should be followed.
-
If the schedule should have a finite end date, select Ends. In this case, you also need to define the date at which the schedule should no longer be effective.
-
-
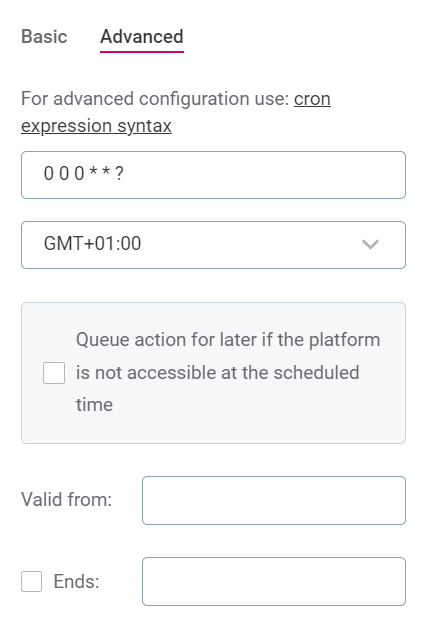
For Advanced configuration:
-
Set the schedule using Cron expression syntax. For more information, see the Cron Expression Generator and Explainer.
-
In Valid from, define the date from which the schedule should be followed.
-
If the schedule should have a finite end date, select Ends. In this case, you also need to define the date at which the schedule should no longer be effective.
-
-
-
Select Save and publish.
Run profiling and DQ evaluation
You can run profiling and DQ evaluation at the catalog item level.
To do this:
-
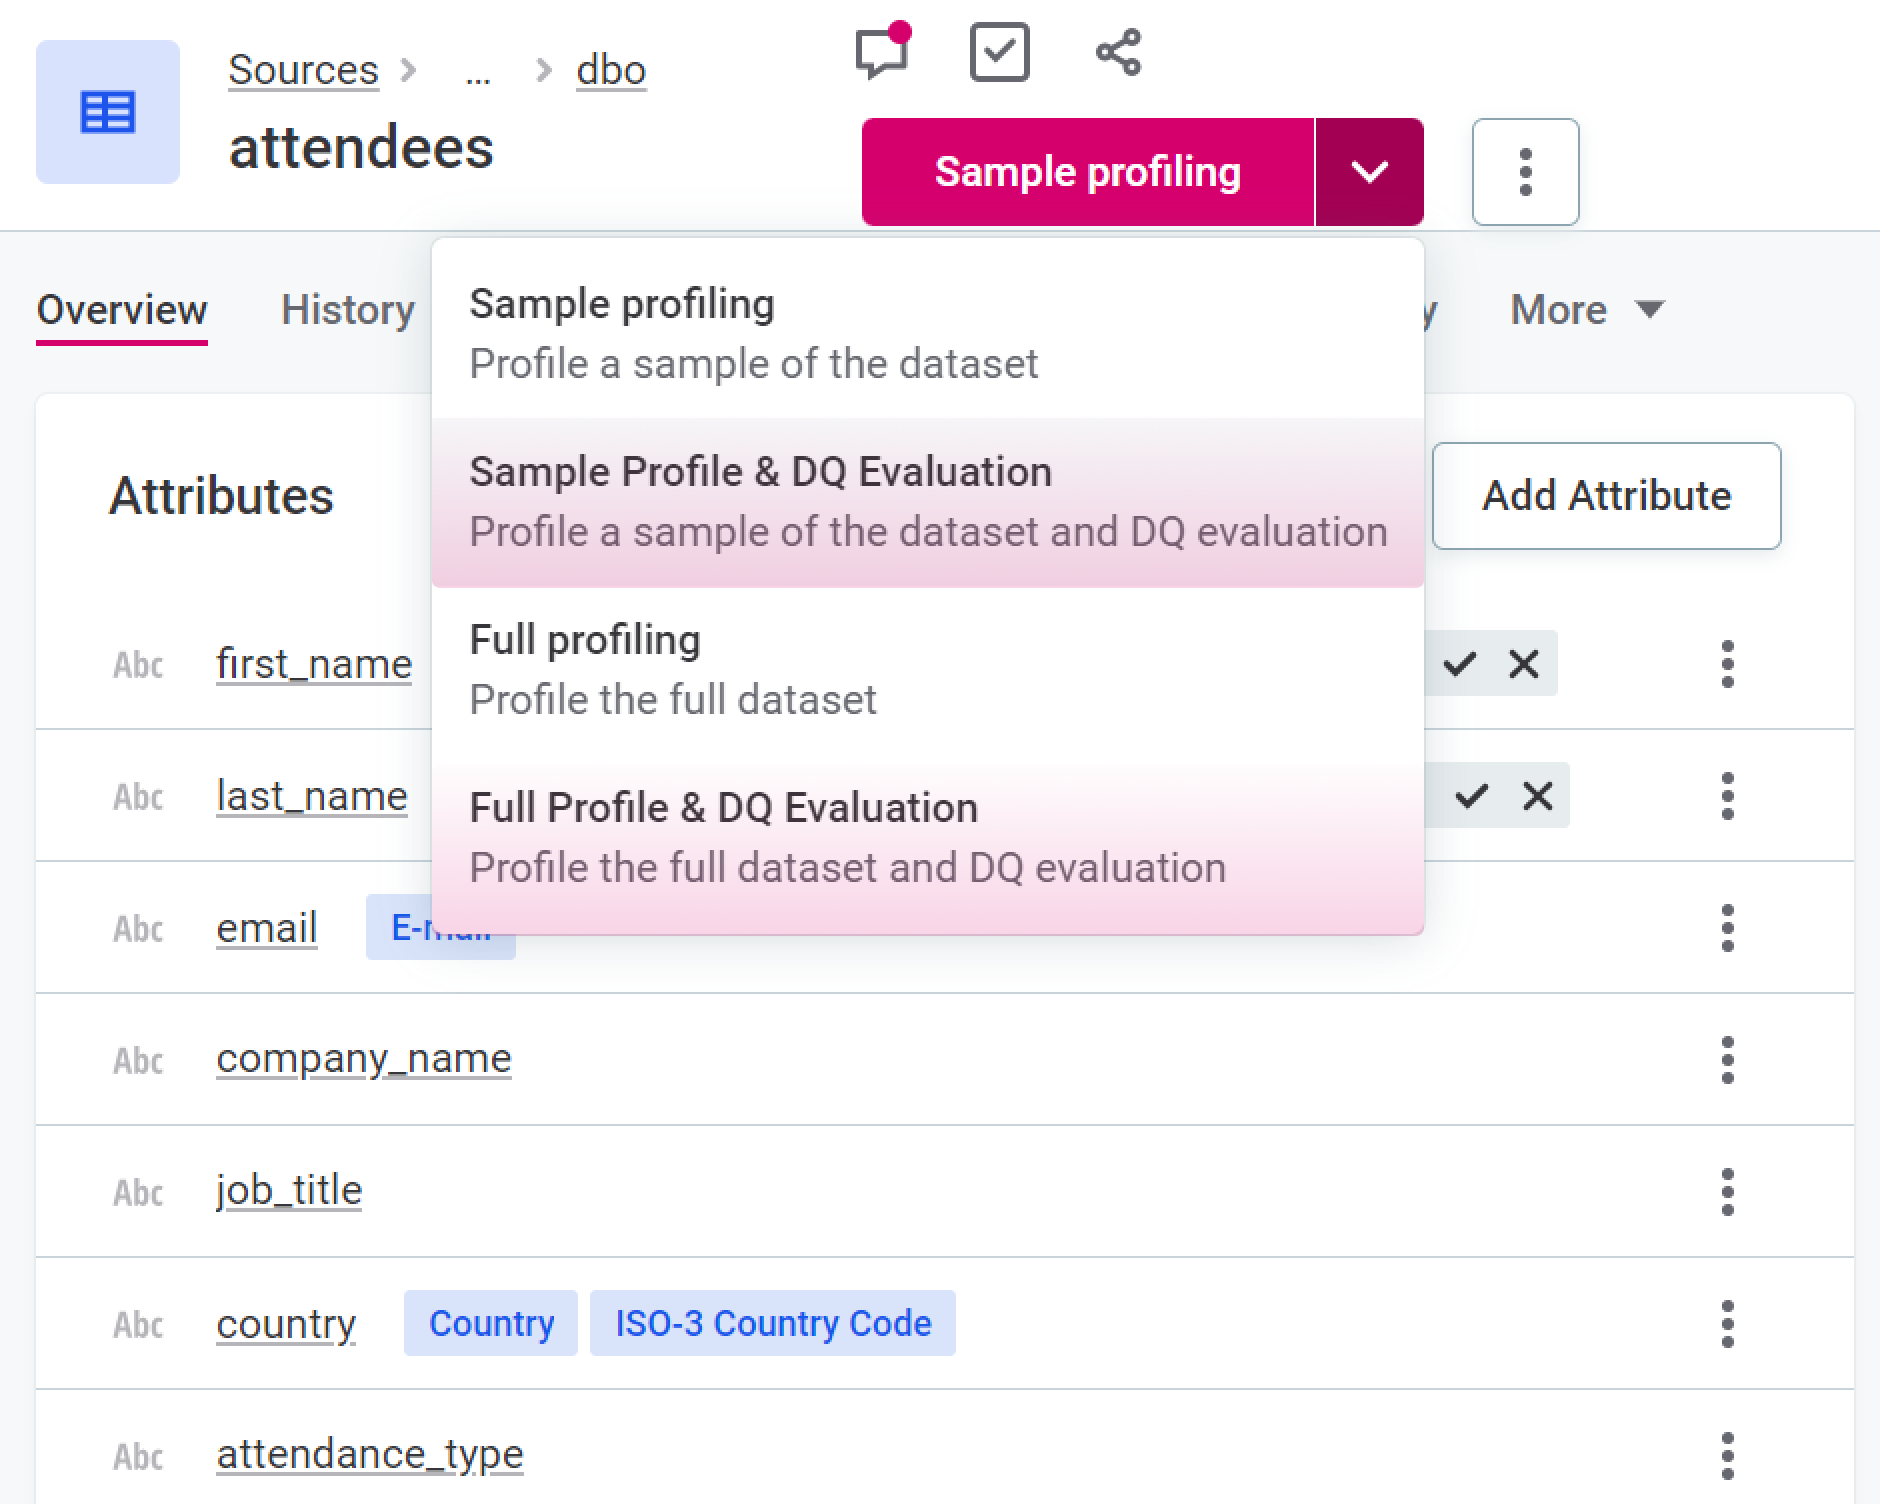
In Knowledge Catalog > Catalog Items, select the required catalog item, and using the dropdown next to Sample profiling, select either Sample Profile & DQ Evaluation or Full Profile & DQ Evaluation.
-
Sample profiling and DQ evaluation runs profiling and domain detection on a sample of rows of the selected item and runs DQ evaluation on the full catalog item. By default, samples are 1% of the data or at most 1,000,000 records.
The sample profiling configuration can be changed according to the instructions found in Configure Profiling.
-
Full Profile & DQ Evaluation runs profiling, domain detection, and DQ evaluation on all rows of the selected item.
-
| If custom profiling configurations have been added, in which DQ evaluation has been enabled, you can also select these. See Configure Profiling. |
Run DQ evaluation using the Document flow
If you want to run DQ evaluation on all catalog items in a selected source, you can use the Document documentation flow.
To do this:
-
In Knowledge Catalog > Sources, select the required source, and then Document.
| This process can reduce performance on the source. |
Run DQ evaluation using monitoring projects
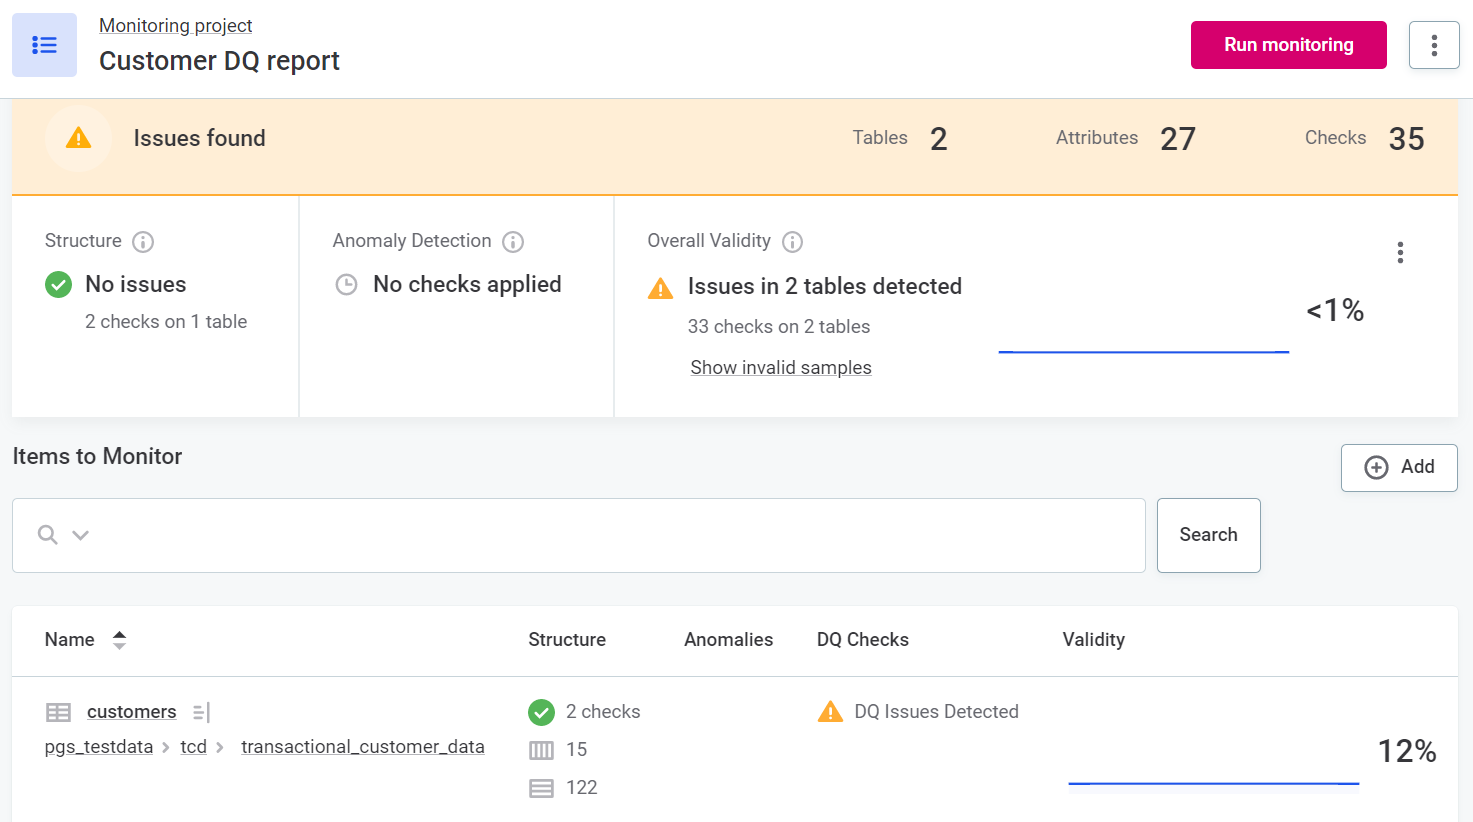
You can run regular DQ evaluation on a number of selected key items using monitoring projects.
Monitoring includes DQ evaluation, AI anomaly detection, and structure checks, and the outputs are in-depth DQ reports and invalid results samples. For more information about how to get started with monitoring projects, see Monitoring Projects.
Run DQ evaluation using data observability
Data observability allows observation of the entire source, with full monitoring and DQ evaluation on selected items, all with minimal configuration. For more information about how to leverage data observability, see Data Observability.
Interpret DQ results
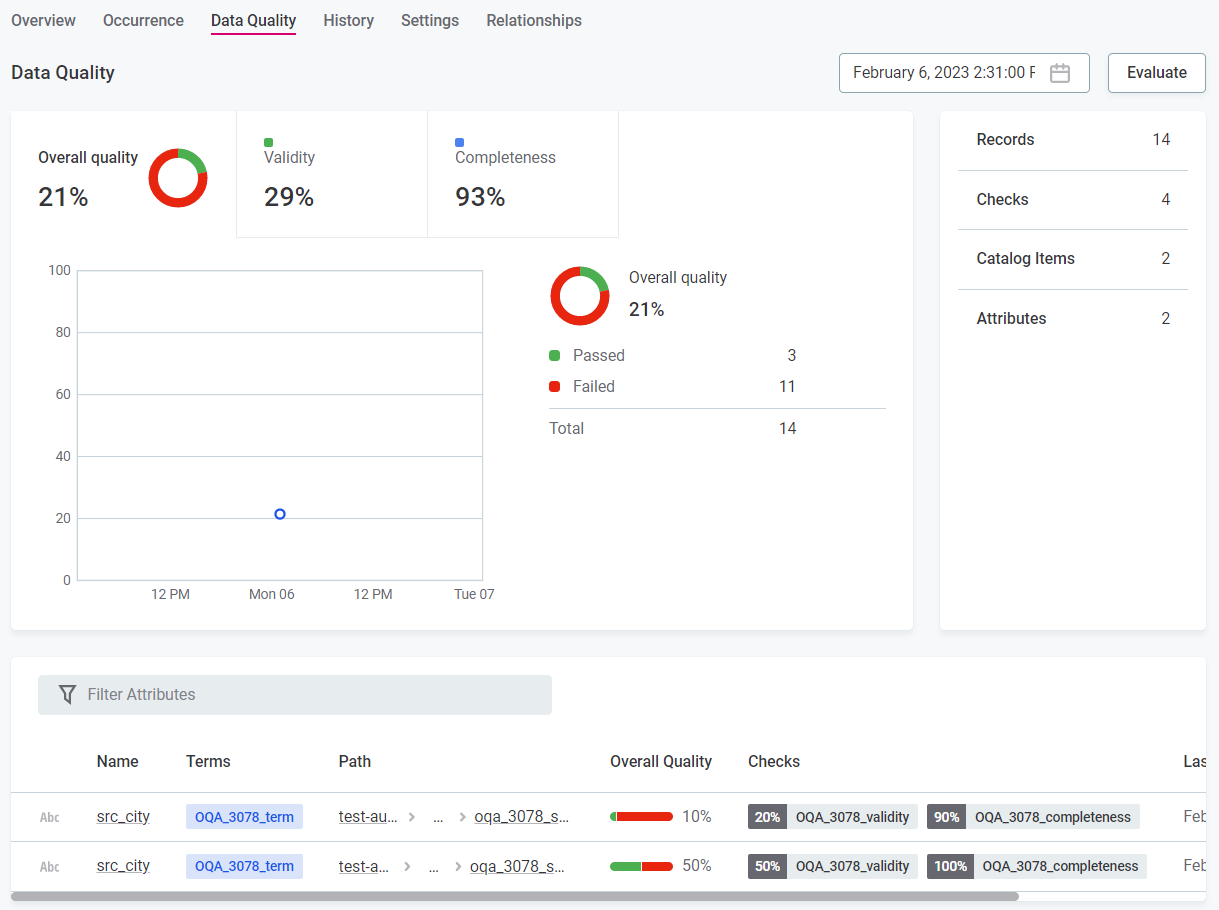
Where data quality has been evaluated using one of the methods above, a data quality metric is available, showing an aggregated value based on the level at which you view the results and the DQ rules applied to attributes.
-
When viewing catalog items, the overall quality reflects the quality of all evaluated attributes within the item.
-
When viewing attributes, the overall quality reflects results for that attribute only.
-
When viewing terms, the overall quality reflects results for all attributes containing that term.
| Only results of rules of DQ dimensions which currently contribute to overall quality are included in the calculation. For more information, see Data Quality Dimensions. |
In monitoring project results, you can view results for individual dimensions in addition to the overall quality.
Overall quality aggregation
The overall quality is not simply an average of the results for each dimension, as a record must pass all data quality rules applied to it.
If a single result fails, the record fails. This means that the overall quality is always less than or equal to the lowest result present in the contributing dimensions.
In this example, two rules are tied to dimension A: rule A1 and rule A2. There is one rule tied to dimension B: rule B1.
| Dimension | Dimension result | DQ result (pass or fail) |
|---|---|---|
Dimension A (for example, Validity) |
result 1 |
pass |
result 2 |
fail |
|
result 3 |
fail |
|
Dimension B (for example, Completeness) |
result X |
pass |
result Y |
fail |
The results of the four records are as follows:
| Rule A1 | Rule A2 | Dimension contribution | B1 | Dimension contribution | |
|---|---|---|---|---|---|
Record 1 |
result 1 |
result 1 |
pass |
result X |
pass |
Record 2 |
result 1 |
result 2 |
fail |
result Y |
fail |
Record 3 |
result 2 |
result 3 |
fail |
Result Y |
fail |
Record 4 |
result 2 |
result 2 |
fail |
result X |
pass |
Data quality aggregation
The data quality aggregation for these results is:
-
Dimension A (for example, Validity) — 25% pass, 75% fail.
-
Dimension B (for example, Completeness) — 50% pass, 50% fail.
If only these two dimensions are contributing to overall quality, the Overall Quality for these records is 25%. If only dimension A is contributing, the overall quality is 25%. If only dimension B is contributing, the overall quality is 50%.
Was this page useful?