
Create Custom Attributes
Custom attributes allow you to personalize metrics or dimensions and provides more flexibility to your visualizations. With an array of functions and expressions available, you can transform data to fit your specific needs and insights.
| Practice with different functions and expressions to find what works best for your data and your audience. For more information about the functions and operators available in Data Stories, see Supported functions and operators. |
| From 15.3.0, Data Stories leverages data protection classification that prevents unauthorized access to protected data, as signaled by visual indicators (lock icons) and notifications. For information about how this impacts attribute customization when working with a visualization, see Data Protection Classification in Data Stories. |
Steps
To create a custom attribute:
-
Open your visualization.
-
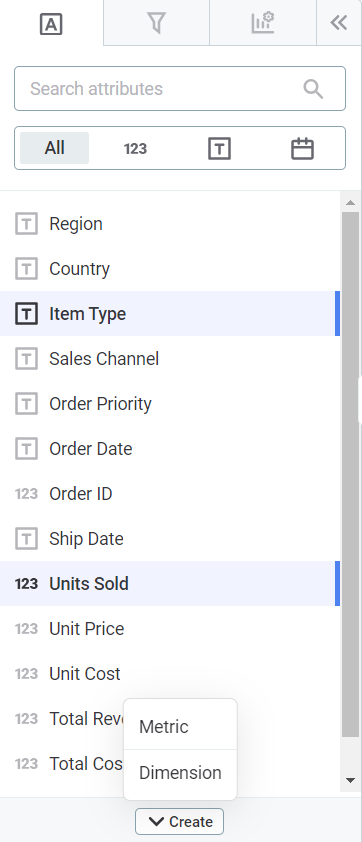
In Attributes, select Create > Dimension or Metric.
-
Enter a name and an expression using the supported functions and arithmetic operations with the columns in your dataset.
![]image::create-custom-attributes-expression-menu-dimension.png[](_images/create-custom-attributes-expression-menu-metric.png)
-
Select Create.
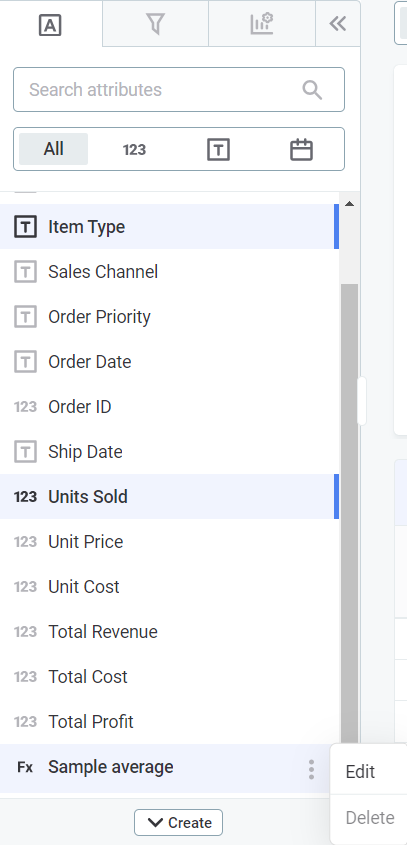
Your custom metric or dimension is now added to the attributes list with the symbol Fx.
-
-
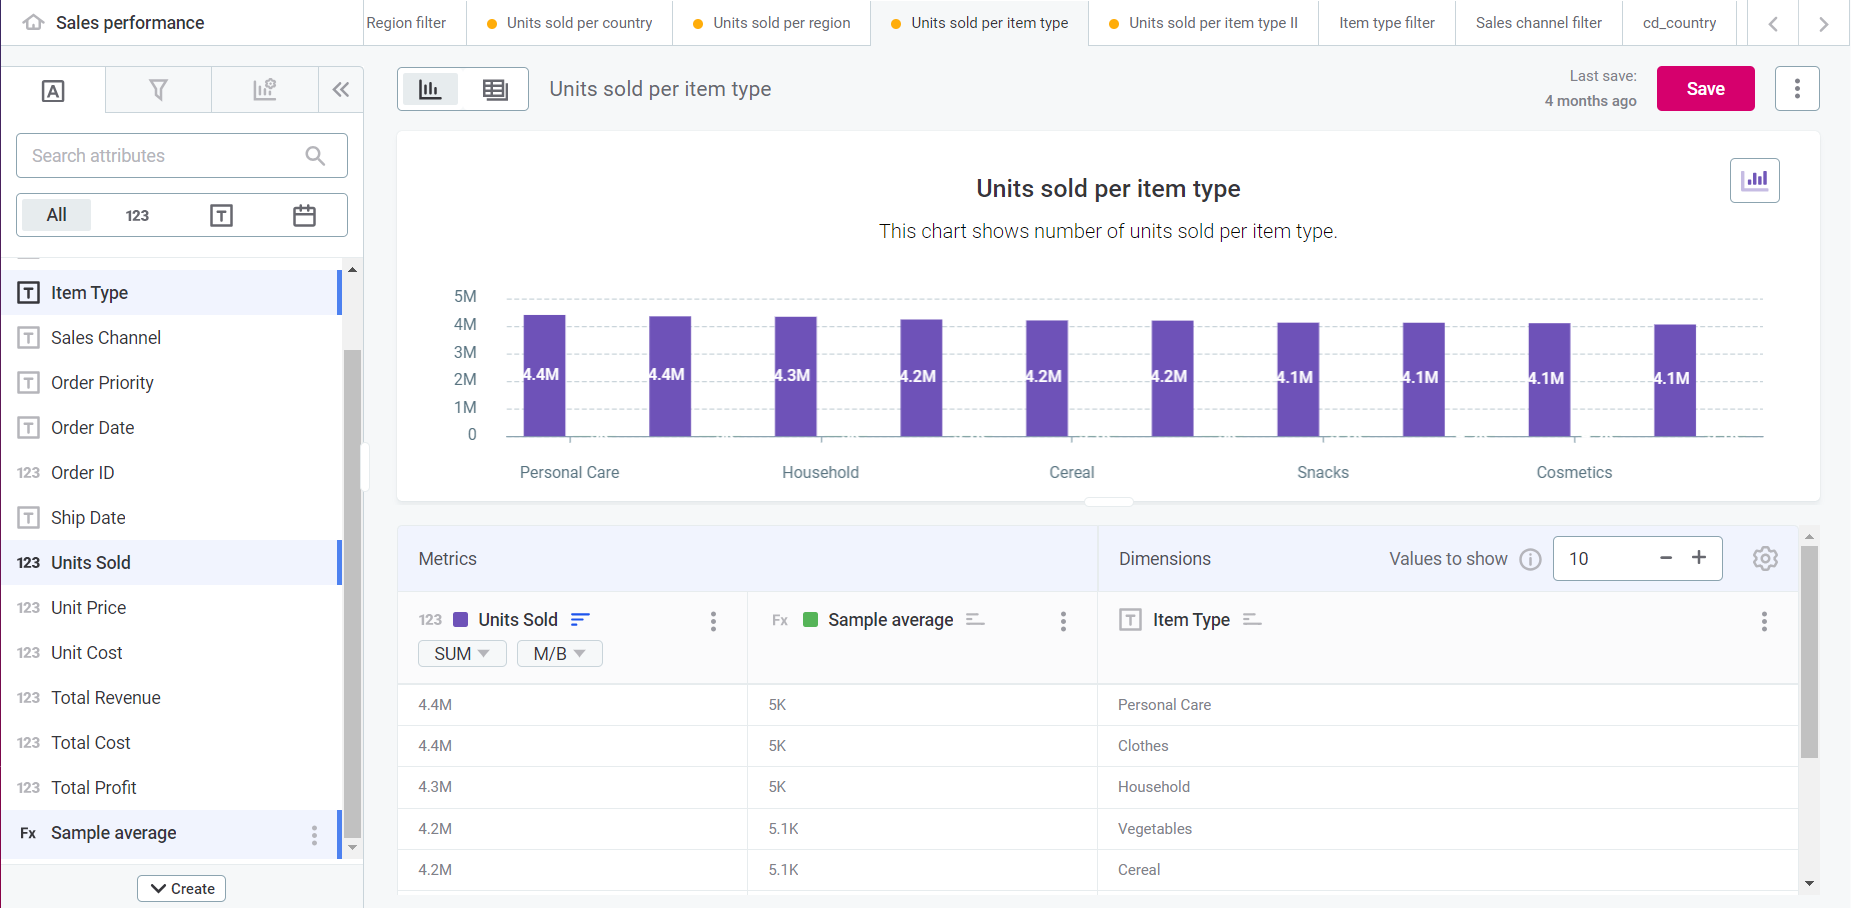
To view how it is displayed in the chart, drag and drop your custom attribute into the Metrics or Dimensions column (in Visualization view).
|
To create additional attributes, select Create > Dimension or Metric and repeat the previous steps. If you create a new visualization using the same dataset, the custom attribute (Fx) you just created appears listed in the attribute list for that new visualization. |
Expressions
Expressions fall into three categories:
-
Column expression: Returns a column shape, for example,
"column_name" + 3.Used for dimensions.
-
Scalar expression: Returns a single value (per group of rows), for example,
count("column_name").Used for metrics.
-
Literal expression: Returns a literal value, for example,
2+2. Literal expressions involve operators and are a way of including static or constant values in your calculations.Used both for dimensions and metrics.
Dimensions
Dimensions enable customization of column and literal expressions, which consolidate virtual columns through transformations of the original dataset columns.
Some examples are:
-
Rounding values to decimal places: Use the
round()function to round a specific column to the desired number of decimal places.round("ConfirmedPerc", 2) -
Positive values only: Use functions such as
iff()to keep only positive values and set others to0.iff("ConfirmedPerc" > 0, "ConfirmedPerc", 0) -
Replace specific values: For example, you can replace the different variations of the word
Chocolatewith a standard value in a product list.regexp_replace("ProductName", '[Cc]hoco.*', 'Chocolate', 'g') -
Complex calculations: Create more intricate transformations by extracting numerical portions of data and performing arithmetic operations.
int(concat(regexp_replace(regexp_replace("named_by", '.*\(', '\1'),'[^0-9]*', '\1'),'0')) / 1000 + 1
Metrics
Metrics allow for custom scalar and literal expressions, providing insights through aggregations and other calculations. Scalar expressions return a single value (per group of rows).
Some examples include:
-
Aggregation functions: Compute various metrics, like average, sum, maximum, and minimum.
avg("column_name") sum("column_name") max("column_name") min("column_name") -
Counting distinct values: Use
count_distinct()to return the number of unique non-NULL values in a column or expression. -
Running totals: The
c-sum()function allows you to see the cumulative sum over time or other series or progressions.c-sum("column_name") -
Standard deviation: Assesses the dispersion of a dataset.
stddev("column_name") -
Regression analysis: Functions like
regr_intercept()andregr_slope()enable linear regression analysis.regr_intercept("dependent_var", "independent_var") regr_slope("dependent_var", "independent_var")
| Always keep the complexity of your expressions in check to ensure optimal performance and readability. |
Supported functions and operators
| In Data Stories, functions for custom attributes are designed to work with several database engines, and as a result, they might not be an exact, 1:1 match with SQL or Snowflake functions. While this makes Data Stories more flexible and user-friendly, it also means you might encounter some differences from what you’re used to. |
Transformation functions
These functions always maintain the column input type. They can be used for Dimensions but not for Metrics.
| Transformation function | Description |
|---|---|
|
Computes the absolute value, removing any negative sign. |
|
Compares multiple values and returns the largest of the specified values (row-wise). |
|
Casts a value to the |
|
Acts as a ternary operator, allowing conditional logic similar to an SQL |
|
Compares multiple values and returns the smallest of the specified values (row-wise). |
|
Replaces substrings matching a regex pattern with another value, enabling advanced text manipulation. |
|
Rounds a float value to a specified number of decimal places. Useful for controlling numerical precision. |
Aggregation functions
These functions always create a scalar, no matter the input. They can be used for Metrics but not for Dimensions.
| Aggregation function | Description | ||
|---|---|---|---|
|
Calculates the average of the set of values included in a column or expression stated, by dividing their sum by the count of non-NULL values. For this function to work as expected, the input values should be of integer type. The result is always an integer number rounded down. |
||
|
Returns the number of cells that contain numbers or non-NULL expression values in a column or expression. You can use it to get the number of entries in a number field that is in a range or array of numbers. |
||
|
Returns the number of unique (distinct) non-NULL values in a column or expression stated. |
||
|
Displays the total sum of data as it grows over time (or any other series or progression). In other words, the function allows you to view the total accumulation of a given measure with the passing of time.
|
||
|
Returns the largest value (of non-NULL values) in the column or expression stated. |
||
|
Returns the smallest value (of non-NULL values) in the column or expression stated. |
||
|
Computes the intercept of the linear regression line, indicating the value of the dependent variable when all independent variables are |
||
|
Calculates the slope of the linear regression line, representing the rate of change in the dependent variable for each unit change in the independent variable. |
||
|
Returns the standard deviation of non-NULL records in the column or expression stated. |
||
|
Returns the sum of non-NULL values in the column or expression stated. For Boolean arguments, this function can perform the logical sum (OR), for example: |
Supported binary operators
These operators allow you to include constant values in your custom attributes. They can be used in both Dimensions and Metrics.
|
In the following table, The syntax you should use is as follows:
|
| Operator | Usage | Description |
|---|---|---|
|
|
Subtraction of column values |
|
|
Division of column values |
|
|
Multiplication of column values |
|
|
Addition of column values |
|
|
Comparison of column values.
Checks if |
|
|
Comparison of column values.
Checks if |
|
|
Comparison of column values.
Checks if |
|
|
Comparison of column values.
Checks if |
| For more details about specific functions, check the official Snowflake documentation. |
Was this page useful?