
Data Quality Dimensions
Data quality dimensions, also known as DQ dimensions, are different logic types for data quality rules. When creating a data quality (DQ) rule, you must select to which dimension the rule should belong.
Once configured, DQ dimensions and their results can be used in data quality evaluation rules (see Rule Types: DQ and Detection).
To access DQ Dimensions, select Data Quality in the navigation menu, and then under Rules select DQ Dimensions > DQ Dimensions Settings.
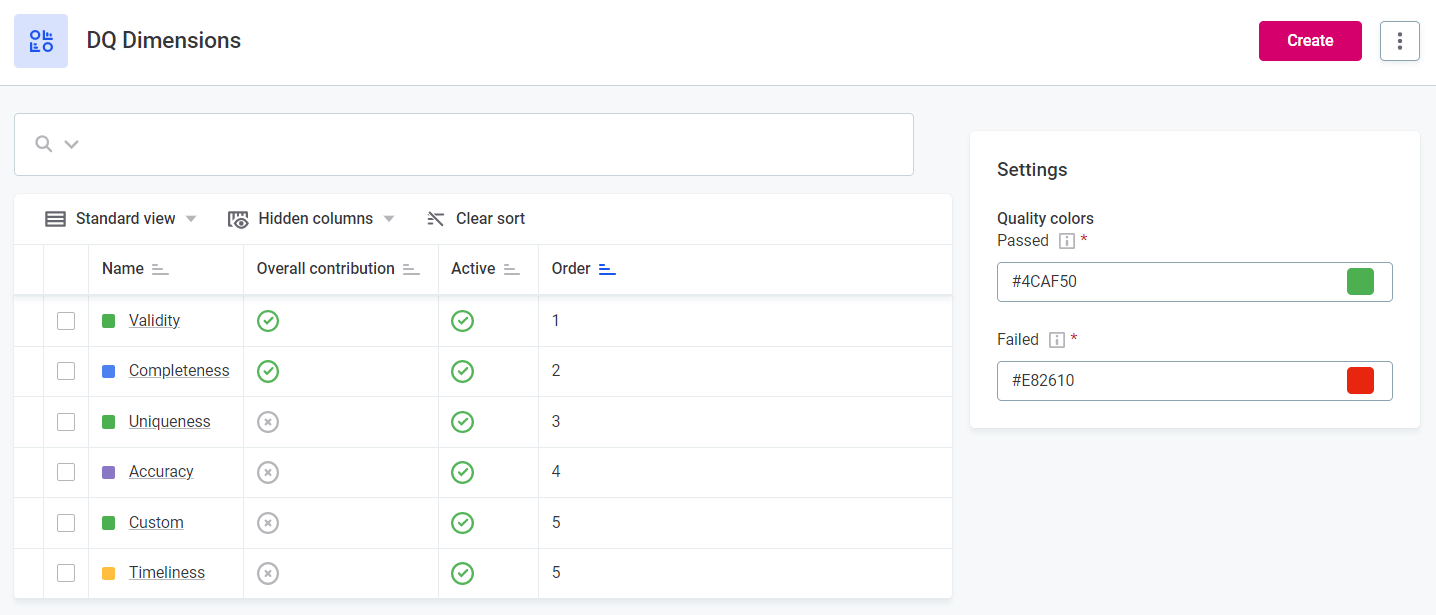
In the list view of configured DQ dimensions you can see:
-
Name: The name of the DQ dimension.
-
Overall contribution: Indicates whether results from this dimension are contributing to Overall Quality or not.
-
Active: Indicates whether this dimension can be selected or not during rule creation.
-
Order: The order in which the dimensions are checked during DQ evaluation.
To edit these and other settings, or for instructions on creating new dimensions, head to Configure dimensions.
DQ dimensions and overall quality
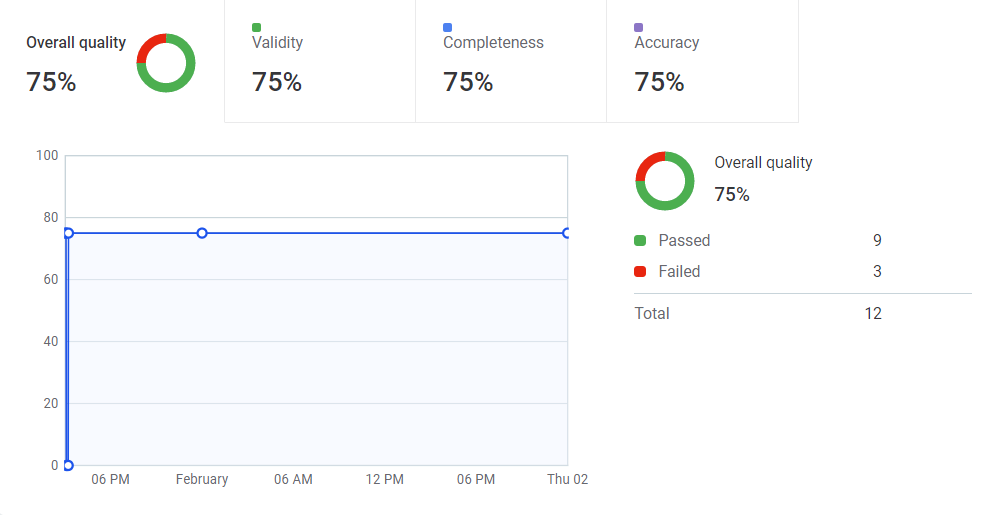
Data quality dimension configuration directly impacts the Overall Quality metric found in DQ results, as it is necessary to define which dimensions contribute to this metric. Equally, to get the best understanding of your results, it is important to be aware of which dimensions are considered here.
Overall Quality is visible after DQ evaluation on catalog items, attributes, terms, in the Data Observability feature, and in monitoring projects. You can also see results only for selected dimensions.
Within monitoring projects and data observability it is also possible to override the global settings by defining contributing dimensions for that specific project or source.
How a dimension contributes to overall quality
If a dimension is contributing to Overall Quality, it means that results from rules with this dimension type count towards the overall quality percentage that can be seen in DQ results. If a dimension is not contributing to Overall Quality, it means that results from rules with this dimension type do not count towards the overall quality percentage.
This is defined in the settings for each dimension. Use the checkbox to enable overall quality contribution.
You can see which dimensions are currently contributing to the overall quality metric by selecting Data Quality > Rules > DQ Dimensions > DQ Dimensions Settings.
At least one dimension must contribute to overall quality at any given time. Otherwise, it is not possible to calculate Overall Quality.
How dimension results impact overall quality
Each result added for a dimension type can impact the overall quality in one of three ways: positively, negatively, or not at all. This depends on the Effect on overall quality setting for the result:
-
Pass: Select for results where the record satisfies the rule (for example, Valid). The result increases data quality.
-
Fail: Select for results where the record breaks the rule (for example, Invalid). The result reduces data quality.
-
Not applicable: Select for records where the rule cannot be meaningfully applied (for example, N/A). The result is excluded from the overall quality percentage.
You name each result yourself to represent Pass, Fail, and Not applicable outcomes for the given dimension, for example, Valid, Invalid, and N/A for the Validity dimension.
How overall quality is calculated
Overall Quality is calculated from the results of individual records. It is not an average of the dimension results: because a record must pass every rule applied to it, a single failing rule fails the whole record, and Overall Quality can never be higher than the lowest-scoring contributing dimension.
The result for each record is calculated in two stages. First, each rule instance (a rule applied to a value) produces a result, then those results are combined into a single result for the record (row):
-
Rule instance: A rule evaluates as Pass, Fail, or Not applicable, based on the result assigned to the relevant rule condition.
-
Record: The record result is derived from all rule instances applied to it:
-
Any rule fails: The record is Failed.
-
All rules are Not applicable: The record is Not applicable and excluded from overall quality.
-
Otherwise (at least one Pass and no Fail): The record is Passed.
-
Overall Quality is then the percentage of passed records, out of all records that passed or failed:
                                 Passed records
Overall Quality (%) = ───────────────────────────────────── × 100
                         Passed records + Failed records
Only Passed and Failed records count toward the data quality percentage. Not applicable records are excluded from the calculation.
Example: Record data quality calculation
In this example, two rules are applied to each record. The record result is evaluated as follows:
| Rule A result | Rule B result | Record result |
|---|---|---|
Pass |
Fail |
Failed |
Pass |
Not applicable |
Passed |
Not applicable |
Not applicable |
Not applicable (excluded from overall quality) |
A single Fail fails the record regardless of the other results. A Not applicable result never fails a record: it is ignored unless every rule on the record is Not applicable, in which case the whole record is excluded.
For an example of how record results aggregate to an Overall Quality percentage across several records and dimensions, see Example: How dimensions combine into overall quality.
Not applicable results
Use the Not applicable result for rules that apply to only part of the data and produce a high number of not-applicable records, which would otherwise skew the quality results.
Not applicable records are excluded from the overall quality percentage: they do not count as Pass or Fail. In data quality results, they are shown as a separate Not applicable count alongside Pass and Fail.
If every record for a catalog item or attribute evaluates as Not applicable, the Overall Quality indicator is not displayed, and a tooltip explains the state instead.
| For a rule with only a handful of not-applicable records, the impact is negligible and a dedicated Not applicable result is rarely worth defining. |
You want to validate the format of email addresses, but only for records where the email field is not empty. Empty fields are marked Not applicable instead of failing the format check, so the data quality reflects only the records the rule is meant to evaluate.
Quality colors
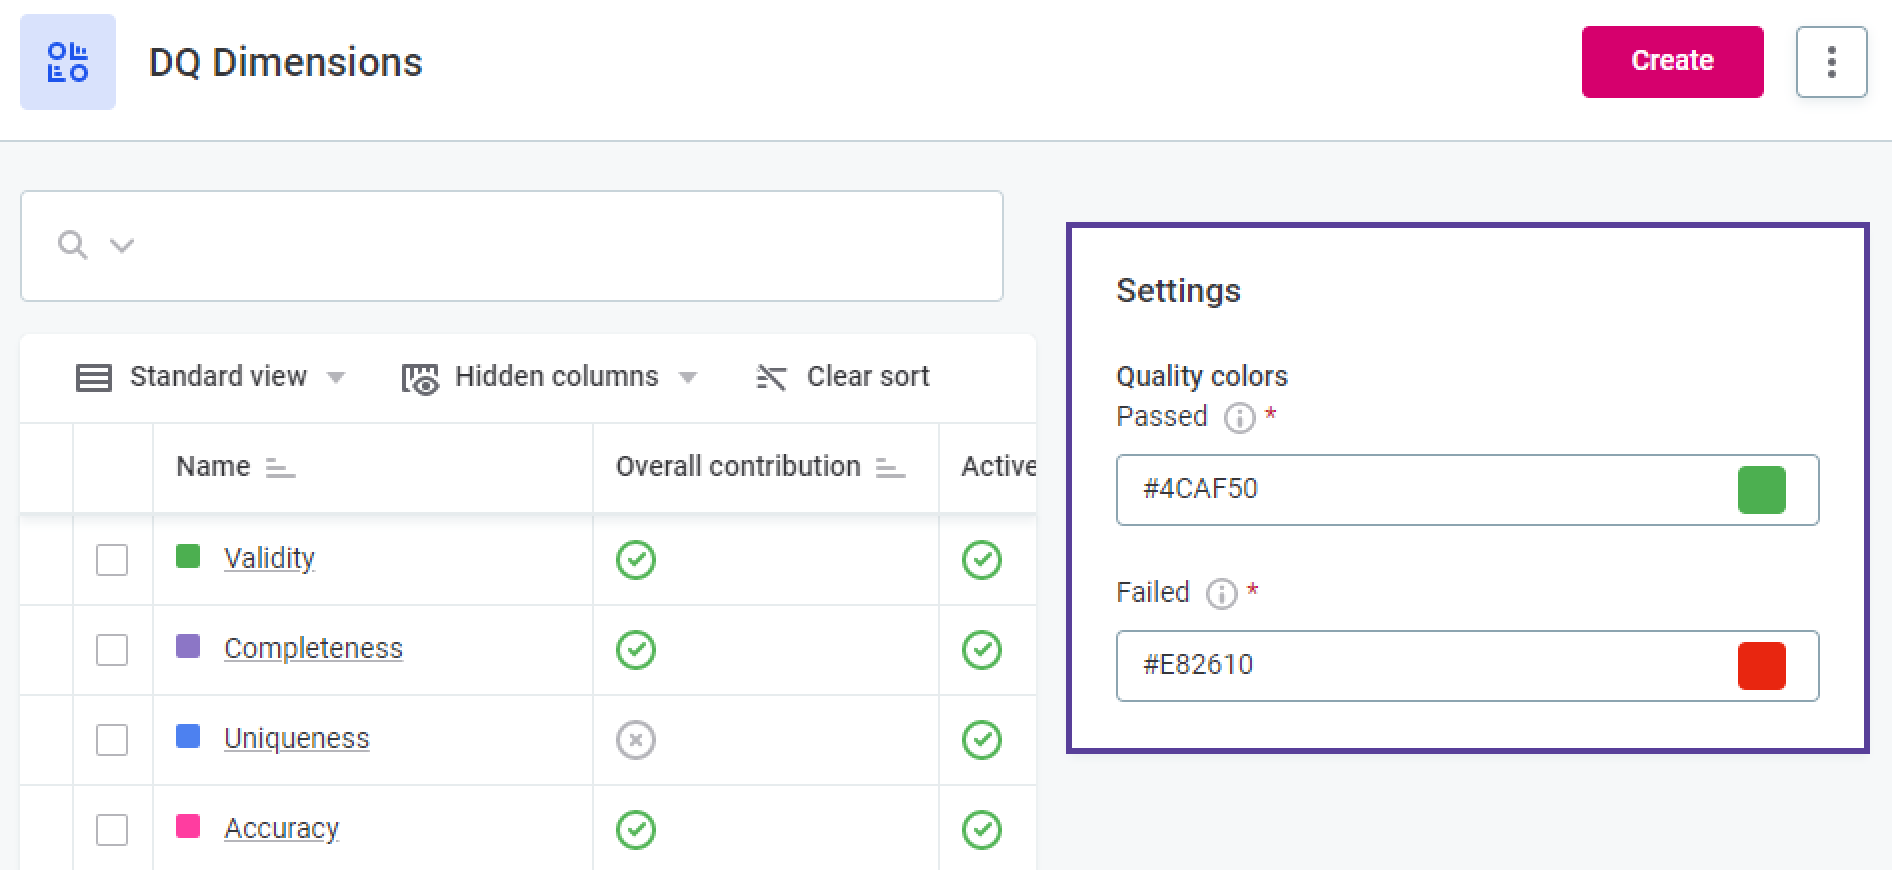
In addition to defining which dimensions contribute to Overall Quality, you also need to specify the quality colors:
-
Passed: The color that represents results that contribute positively to overall quality (that is, increase overall quality percentage).
-
Failed: The color that represents results that contribute negatively to overall quality (that is, reduce overall quality percentage).
Configure dimensions
Add dimension
Create dimension
| When creating new dimensions and their results, all names must be unique, or DQ evaluation fails. |
-
To add a new dimension, go to DQ Dimensions Settings and select Create. To edit an existing dimension, select the required dimension by clicking its name, and then select Edit.

-
Configure the dimension by providing the following information:
-
Name: Create a unique name for the dimension.
-
Order: Specify at which position the dimension should appear in the list of dimensions.
-
Active: Select to enable choosing this dimension during rule creation.
We recommend turning off this option when you do not want users to be able to select this dimension type during rule creation, as it is not possible to delete a dimension that is currently used in rules. -
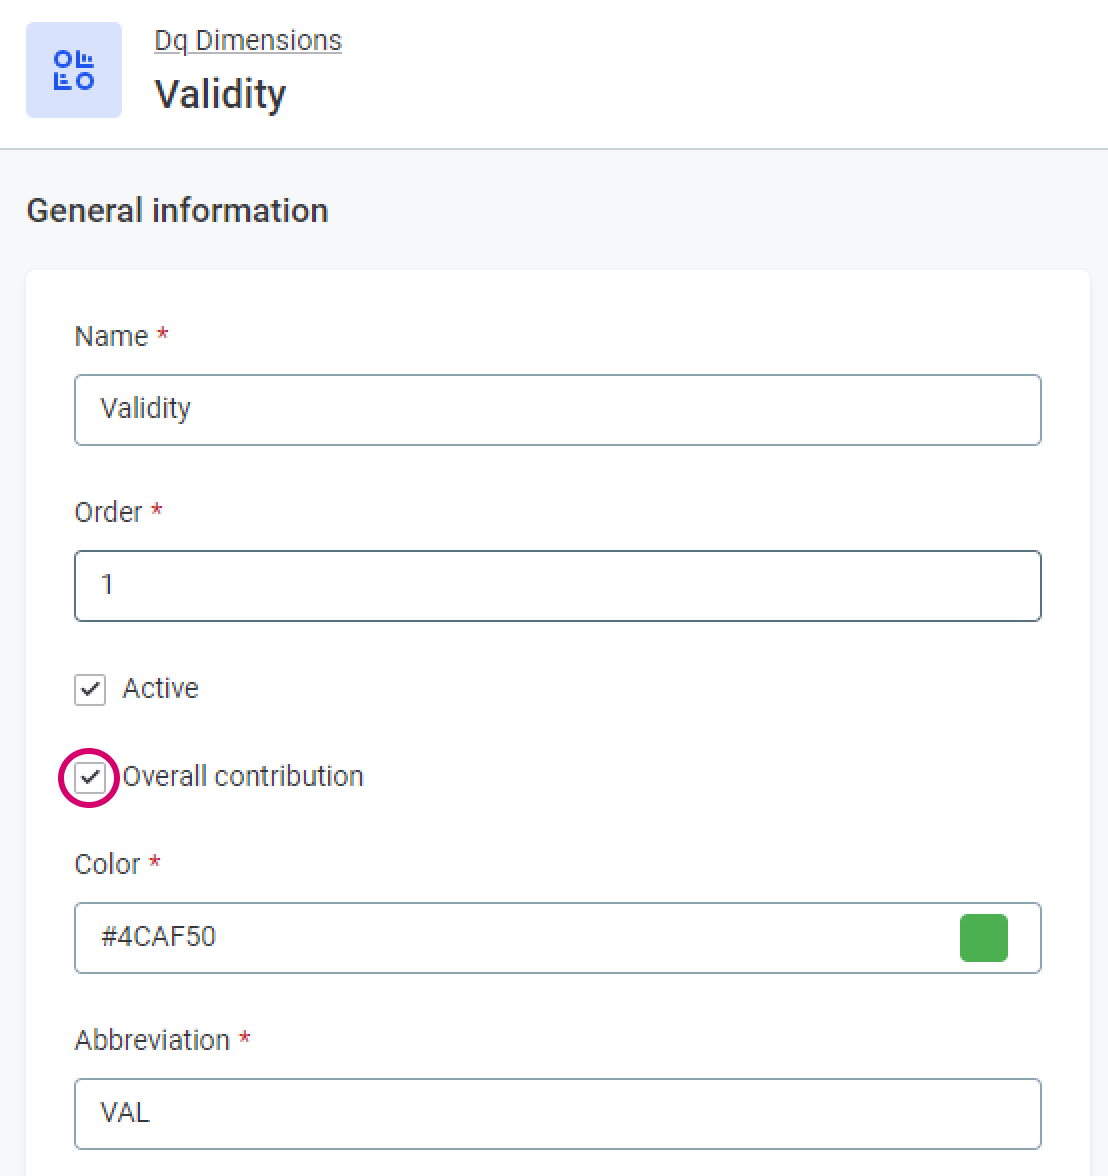
Overall contribution: Select to define whether results from this dimension are contributing to Overall Quality.
At least one dimension should always be contributing at any given time. Otherwise, it is not possible to calculate Overall Quality. -
Color: Select the color you want to be associated with this dimension in monitoring projects and DQ reports.
-
Abbreviation: Provide an abbreviation for the dimension which will be used in results and in DQ reports.
-
Description: Provide a description for the dimension.
-
-
Specify DQ dimensions results:
-
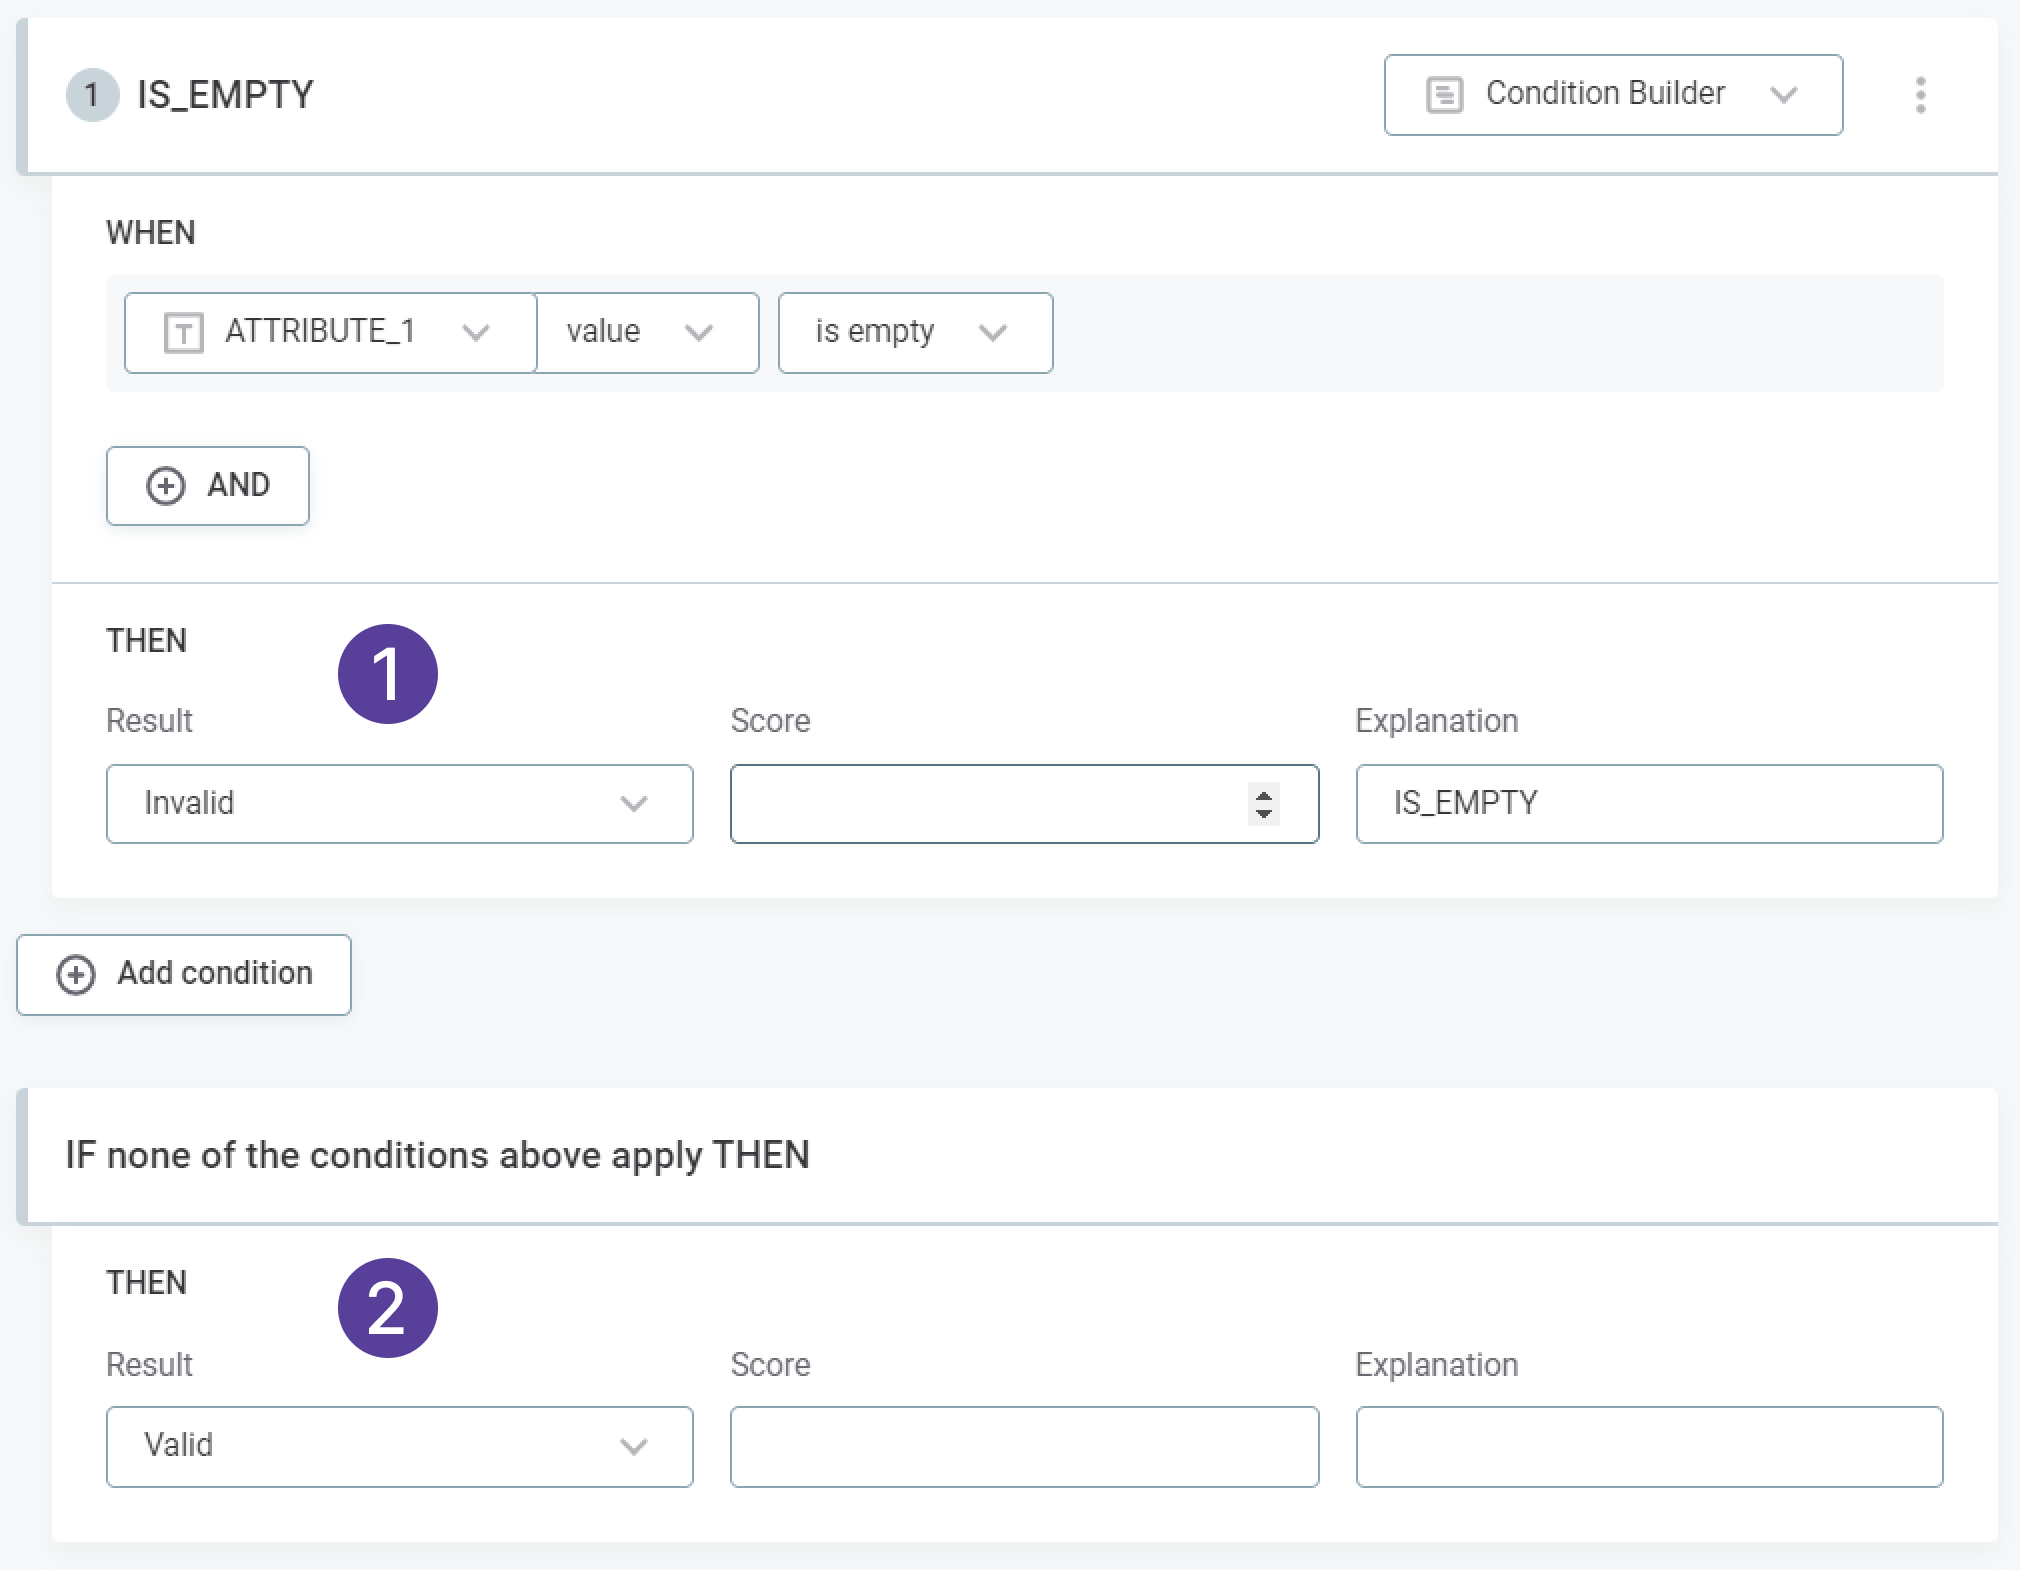
(1) Default condition result: Select the result that should be used by default when a new condition is added while defining rule logic (that is, the default result when new conditions are added for rules of this dimension).
-
(2) Default fallback result: Select the result that should be used by default when the condition does not apply (that is, the default result when something does not meet the conditions defined for rules of this dimension).
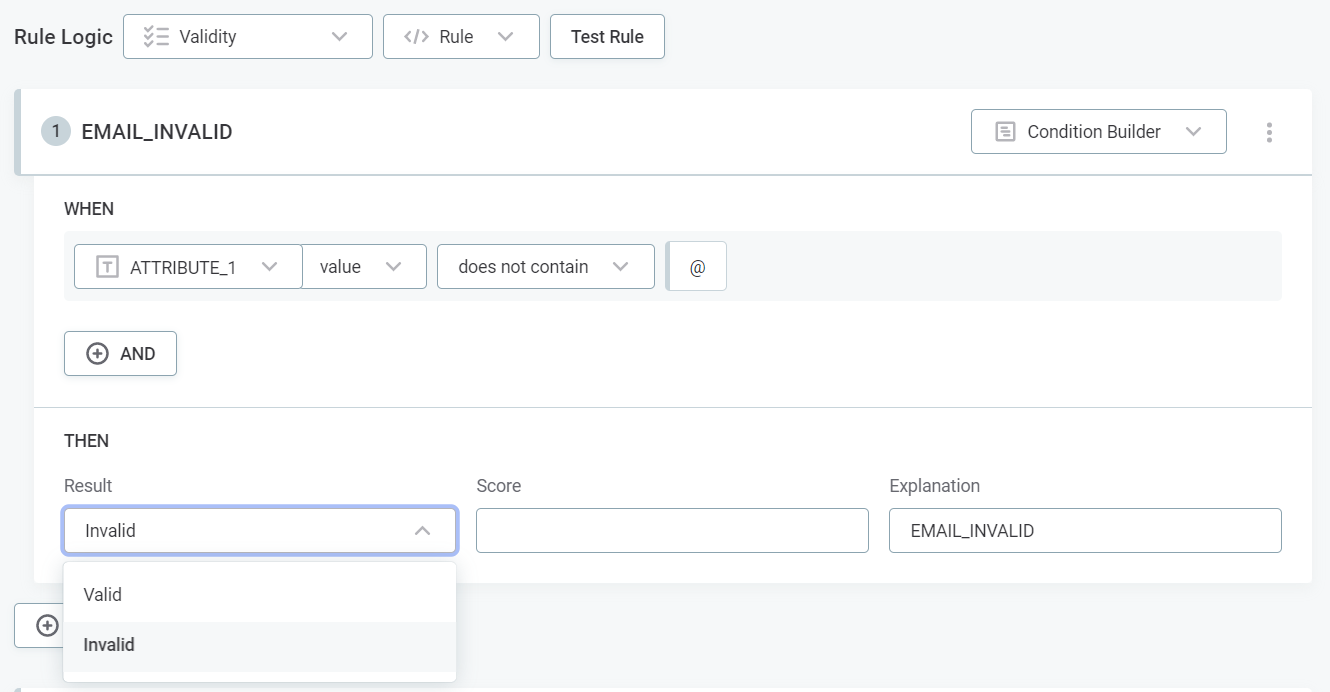
For example, in the Validity dimension, you might set the default fallback result to Valid. Rule authors then write conditions to catch invalid values, and any record that matches no condition is treated as valid.
If no results exist for this dimension yet, or you would like to add new results, add them according to instructions in Configure dimension results and return to this setting later.
-
-
Select Save and review the changes.
-
Select Publish so the new settings are available to use.
Alternatively, Discard the changes.

Configure dimension visibility
After creating the dimension, add it to the left navigation menu to create a page that lists all rules of that dimension.
-
Add the dimension to the left navigation menu according to instructions in Add a new navigation item.
Use the following configuration:
-
Add the dimension as a child of the DQ Dimensions entity.
-
In the Add navigation item dialog:
-
Listing Node: Select Rule.
-
Name: Enter your dimension name.
-
-
-
Configure the dimension page to display only rules of this dimension:
-
Select the three dots menu for the dimension and then Edit page.
-
On the Filter tab, add the following AQL expression:
implementation.dqDimension.name = "dimensionName"Replace
dimensionNamewith your actual dimension name, for example,Timeliness. -
Select Save and publish.
-
Delete dimension
|
It is not possible to delete a dimension that is currently used in rules. Consider instead deactivating the dimension so that it cannot be used in the creation of new rules. To do this, navigate to the dimension configuration and clear the Active option. |
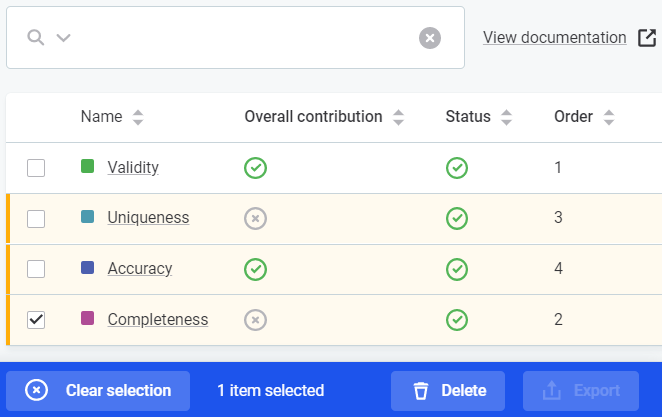
You can delete dimensions either from the list view or from the dimension page:
-
To delete a dimension from the list view, select the dimension and then Delete.
-
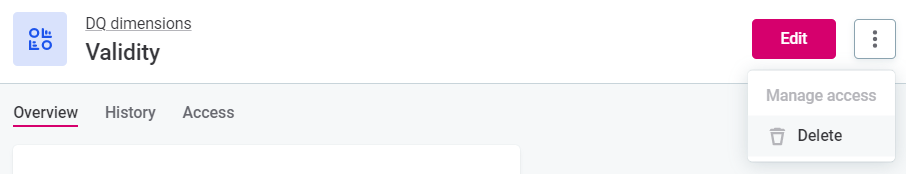
To delete a dimension from the dimension page, use the three dots menu and select Delete.
Configure dimension results
| When creating new dimensions and their results, all names must be unique or DQ evaluation fails. |
Add result
-
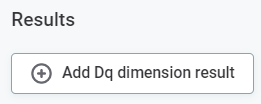
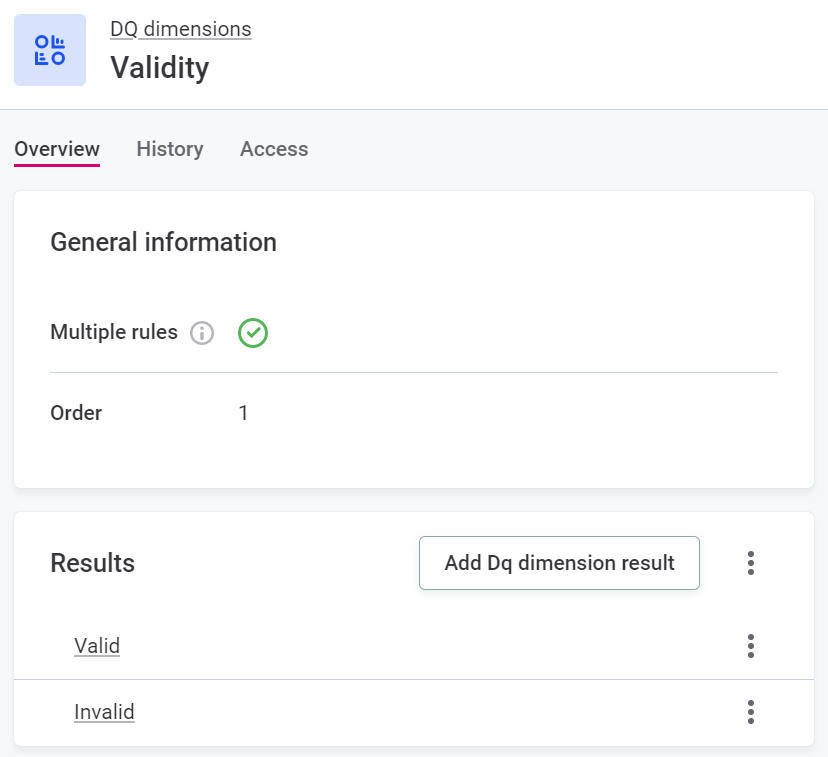
You can add results during the creation of a new dimension, or when editing existing dimensions. In both scenarios, select Add DQ dimension result.
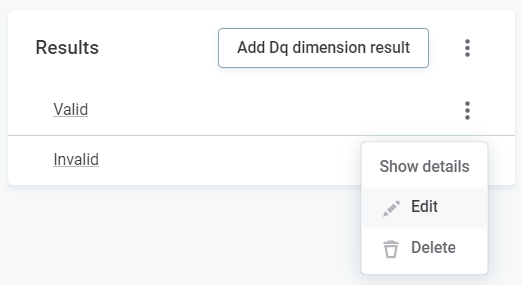
To edit an existing dimension result, first open the required dimension and then for the required result select the three dots menu and Edit.
-
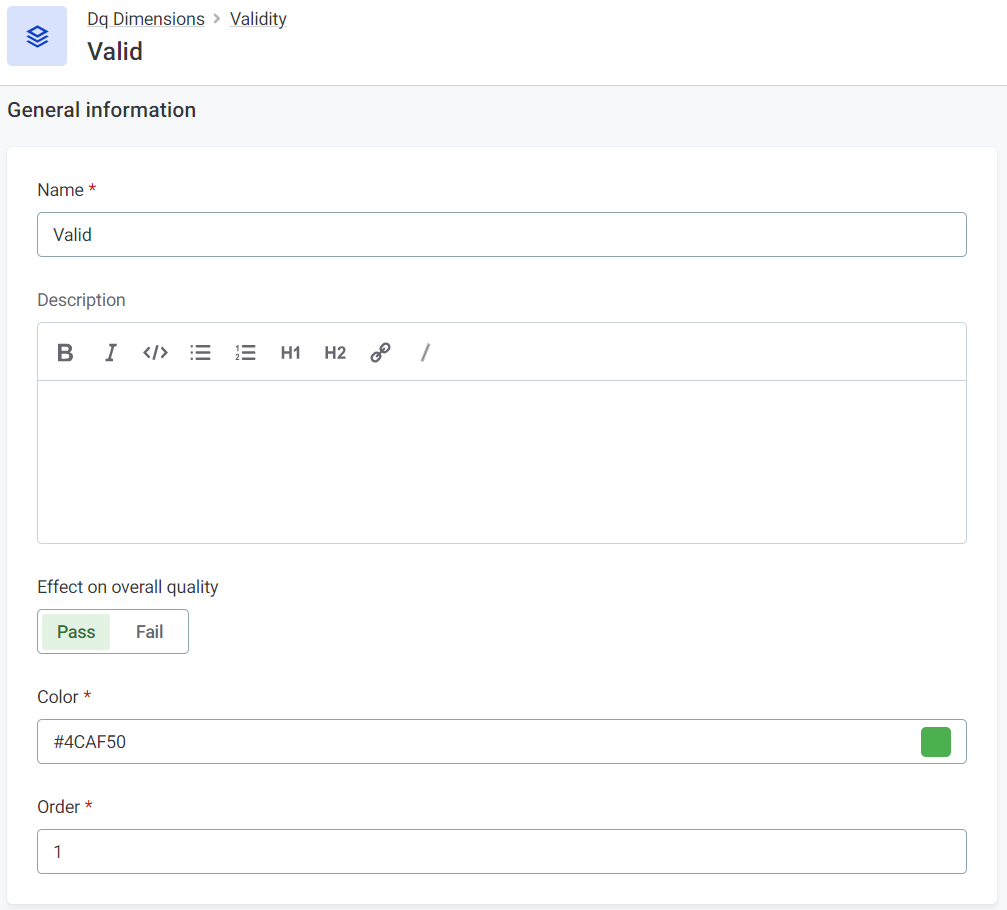
Configure the result by providing the following information:
-
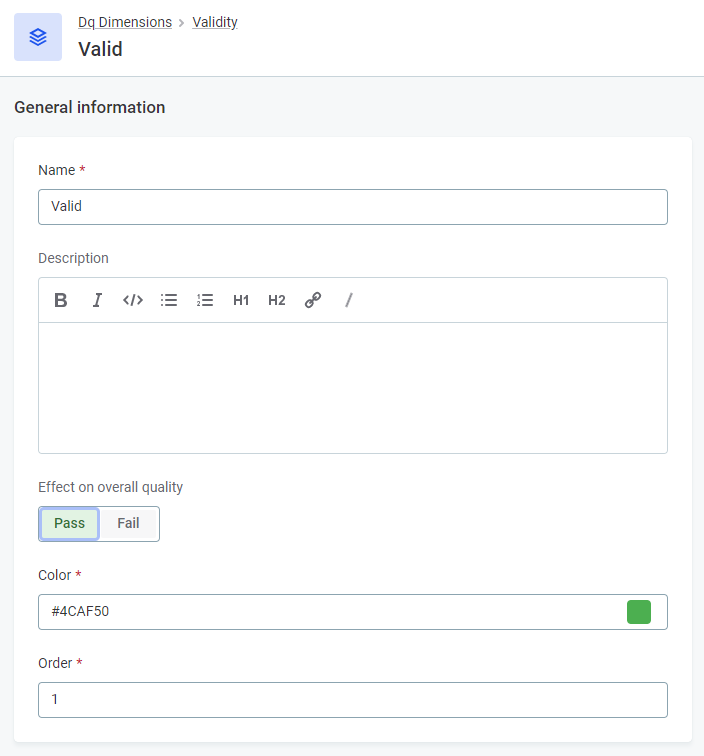
Name: Create a unique name for the result.
-
Description: Provide a description for the dimension.
-
Effect on overall quality: Select whether the result counts as Pass, Fail, or Not applicable. See How dimension results impact overall quality.
-
Color: Select the color you want to be associated with this result. This will be visible here and on the rule instance level in DQ reports.
-
Order: Specify the order in which the result is shown in the list of possible results.
-
-
Select Save and review the changes.
-
Once you are happy with the changes, select Publish so the new settings are available to use.
Alternatively, Discard the changes.

Delete result
You can delete results either from the list on the dimension screen or from the result screen:
| You can’t delete a result that is currently used in rules. |
-
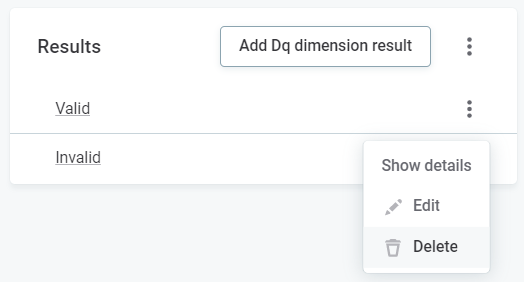
To delete a result from the list view, use the three dots menu and select Delete.
-
To delete a result from the result page, use the three dots menu and select Delete.
Default dimensions
Dimensions and their results are fully configurable but a number of predefined options exist:
-
Validity: By default, the possible results are Valid and Invalid, that is, if the condition is met, the data is valid or invalid. You can use this dimension when creating rules to verify the usability of the data (for example, regarding data format, data content, or attribute relations).
-
Uniqueness: By default, the possible results are Unique, Not populated, and Not Unique. You can use this dimension when creating rules to verify that there are no duplicate values and only one instance appears in the dataset.
-
Completeness: By default, the possible results are Complete and Not complete. You can use this dimension when creating rules to verify that the value field is specified.
Be aware that if the value contains one of the following: NULL,Null,null,.,,,-,_,N/A,n/a, and similar, it isn’t recognized as Not complete. -
Accuracy: By default, the possible results are Accurate, No reference available, and Not accurate. You can use this dimension when creating rules to check whether values are accurate and reflect the true values, for example, based on reference data.
-
Timeliness: By default, the possible results are Timeliness ok, Minor delay, and Major delay. You can use this dimension when creating rules to verify whether data is available at the time it is needed.
Each of these dimensions also has a predefined set of results which can be selected during rule creation (if you add a new dimension, you also need to define the possible results). For example, if you select the dimension Validity when creating a new rule, in each rule condition you can select only the results configured for the Validity dimension.
Like the dimensions themselves, these can be edited, added or removed. To add or edit results, first select the relevant dimension and then follow the instructions found in Configure dimension results.
|
Keep in mind that logic types are designed to help provide clear preset results based on what you are trying to evaluate, but you are able to achieve the same functionality across logic types. For example, you can set a custom Usability dimension condition with the results Unique or Not Unique. It is the condition definition that is key. |
Example: How dimensions combine into overall quality
While How overall quality is calculated shows how a single record is evaluated, this example shows how the results of several records and dimensions combine into the final Overall Quality percentage. The example uses only Pass and Fail results, since any record that evaluated as Not applicable would be excluded from both the pass and fail counts (see Not applicable results).
In this example, two rules are tied to dimension A: rule A1 and rule A2. There is one rule tied to dimension B: rule B1.
| Dimension | Dimension result | DQ result (pass or fail) |
|---|---|---|
Dimension A |
result 1 |
pass |
result 2 |
fail |
|
result 3 |
fail |
|
Dimension B |
result X |
pass |
result Y |
fail |
The results of four records are as follows:
| Record | Rule A1 | Rule A2 | Dimension contribution | Rule B1 | Dimension contribution |
|---|---|---|---|---|---|
Record 1 |
result 1 |
result 1 |
pass |
result x |
pass |
Record 2 |
result 1 |
result 2 |
fail |
result y |
fail |
Record 3 |
result 2 |
result 3 |
fail |
result y |
fail |
Record 4 |
result 2 |
result 2 |
fail |
result x |
pass |
In DQ reports, you can see a collation of the individual results on the rule level, and an aggregated result of the pass and fail rate for each dimensions.
Rule level result collation
The result collation at the rule level is:
-
A1 — 50% result 1, 50% result 2, 0% result 3.
-
A2 — 25% result 1, 50% result 2, 25% result 3.
-
B1 — 50% result x, 50% result Y.
Data quality aggregation
The data quality aggregation for these results is:
-
Dimension A (for example, Validity) — 25% pass, 75% fail.
-
Dimension B (for example, Completeness) — 50% pass, 50% fail.
If only these two dimensions are contributing to overall quality, the Overall Quality for these records is 25%.
Manage access
To manage access to the dimension:
-
Select the dimension name to open the Overview tab.
-
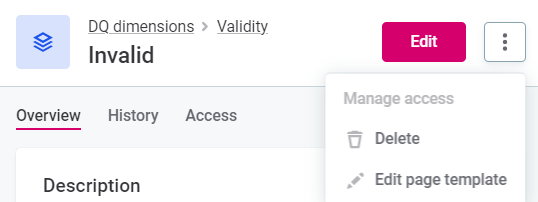
Select the three dots menu and then Manage access, or navigate to the Access tab directly.
-
Set access permissions. For more information, see Share Access to Assets.
Was this page useful?