
Glossary
- Dashboard
-
Dashboards provide a flexible layout for all your data exploration needs.
They consist of a multipage canvas (landscape or portrait oriented A4) with a fully configurable layout. You can cross-filter all widgets that share a common data source across the entire canvas.
- Story
-
Scrollable data stories allow you to present a specific storyline without the reader having to drill the data down on their own. Use them to explain your topic in an intuitive and visually attractive way: through graphs, maps, charts, and text.
You can share the content you’ve created by embedding it, sharing a full story as a URL link, or converting the story into a video.
- Visualization
-
Visualizations help you understand the nature of a specific dataset at one glance. They also allow you to explore data in more detail and build charts thanks to an intuitive interface.
The visualizations can then be added seamlessly into any story or dashboard.
- Widget
-
A static widget is a visual element you can add to a story or dashboard canvas. The widget can take on the form of a text, image, video, and so on.
- Charts
-
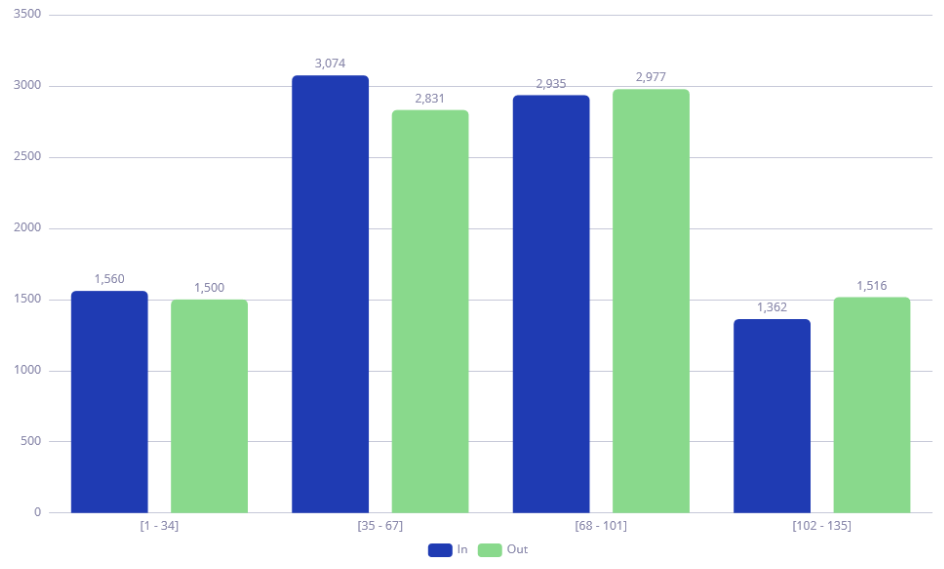
- Bar Chart, Bar Multiseries and Category Chart
-
This group of charts uses bars to visualize your data. The Bar Chart displays metrics of a single category, while the Bar Multiseries allows you to add a subcategory to the x-axis. The Category Chart displays the bars horizontally, with category on the y-axis and metrics on the x-axis.
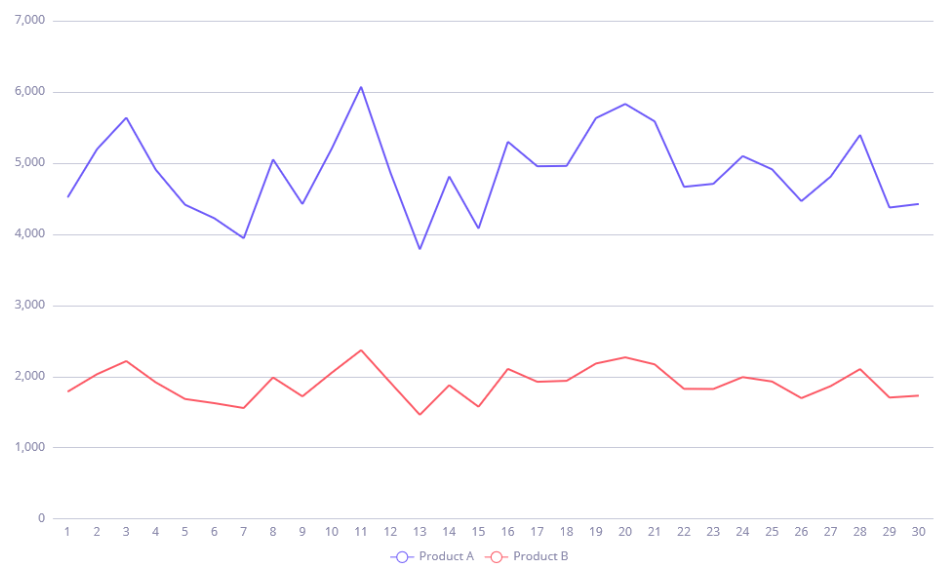
- Line Chart and Line Multiseries
-
These charts present data as lines. Use the Line Multiseries chart to break down your category into subcategories.
- Pie Chart and Donut Chart
-
These charts display data as proportionate slices of a circle.

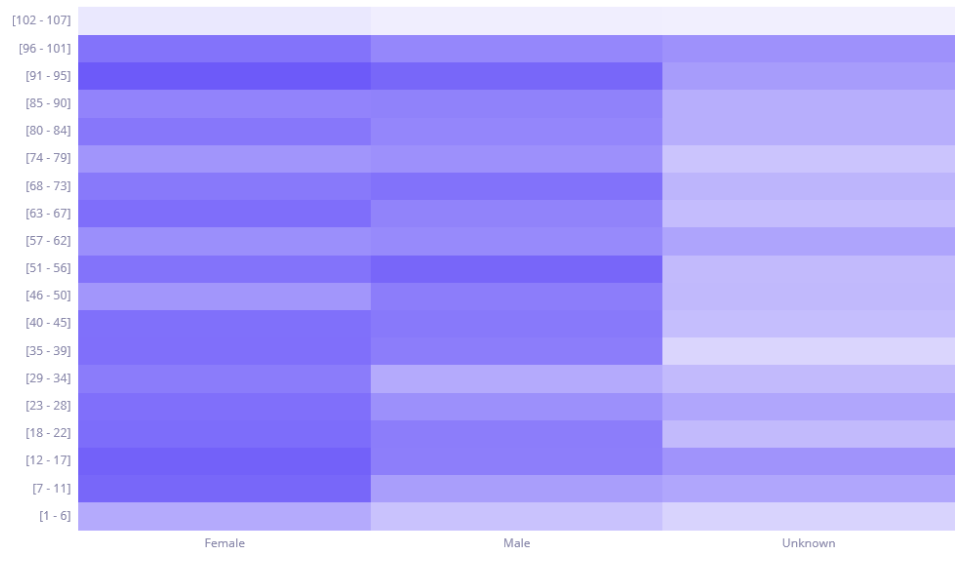
- Scatter Chart, Bubble Chart, Heatmap Chart
-
The Scatter Chart helps to visualize the relationship between two categories. The Bubble and Heatmap Charts allow you to also track a metric represented by the size of bubbles or shades of color.
Was this page useful?