
Data Observability
Read this article to learn about data observability and how to set it up in Ataccama ONE. For information about viewing data observability results, see Data Observability Dashboards.
What is data observability?
The Ataccama Data Observability module builds on, and expands, existing data quality monitoring capabilities. Data observability allows you to understand the state of your data based on the information you’re collecting about that data, such as data quality issues, anomalies, or schema changes.
The key components of data observability are:
-
Data quality monitoring. Regularly checking data against predefined data quality rules and presenting results and trends.
-
AI-powered anomaly detection. Some data quality issues are unpredictable and need AI to scan for them. For example, sudden drops in data volumes or average values in a specific column.
-
Data discovery. Monitor and track data issues and understand what data appears in your critical systems (especially if you work with a lot of PII). Continuous data discovery within an automated data catalog, including a business glossary, also plays a critical role in data quality monitoring.
-
Freshness. Verify that there are no missing updates and that data is being correctly fed to the system. Monitoring data updates and detecting anomalies ensure that the data is up-to-date and accurate, which is crucial for making informed decisions based on the data. This feature also helps prevent errors that can occur when working with outdated data, saving time and resources.
With these components in place you can better understand the nature of your data, including:
-
Data quality information. As measured by contributing data quality dimensions.
-
Schema changes. Data architecture changes in source systems can break reports and affect consuming systems, so checking for removed data attributes or changed attribute types is important.
Virtual catalog items (VCIs) cannot undergo schema checks as schema checks are run on the database directly. -
Anomalies in various data metrics:
-
Changes in data volume.
-
Statistical metrics such as minimum, maximum, average, or value frequencies.
-
-
Changes in business domains of data, such as customer data, product data, transactional data, reference data, or specific business data types, such as
first name,last name,email address,product code,transaction id,gender, andISO currency code. -
Data freshness, that is, how up-to-date your data is.
-
Any other metadata coming from ETL processes.
Data observability in ONE
The Data Observability module takes minimal configuration as it relies on the relationship between the data catalog, business glossary, and rules. Business terms are defined in the business glossary, data quality rules are applied to terms, and terms are applied to items in the catalog during data discovery.
As the module contains a number of predefined rules and terms, the process is mainly automated. However, it is possible to configure terms and rules more specific to your needs. In addition to this process, AI detects anomalies and suggests business terms.
The following steps outline this process:
-
The discovery process analyzes the data and detects business terms within specific attributes, such as "this data attribute contains an email address."
-
You select the business terms you want to monitor. For example, “I want to monitor names, emails, social insurance numbers, and so on.”
-
Schedule data observability runs. Choose how often you want to monitor data. This detects anomalies, applies new business terms, applies DQ rules, and performs structure checks.
-
Get notifications, improve AI, consume statistics on the data observability dashboard, analyze issues, and fix them.
To get started with Data Observability in Ataccama ONE, follow the steps in this guide.
| The anomaly detection, profiling, and DQ evaluation used in the Data Observability module are the same as elsewhere in ONE. Performance is the same unless pushdown processing is used. |
Observed sources
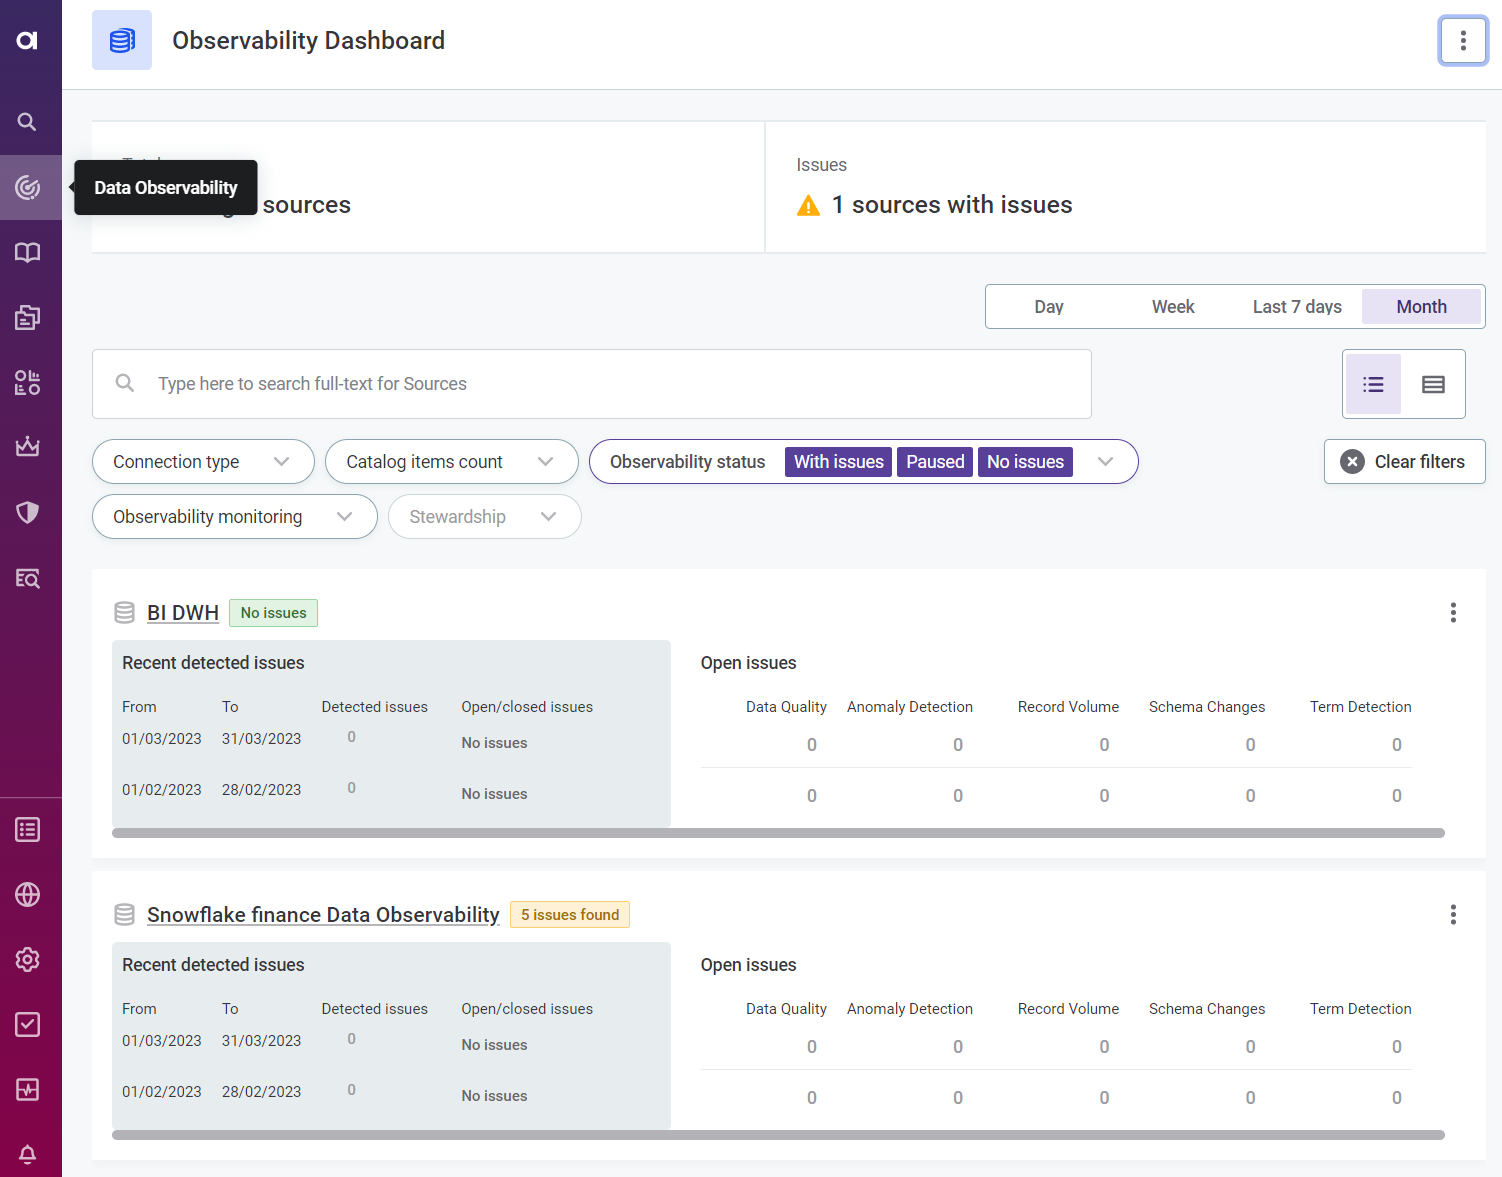
To see the status of all observed systems, select Data Observability in the navigation menu.
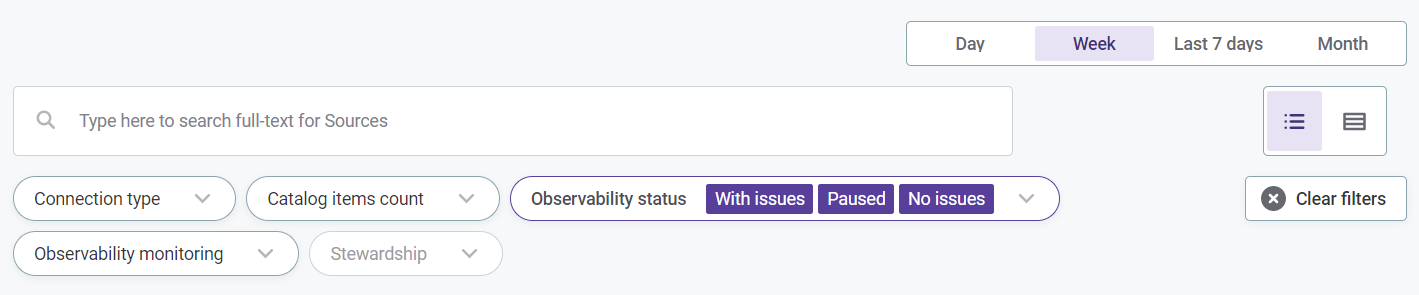
You can filter the selection by connection type, catalog item count, data observability status, data observability monitoring, data observability issue count, term and stewardship, as well as according to the selected time frame (such as day, week, month). Use the icons to switch between table view and list.
To view results, select the system name. For more information about data observability results, see Data Observability Dashboards.
To edit the configuration, see Configure data observability.
Set up data observability
To use the Data Observability module for your data source:
-
Connect to a data source. See Connect your source for instructions.
-
Run data discovery. See Run data discovery for instructions.
-
Configure data observability. See Configure data observability for instructions.
| If you are connecting to a new source, first you need to run data discovery—the import and initial analysis of the metadata in your connected system. After that, you can select which aspects of the dataset you would like to monitor. |
|
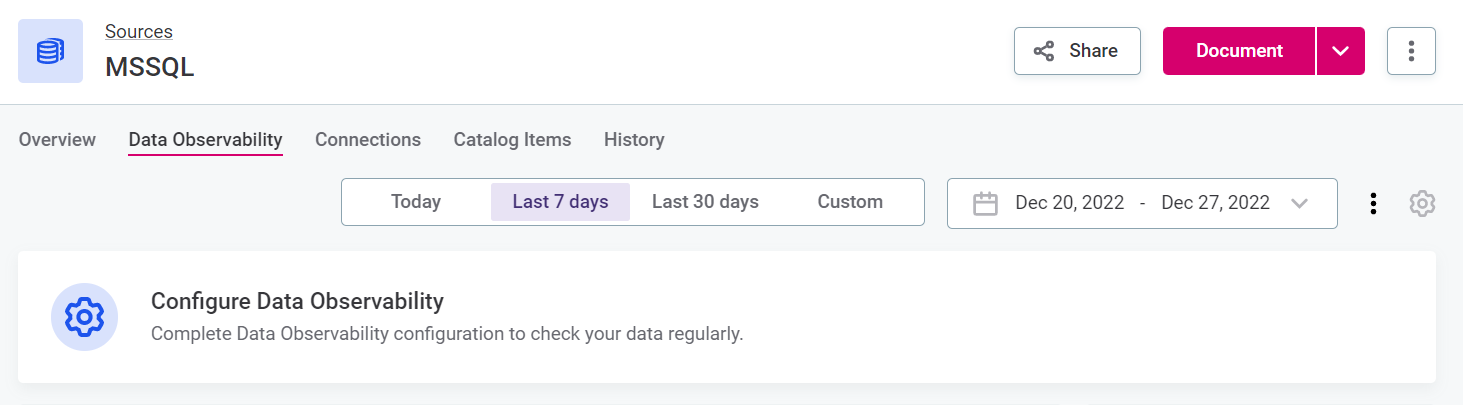
If you want to configure observability on an already connected source, select the source, navigate to the Data Observability tab and follow the instructions found in Configure data observability.
To edit an existing configuration, select the required source, navigate to the Data Observability tab and select the settings icon. |
Connect your source
Add a source and a source connection according to the instructions for your connection type in the Connect to a Source section of the documentation.
Freshness checks are available by default for the following data sources:
-
Snowflake
-
PostgreSQL
-
BigQuery
Requires single-region locations. If your data source contains data across multi-regions, freshness checks will fail. -
Oracle
Additional configuration for PostgreSQL and Oracle
PostgreSQL and Oracle require the following action on the database side before freshness can function.
-
PostgreSQL
Commit timestamps have to be enabled in
postgresql.conf(restart required):track_commit_timestamp = on -
Oracle
Current user must have these permissions granted:
grant ANALYZE ANY to <user>;
grant SELECT on dba_tab_modifications to <user>;
Run data discovery
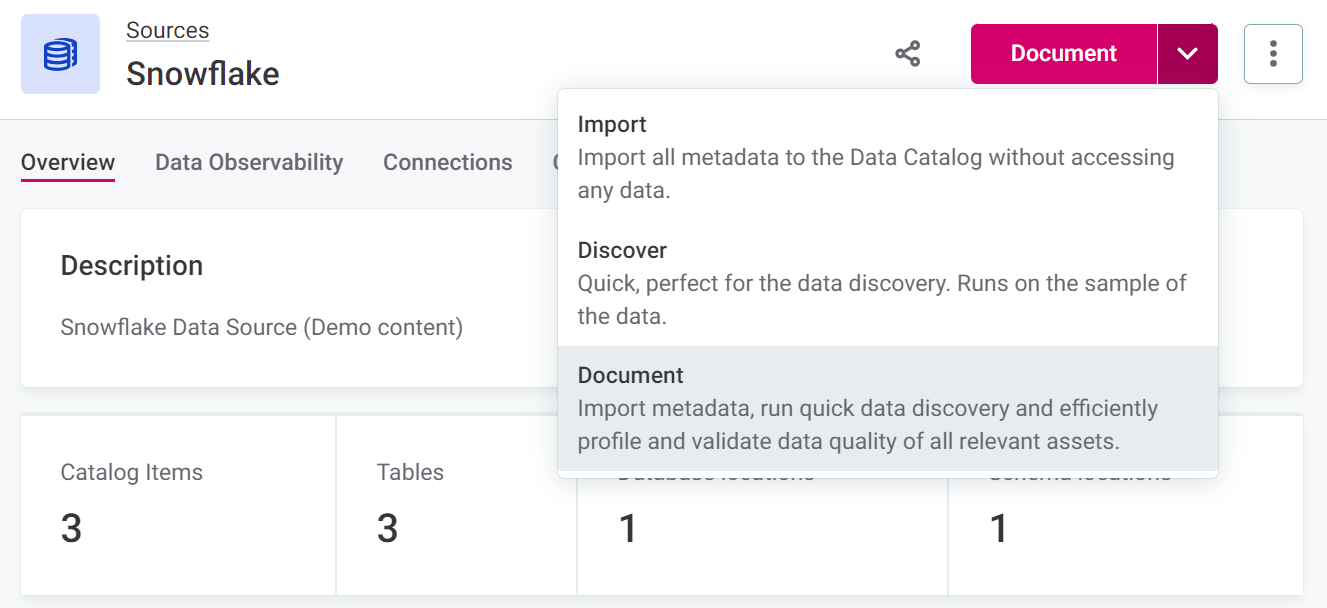
If it has not already been run, you need to run at least a sample profiling on your source before configuring data observability. This can be done at the source level, using one of the documentation flows (Discover or Document), or at the catalog item level, using Sample profiling or Full profiling.
Configure data observability
Once you have an active connection to your data source and the data discovery process is finished, you can configure data observability. This involves selecting what you want to observe, how regularly, and how you want to be notified in case of issues.
Data observability configuration leverages terms to allow you to select which items you want to monitor most closely.
|
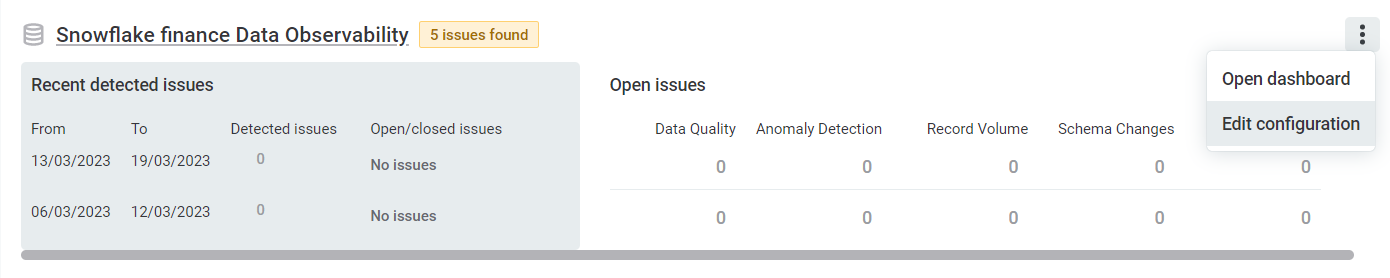
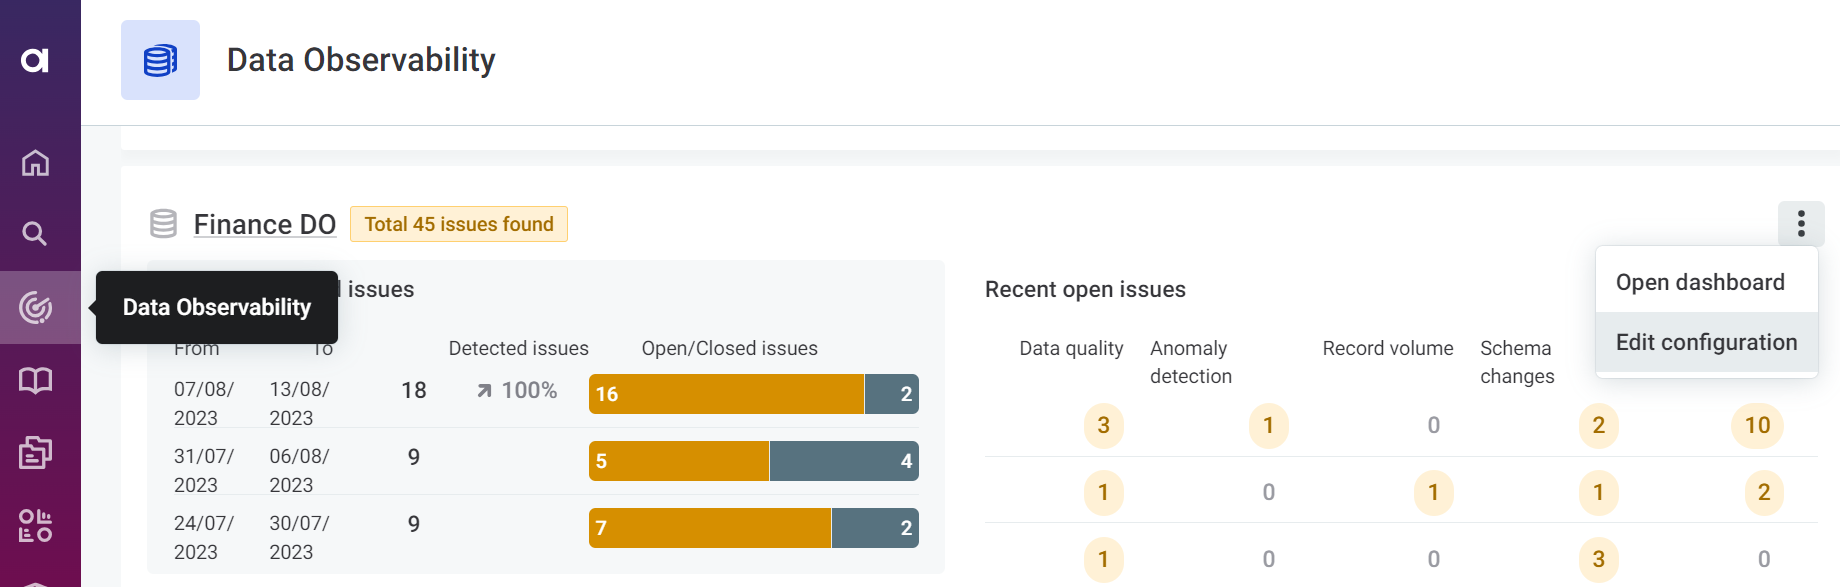
To edit an existing configuration, select the settings icon on the Data Observability tab of the source or navigate to Data Observability in the navigation menu and use the three dots menu for the relevant listing.
|
To create a new data observability configuration, select the settings icon on the Data Observability tab of the source. Both Basic and Advanced configuration options are available.
-
To proceed with basic configuration, select the Basic tab and follow the instructions in Basic configuration.
-
Alternatively, select the Advanced tab and follow the instructions in Advanced configuration.
Use basic configuration if you want to proceed with the default settings. Use advanced configuration if you want more control over notification thresholds, anomaly detection sensitivity, and to set up freshness monitoring.
Basic configuration
Select terms
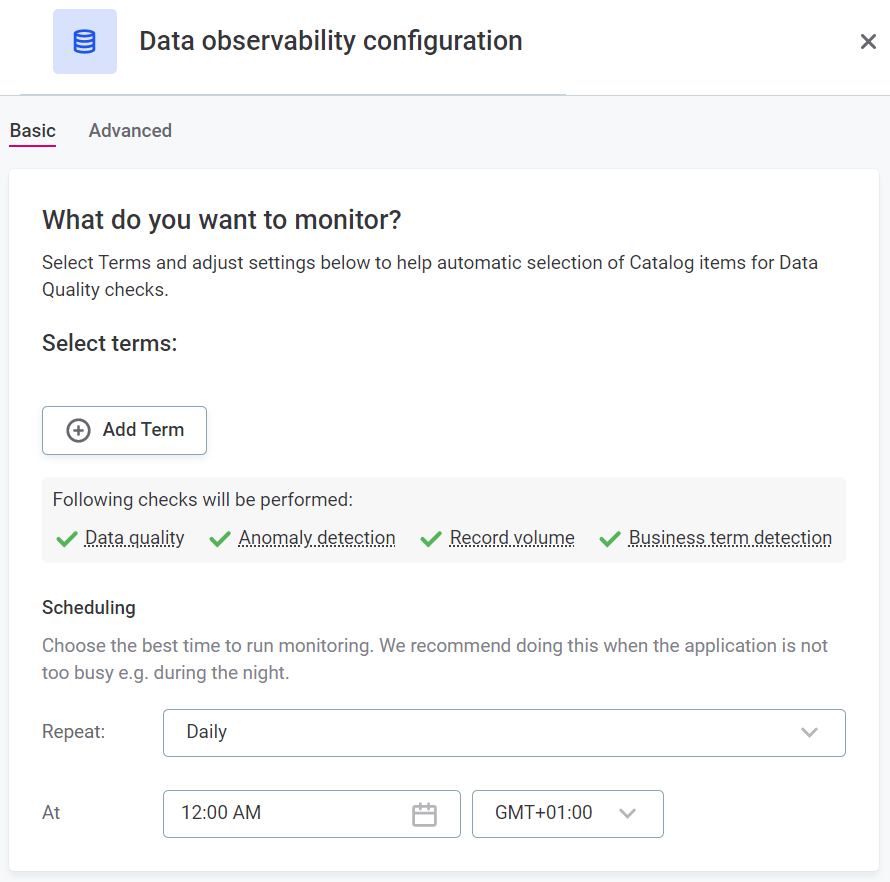
Here you can identify data for more in-depth observation by selecting the terms associated with that data.
|
Data with terms selected here undergoes:
Data without selected terms undergoes:
It is possible to change these settings in advanced configuration. |
| In the context of data observability, business term detection refers to ongoing term detection. For example, if any of the attributes in the catalog items change and as a result another term is detected during the data observability monitoring run. |
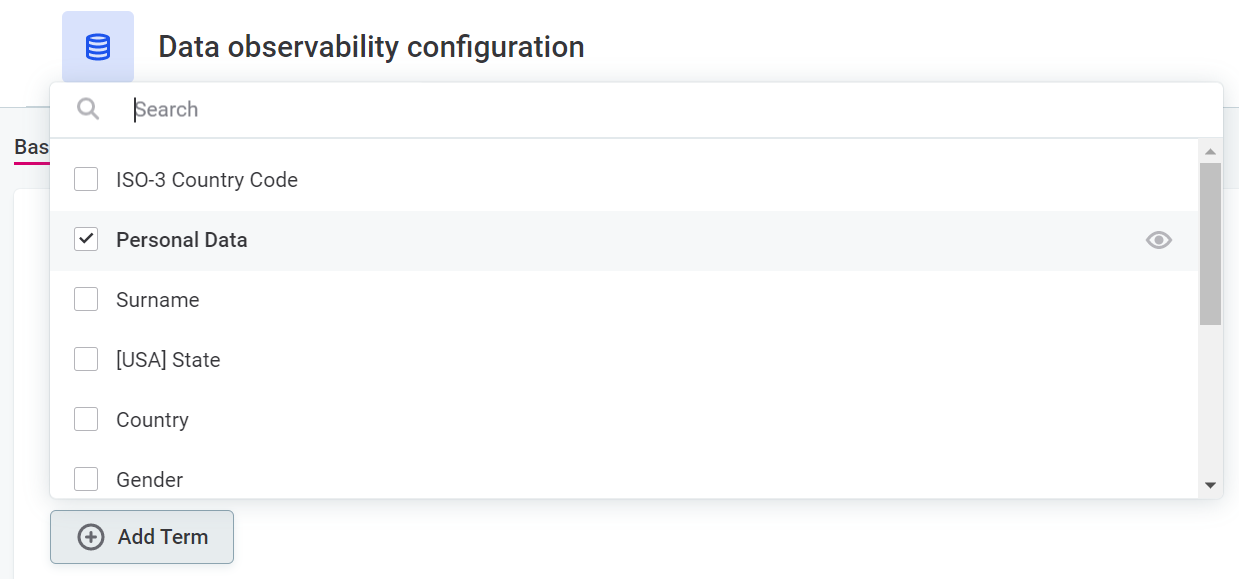
To select terms:
-
Select Add terms, and then select terms associated with important data from the list.
-
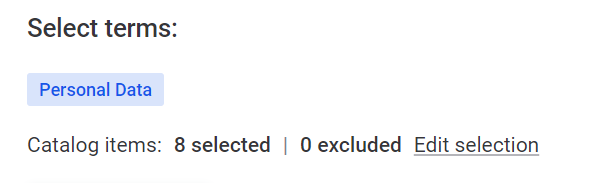
Once you have selected terms, all associated catalog items are selected for monitoring. Select Preview to check which items are selected as a result of your condition.
You can exclude individual catalog items if needed. To do this:
-
Select Edit selection.
-
Now you see all catalog items associated with the terms you have selected. Use the three dots menu and select Exclude to remove any of these items from monitoring.
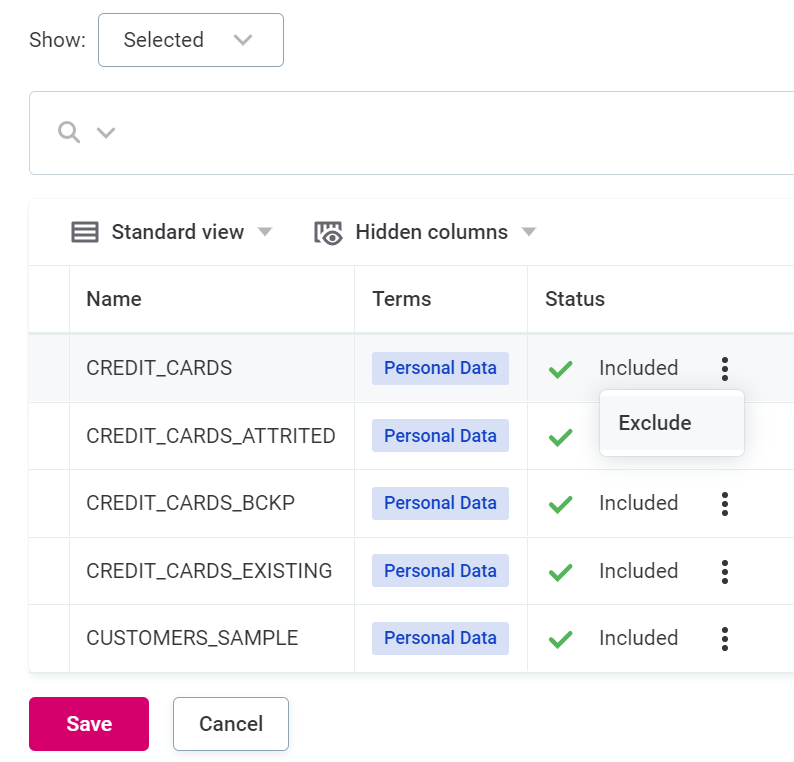
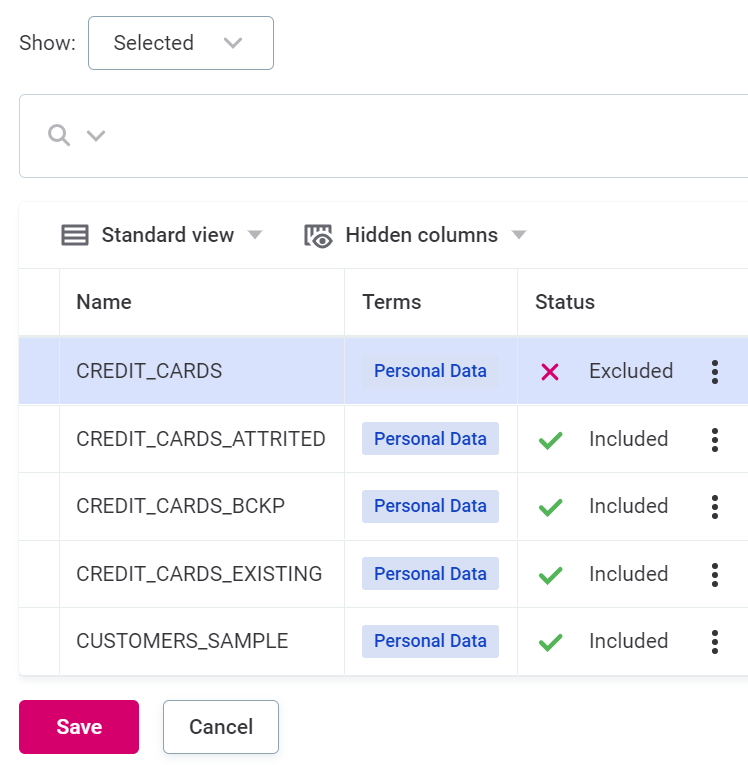
-
Select Save.
-
-
Set up Scheduling:
-
In Repeat, select the intervals at which you would like the monitoring to be run.
-
Select the time, day, and date required. How many of these options are applicable depends on the interval selected.
-
Select the time zone.
When using Basic configuration, by default, the monitoring is queued for later if the platform is not accessible at the scheduled time. To turn this setting off, use the Advanced configuration.
-
| When using Basic configuration, you are notified by default when new terms are detected in the source or when terms are newly suggested on observed catalog items. From the data observability dashboard, you can then add the terms to the observed system or accept the term suggestion, respectively. For more information, see Data Observability Dashboards. |
Data freshness
To configure data freshness, see Configure data freshness checks in Advanced configuration.
Schema changes
Schema changes notify you of changes in the structure of metadata, such as new or missing columns or changes in data type. For more control over which of these changes you are notified about, use Advanced configuration. VCIs are not included in schema change checks.
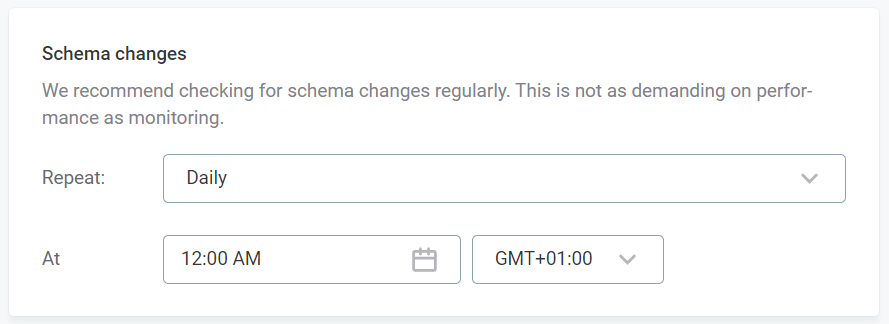
-
In Repeat, select the intervals at which you would like the monitoring to be run.
-
Select the time, day, and date required. How many of these options are applicable depends on the interval selected.
-
Select the time zone.
Notifications
Select how you would like to be notified. You can choose more than one option: select all that apply.
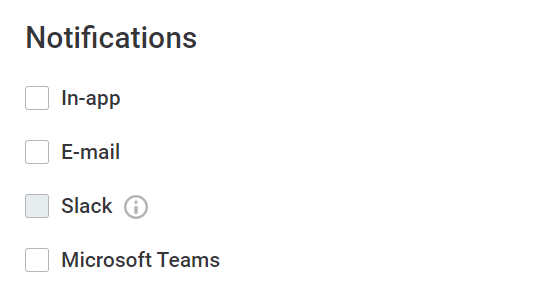
-
In-app: Select groups or roles.
-
Email
-
Slack: Enter the channel name.
If ONE is not connected to Slack, you can connect to your workspace in general settings. For instructions, see Slack Integration. -
Microsoft Teams (see MS Teams Integration).
Advanced configuration
Data with selected terms
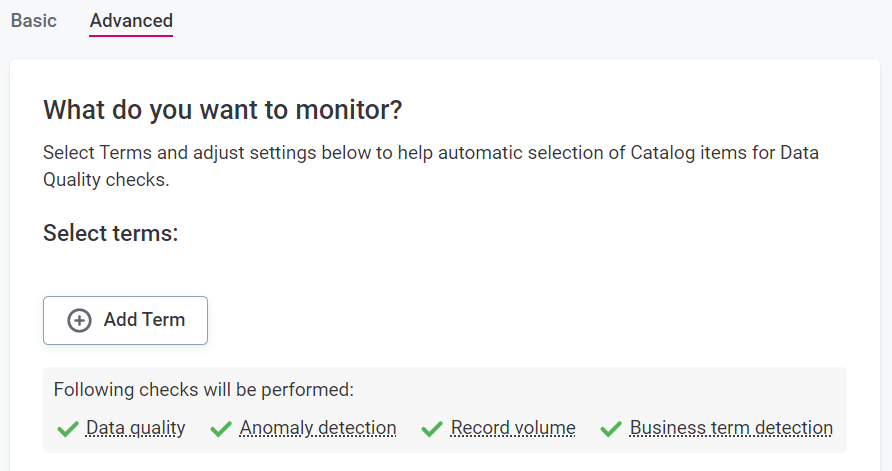
-
Select your preferred method for selecting the data you want to observe.
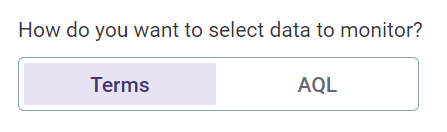
-
If you select Terms:
-
Select Add terms, and select terms associated with important data from the list available.
-
Once you have selected terms, all associated catalog items are selected for monitoring.
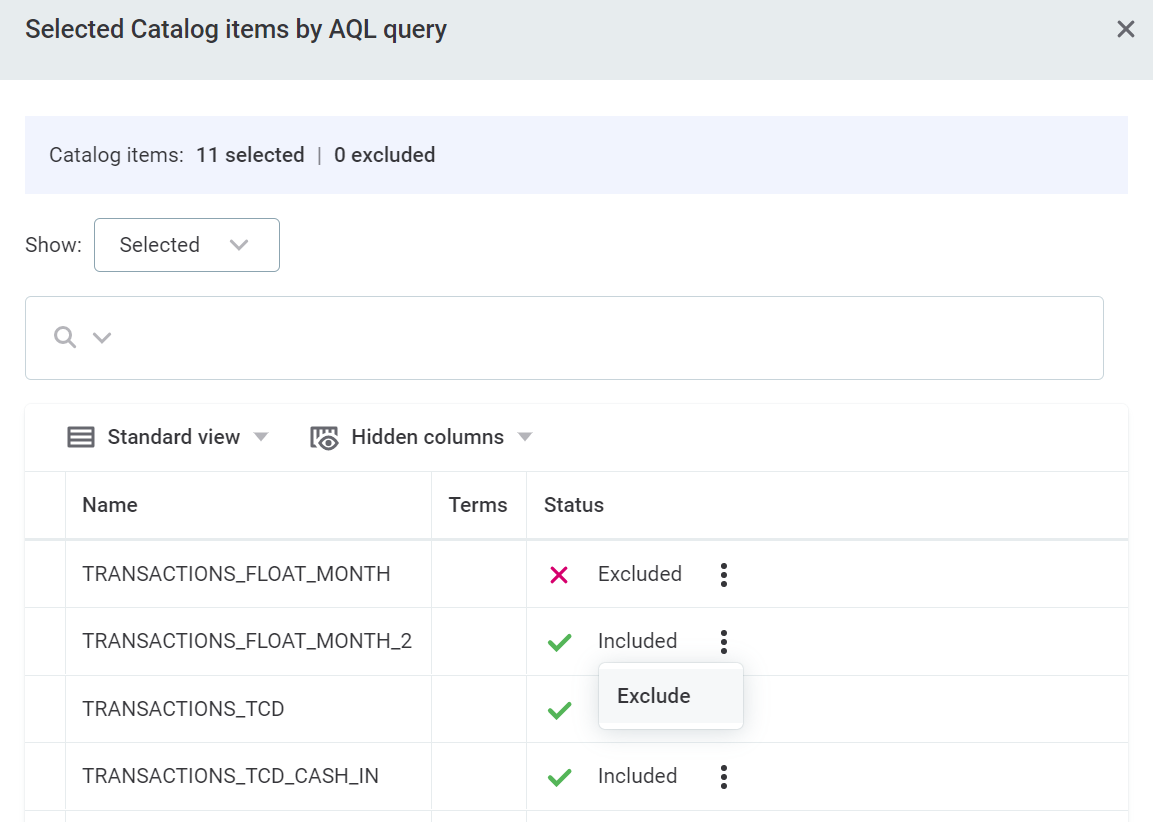
You can exclude individual catalog items if needed. To do this:
-
Select Edit selection.
-
Now you see all catalog items associated with the terms you have selected. Use the three dots menu and select Exclude to remove any of these items from monitoring.
-
Select Save.
-
-
-
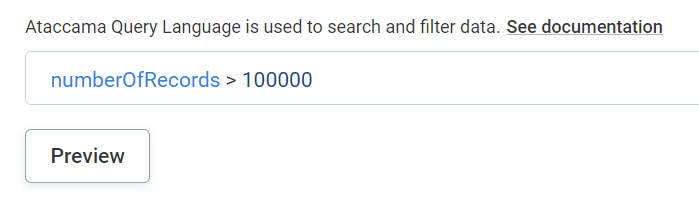
If you select AQL:
-
Use Ataccama Query Language (AQL) to filter out the data you want to observe. All catalog items that comply with the search query are selected for monitoring.
Using AQL filter instead of manual selection means that new items added to the data source are included in freshness checks if they satisfy the filter conditions. -
Select Preview to check which items are selected as a result of your condition.
-
You can exclude individual catalog items if needed. To do this:
-
Select Preview.
-
Use the three dots menu and select Exclude to remove any of these items from monitoring.
-
Select Save.
-
-
-
-
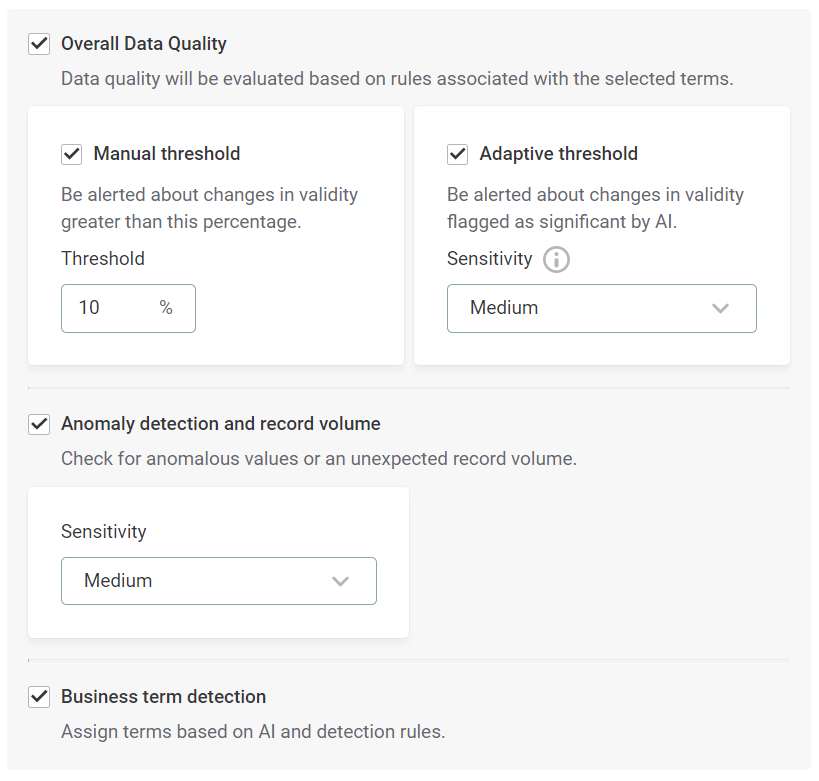
Specify whether Overall data quality is calculated.
If this option is turned on, data quality monitoring is calculated based on rules associated with the selected terms.
-
Specify whether Manual threshold is active.
If this option is turned on, you need to specify the required threshold (%). You are notified whenever changes in data quality exceed this threshold.
-
Specify whether Adaptive threshold is active.
If this option is turned on, you are notified when the AI detects what it considers to be a significant relative change in data quality percentage.
You also need to select the required sensitivity: Very Low, Low, Medium, High, or Very High.
High sensitivity means more changes might be detected as significant but can result in false positives. Low sensitivity reduces the number of significant changes detected but can result in false negatives.
-
-
Specify whether Anomaly detection and record volume checks are active.
If on, AI-driven anomaly detection is enabled, and you are notified when anomalous values are detected or if the number of records in each table is not as expected.
You also need to select the required sensitivity: Very Low, Low, Medium, High, or Very High.
High sensitivity means more changes might be detected as significant but can result in false positives. Low sensitivity reduces the number of significant changes detected but can result in false negatives.
-
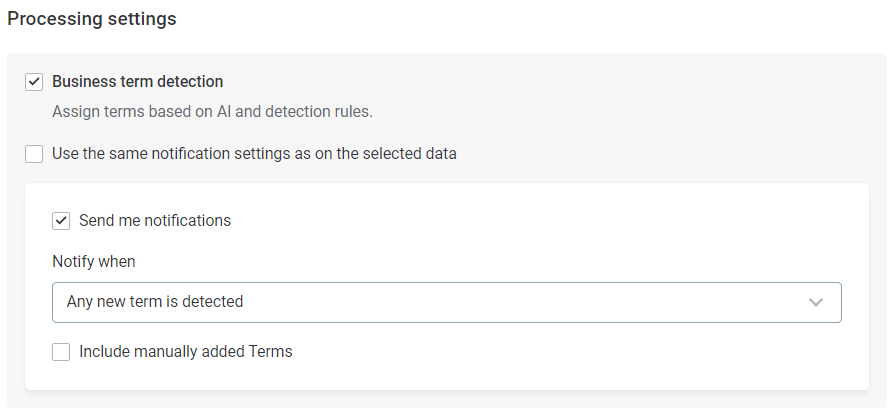
Specify whether Business term detection is active.
If this option is turned on, terms are added based on AI and detection rules.
-
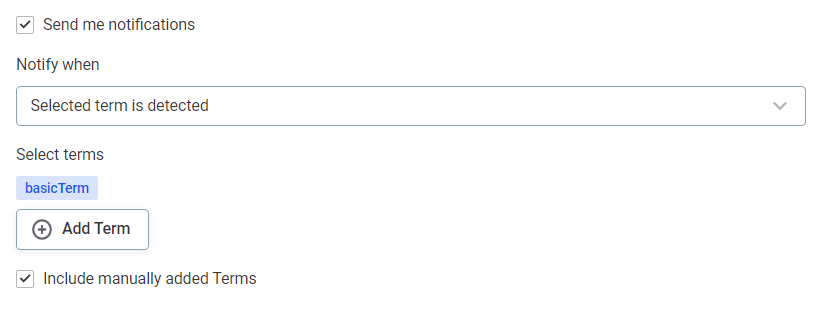
If business term detection is active, you can also enable notifications by selecting Send me notifications.
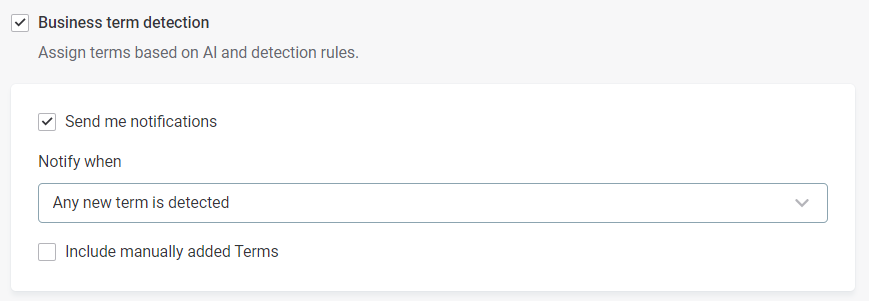
You can be notified in the following instances:
-
Selected term is detected — When selected terms from the glossary are detected in this source for the first time.
Use Add Term to select the terms you would like to be notified about.
-
Any new term is detected — When any term is detected in the source for the first time.
For term notifications, you are only notified the first time the term is detected. -
Selected occurrence is detected — When selected terms from the glossary are detected on catalog items in the source.
Use Add Term to select the terms you would like to be notified about.
-
Any new term occurrence is detected — When any term is newly detected on catalog items in the source.
For term occurrence notifications, you are notified every time the term is detected on catalog items or attributes.
-
-
-
Select Include manually added terms to be notified when a term is manually applied to a catalog item or attribute.
-
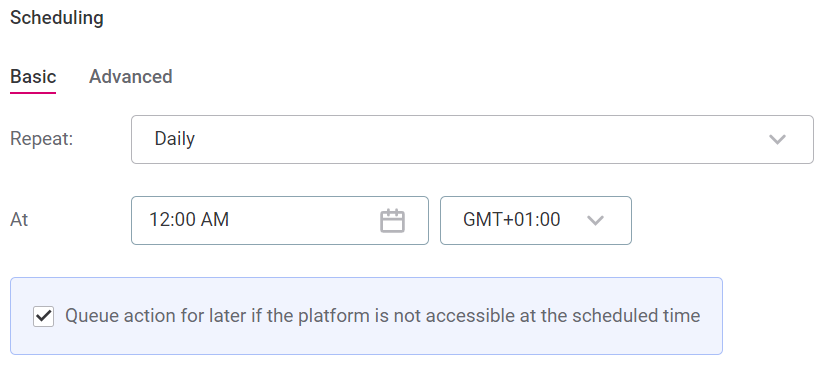
Set up Scheduling using either basic or advanced settings:
-
If you select Basic:
-
In Repeat, select the intervals at which you would like the monitoring to be run.
-
Select the time, day, and date required. How many of these options are applicable depends on the interval selected.
-
Select the time zone.
-
Use the checkbox to queue the checks if the system is unavailable at the scheduled time.
-
-
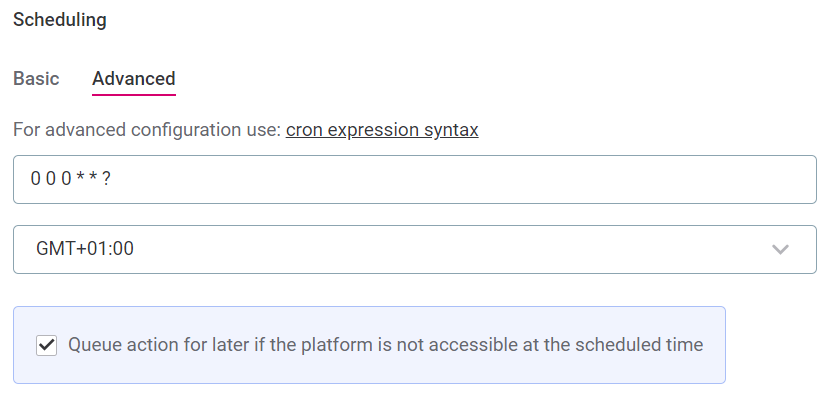
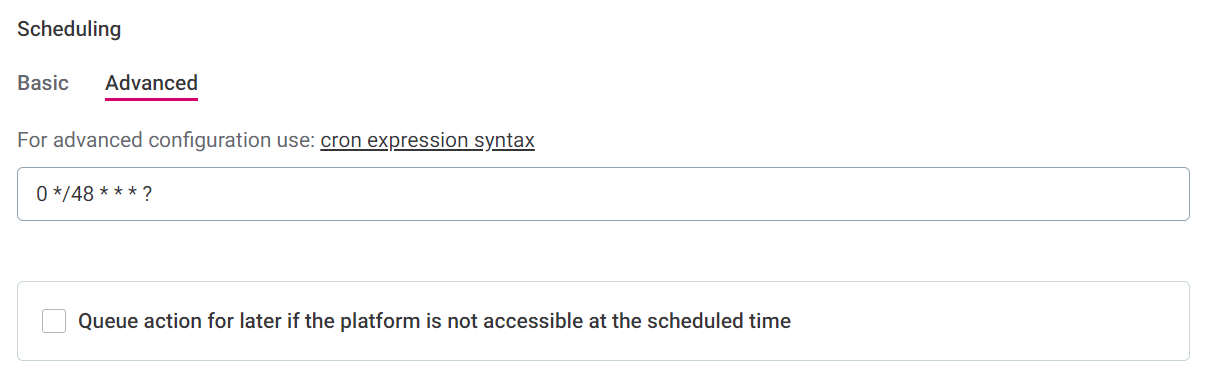
If you select Advanced:
-
Define the schedule using Cron expression syntax.
-
Select the time zone.
-
Use the checkbox to queue the checks if the system is unavailable at the scheduled time.
-
-
Configure data freshness checks
Freshness checks look at the metadata of a catalog item to see when it was last updated.
Where this information is drawn from differs depending on data source. By default, data freshness checks can work with Snowflake, BigQuery, PostgreSQL, and Oracle.
It is possible to add custom configuration for other data sources by providing additional details on where the freshness information can be found (according to the instructions in Data Freshness Custom Configuration), but this is an experimental feature and upgradability cannot be guaranteed.
|
PostgreSQL and Oracle require some action on the database side before freshness can function. See Additional configuration for PostgreSQL and Oracle. |
The time of last update is checked against the thresholds set manually or by AI, and you are notified when data is not up-to-date. In the dashboard you can see information such as: the number of missing updates, the time between the last update and the last check, the expected time between updates, and the detection type (AI or manual).
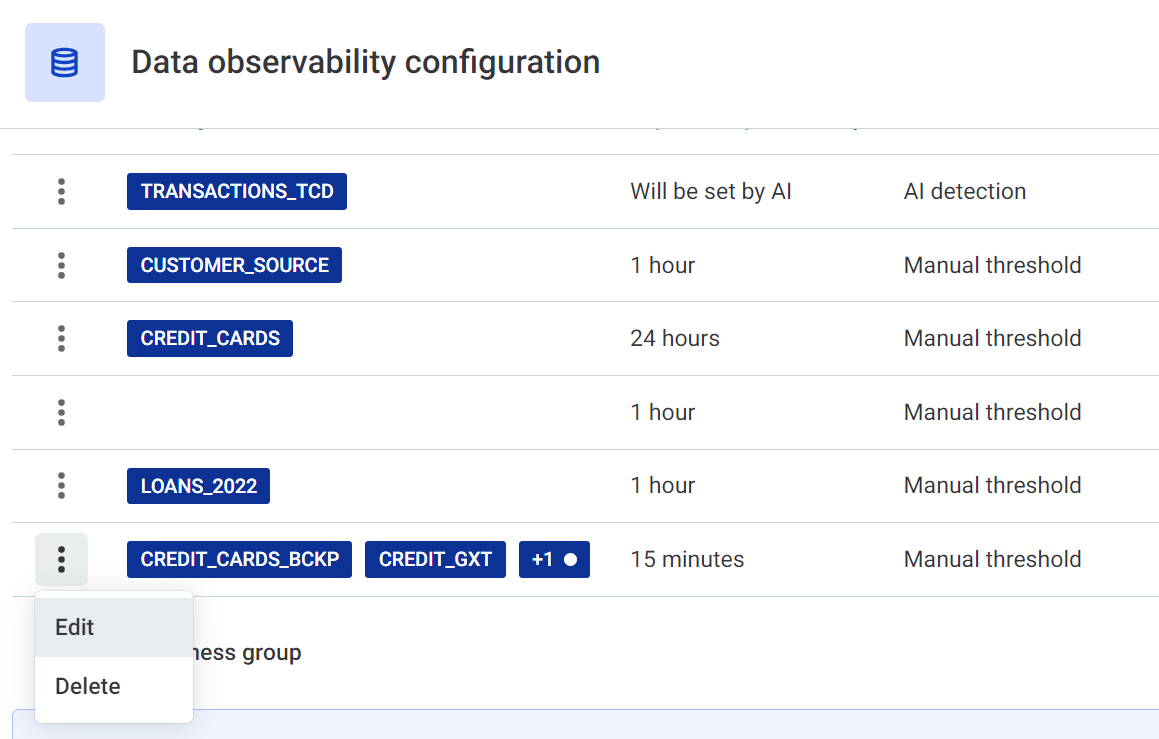
| You can configure multiple freshness groups in order to check different data against different expected update times. Freshness groups can be single items or groups of items. |
-
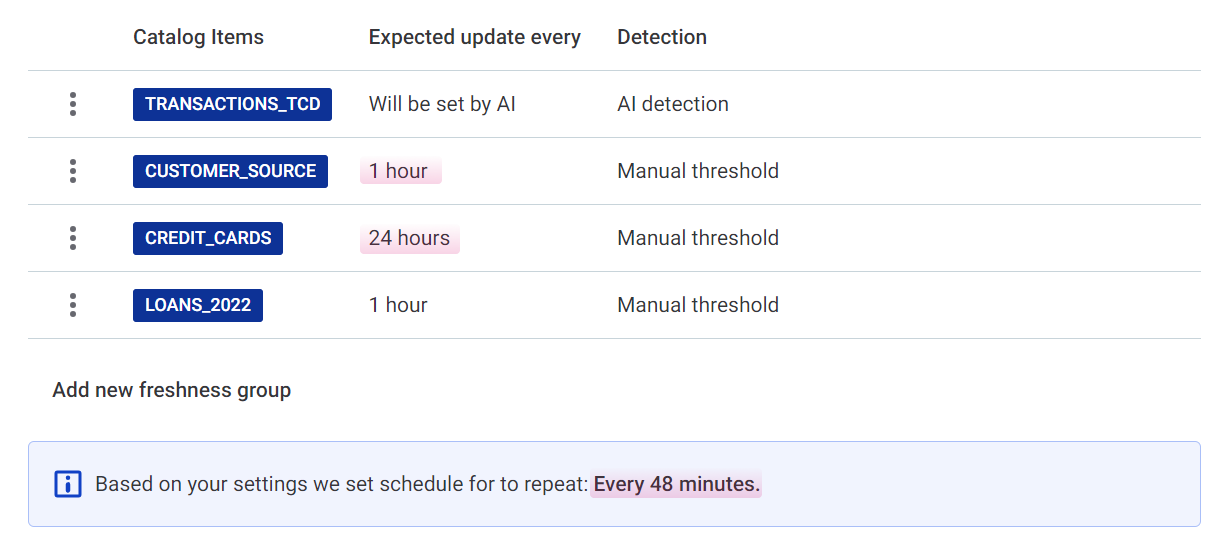
To add your first freshness group, select Set Freshness, or, if you already have freshness groups configured, add a new group by selecting Add new freshness group.
-
Specify how you want to select which data undergoes freshness checks:
SQL catalog items and VCIs are not available here for selection as they do not support freshness checks. 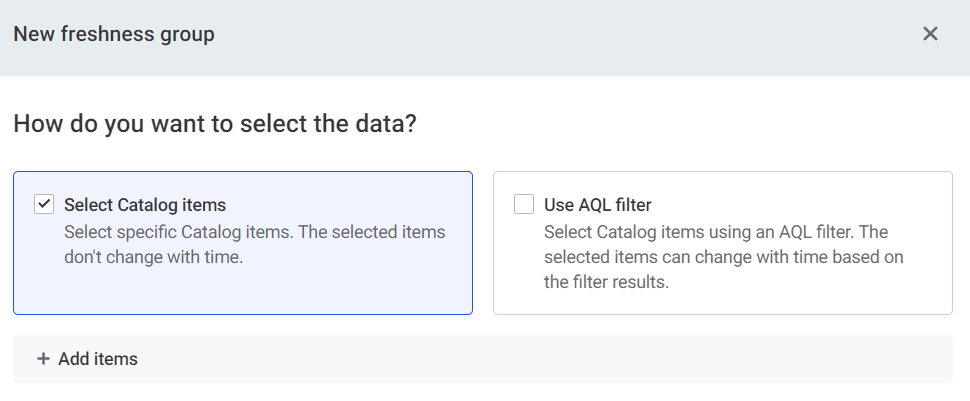
-
Select Catalog items: Manually select items from the list available.
-
Use AQL filter: Select items using AQL expression. Select Preview to check which items are selected as a result of your condition.
Using AQL filter instead of manual selection means that new items added to the data source are included in freshness checks if they satisfy the filter conditions.
-
-
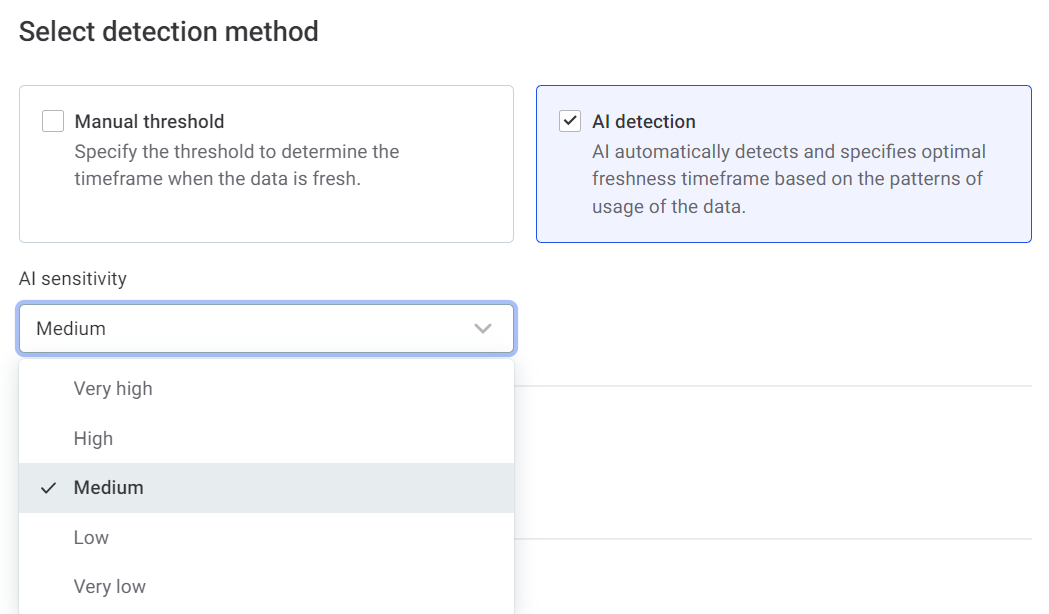
Select detection method:
-
Manual threshold: In this case, specify how often you expect the data in this freshness group to be updated.
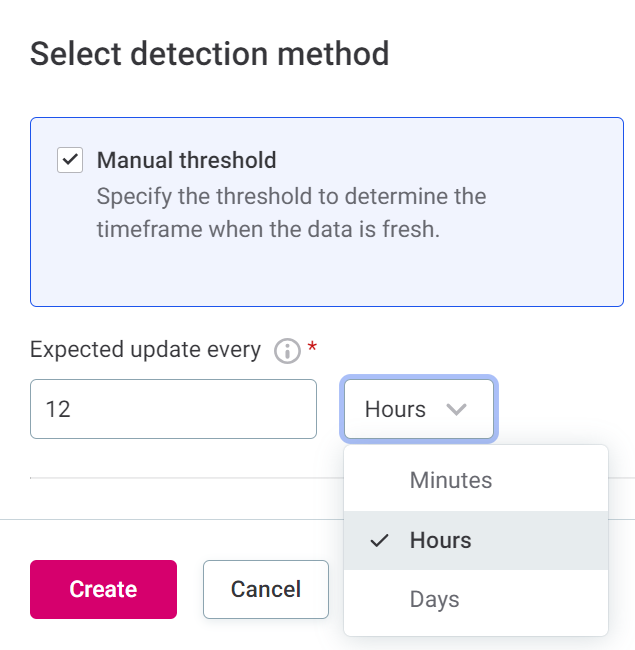
-
AI detection: In this case, specify how sensitive you would like the AI detection to be.
The options are: very low, low, medium, high, and very high. The higher the sensitivity, the lower the variation from the expected update time that is tolerated.
The sensitivity levels in this context correlate to the following number of standard deviations from what the model identifies as the expected update time frame:
-
Very low: 4.5.
-
Low: 4.0.
-
Medium: 3.5.
-
High: 3.0.
-
Very high: 2.5.
The Freshness Anomaly detection algorithm requires a certain amount of information before it can specify the expected update schedule. As a rule of thumb, this is at least seven updates.
Until this time, it is considered to be in the learning phase and is not able to notify you about missing updates.
-
-
-
Select when you want issues to be created:
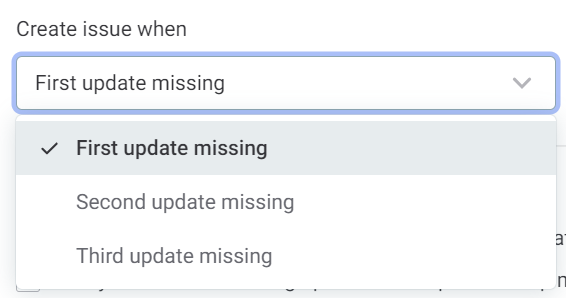
-
First update missing: An issue is created the first time the data is not updated at the expected time, and will be visible in the table of issues.
-
Second update missing: An issue is created the second time the data is not updated at the expected time.
-
Third update missing: An issue is created the third time the data is not updated at the expected time.
-
-
Select the scenarios in which you want to receive notifications:
-
Notify me when a previously missing update is received for a catalog item: You are notified when updated information that was previously missing has been received.
-
Notify me about all consecutive missing updates: You are notified about the initial missing update according to the settings above, and all consecutive missing updates. Note that this could result in a large number of notifications.
-
-
Select Create.
Use the three dots menu to edit or delete freshness groups.
-
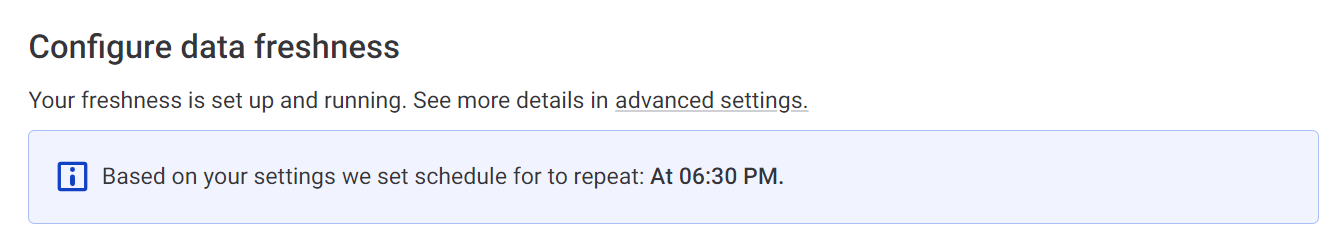
Scheduling is populated according to the update settings for the freshness groups. It is not necessary to take any action.
You can manually override the schedule if it does not suit you (for example, if it is too frequent and performance heavy), but note that if you then alter the freshness group, a new schedule is generated again.
The schedule is set according to the group with the shortest update windows.
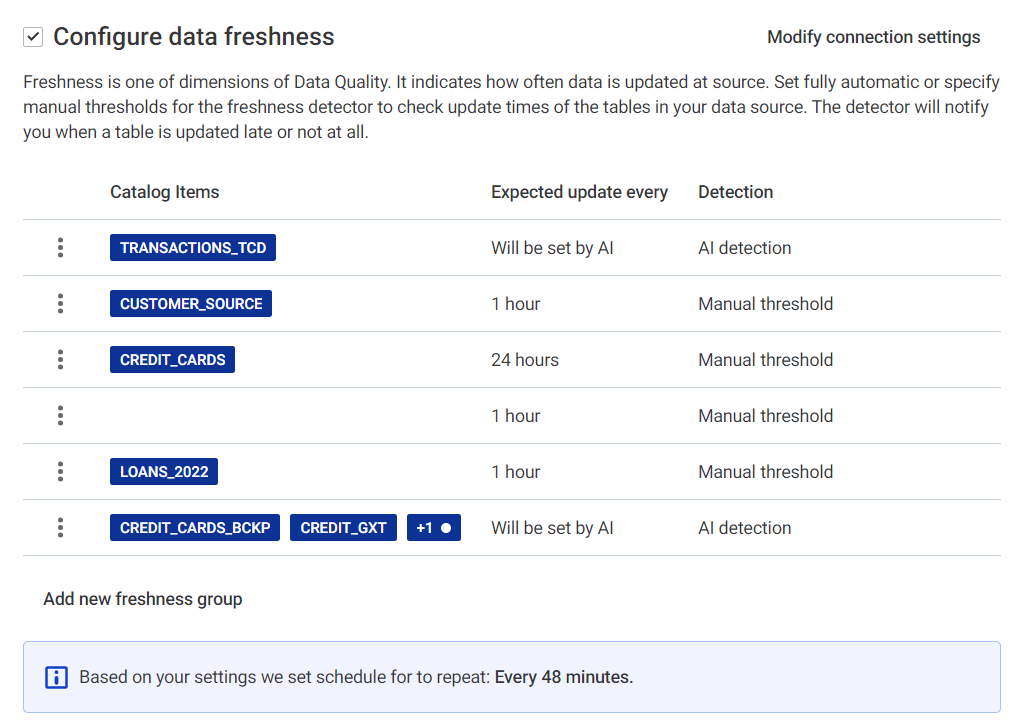
You can notice that the repeat intervals don’t match the specified expected update intervals. For example, if you specified that you expect updates every hour, the schedule might be set to run every 48 minutes.
This is to allow for processing time and make sure the update is not missed.
-
Use the checkbox to queue the checks if the system is unavailable at the scheduled time.
| For freshness checks, one job is created per connection. If all selected catalog items are from a single connection, this means only one processing job is created. |
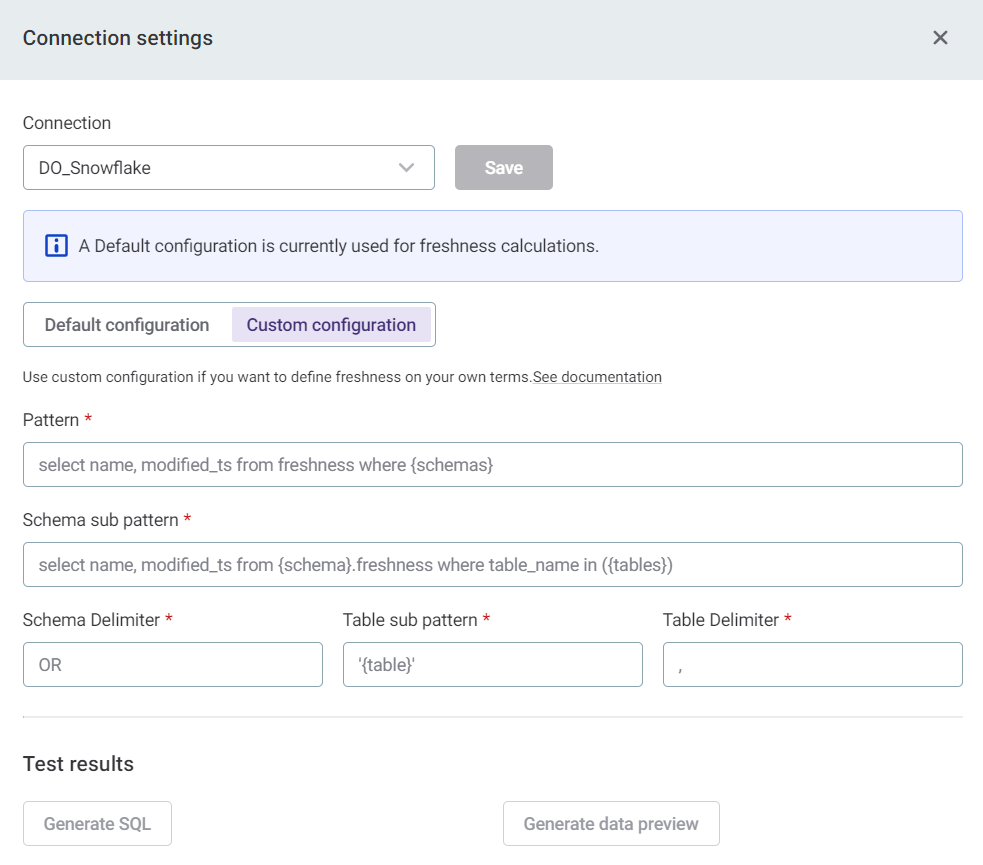
Modify connection settings (optional)
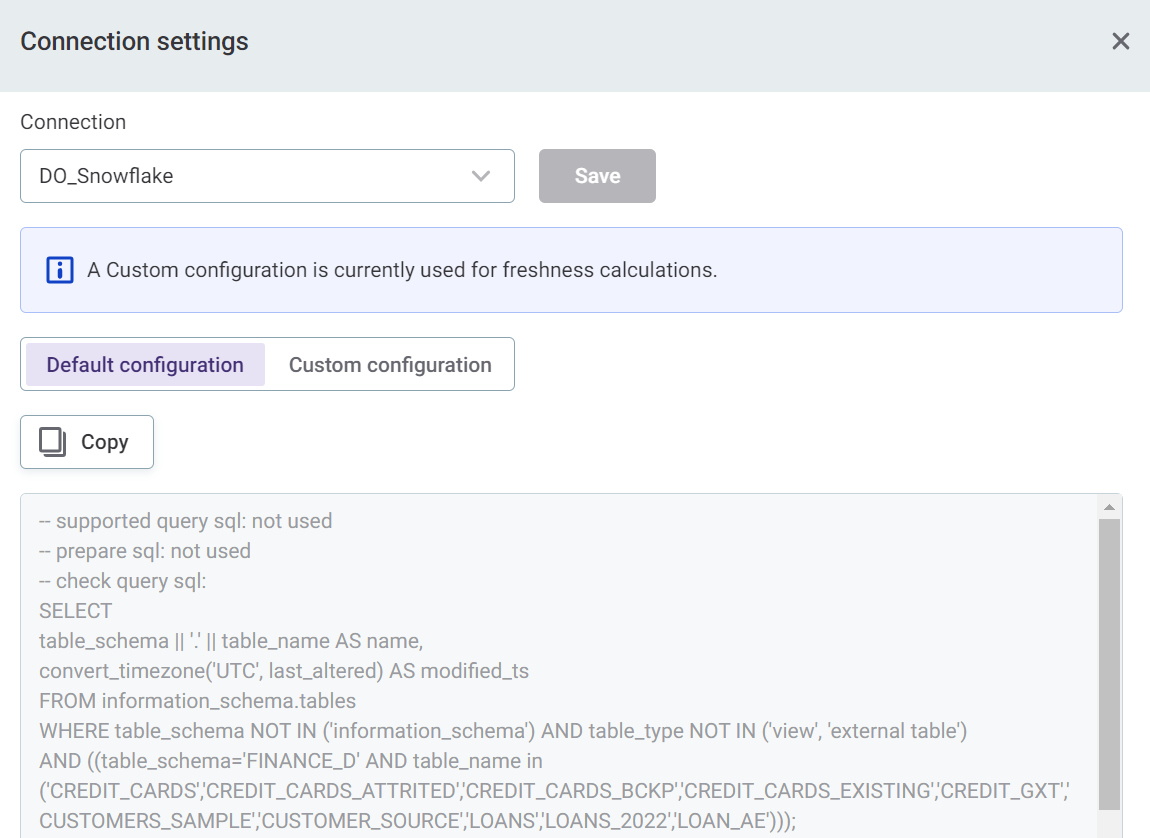
For the sources that support freshness by default (Snowflake, PostgreSQL, BigQuery, and Oracle), it is not necessary to modify connection settings unless you want to, for example, if you have a custom definition for freshness within the database.
If you do have a custom freshness definition, or want to check freshness on items in databases which are not supported, it is possible to add additional configuration by selecting Modify connections settings. See Data Freshness Custom Configuration for more information.
|
If the Default configuration tab is selected, you can view and copy the configuration to use elsewhere (optional).
|
Data without selected terms
Adjust processing settings for additional checks for unselected catalog items:
-
Specify whether Business term detection is active. If this option is turned on, terms can be added when appropriate on any new catalog items.
If terms selected for monitoring are added to new items, the system knows to run the additional checks on these items.
-
If business term detection is active, you can also enable notifications.
You can either use the same notification settings as on the selected data (by selecting the option) or define new notification settings according to the following steps:
-
Select Send me notifications. You can be notified in the following instances:
-
Selected term is detected — When selected terms from the glossary are detected in this source for the first time.
Use Add Term to select the terms you’d like to be notified about.
-
Any new term is detected — When any term is detected on the source for the first time.
For term notifications, you are only notified the first time the term is detected. -
Selected occurrence is detected — When selected terms from the glossary are detected on catalog items in the source.
Use Add Term to select the terms you’d like to be notified about.
-
Any new term occurrence is detected — When any term is newly detected on catalog items in the source.
For term occurrence notifications, you are notified every time the term is detected on catalog items or attributes.
-
-
Select Include manually added terms to be notified when a term is manually applied to a catalog item or attribute.
-
-
-
Set up Scheduling using either basic or advanced settings:
-
If you select Basic:
-
In Repeat, select the intervals at which you would like the monitoring to be run.
-
Select the time, day, and date required. How many of these options are applicable depends on the interval selected.
-
Select the time zone.
-
Use the checkbox to queue the checks if the system is unavailable at the scheduled time.
-
-
If you select Advanced:
-
Define the schedule using Cron expression syntax.
-
Select the time zone.
-
Use the checkbox to queue the checks if the system is unavailable at the scheduled time.
-
-
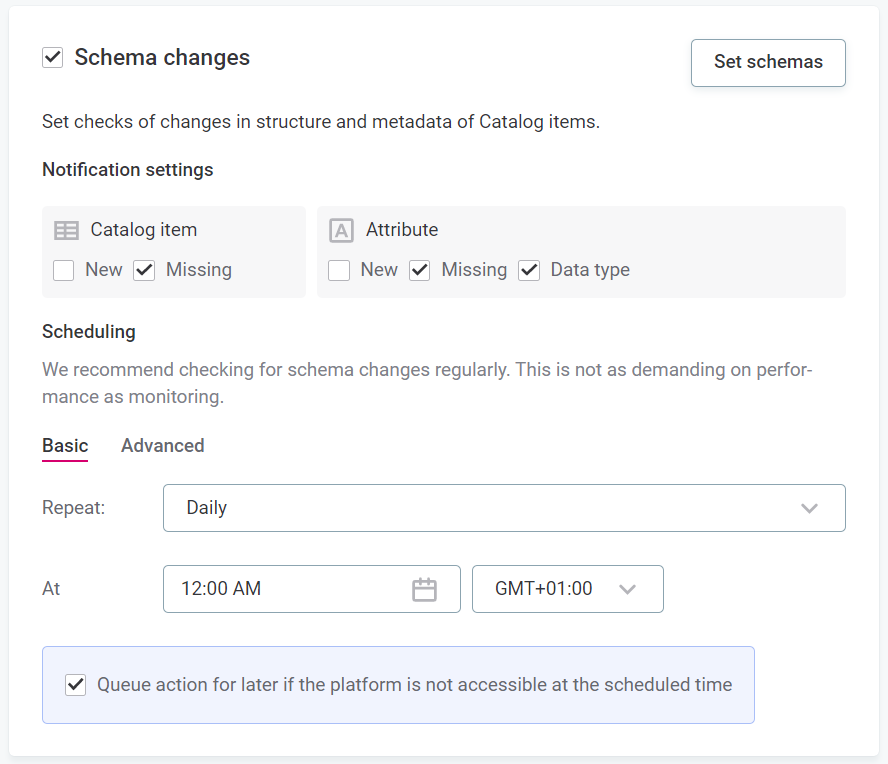
Schema changes
Be notified of any changes in the structure of metadata, such as missing columns or changes in data type.
Note that:
-
VCIs are not included in schema change checks.
-
On S3 sources, schema change detection runs on the entire source and you cannot select individual objects or parts of S3 buckets.
-
Select Set schemas to monitor changes in additional schemas which have not been imported into catalog.
-
Specify whether Schema changes are active. If this option is turned on, you are notified about changes in the data structure according to the following settings.
In addition to not receiving notifications for the options not selected here, they will not be displayed as issues on the data observability dashboard. However, they will count towards the overall schema change statistics. -
Table:
-
New: You are notified if new tables are detected.
-
Missing: You are notified if missing tables are detected.
-
-
Column:
-
New: You are notified if new columns are detected.
-
Missing: You are notified if missing columns are detected.
-
Data type: You are notified if column data type changes.
-
-
-
Set up Scheduling using either basic or advanced settings:
-
If you select Basic:
-
In Repeat, select the intervals at which you would like the monitoring to be run.
-
Select the time, day, and date required. How many of these options are applicable depends on the interval selected.
-
Select the time zone.
-
Use the checkbox to queue the checks if the system is unavailable at the scheduled time.
-
-
If you select Advanced:
-
Define the schedule using Cron expression syntax.
-
Select the time zone.
-
Use the checkbox to queue the checks if the system is unavailable at the scheduled time.
-
-
Notifications
Select how you would like to be notified. You can select more than one option: select all that apply.
-
In-app: Select groups or roles.
-
Email
-
Slack: Enter the channel name.
If ONE is not connected to Slack, you can connect to your workspace in general settings. For instructions, see Slack Integration. -
Microsoft Teams (see MS Teams Integration).
Was this page useful?