
Run Profiling
After you connect to a data source, start understanding your data better by running data discovery on the source or profiling a particular catalog item.
Sample vs. full profiling: What’s the difference?
The following are the default options available for profiling:
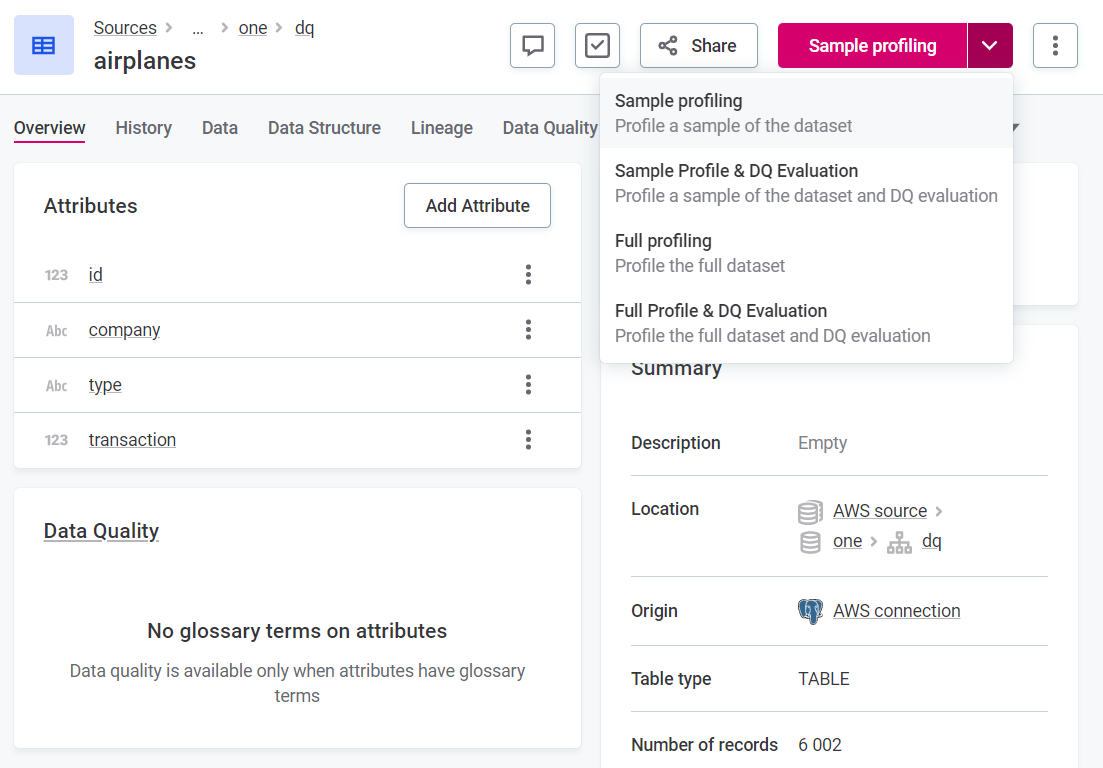
- Sample profiling
-
Analyzes a small sample of records from the selected catalog item as quickly as possible, in a performance-friendly way. This means calculating statistics, determining patterns, masks, and frequencies in your data, as well as applying rule and pattern-based domain detection to identify business domains.
By default, samples are 1% of your records, or at most 10,000 records, whichever is lower. - Sample profile & DQ evaluation
-
Runs sample profiling followed by DQ evaluation on the full catalog item.
By default, samples are 1% of your records, or at most 1,000,000 records, whichever is lower. - Full profiling
-
Processes all records of the selected catalog item. This type of profiling also includes anomaly detection, which helps identify potential irregularities or corruptions in your data.
- Full profile & DQ evaluation
-
Runs full profiling followed by DQ evaluation.
By default, all profiling options also run on partitions.
You can customize the default profiling configurations as needed, or create a custom one (see Configure Profiling).
Due to the limited benefit of using pushdown processing for small samples, sample profiling always runs on Ataccama DPEs, even if pushdown processing is configured.
| If you run manual profiling on catalog items that are included in monitoring projects, any detected anomalies will also be visible in the monitoring project results. |
|
We do not recommend making changes to technical (imported) catalog item metadata after it’s been profiled. If attributes (or tables) are renamed, modified, or removed, subsequent profiling attempts might fail. However, if such changes are required, first delete the catalog item and all the related objects, such as monitoring projects, then reimport the data and run profiling again. You can freely edit non-imported metadata like descriptions, stewardship, and relationships. |
| Profiling is not supported for binary data types (such as BLOB, BINARY, VARBINARY). Actions on these attributes might complete but won’t produce meaningful results. |
Run profiling
To run profiling on an ad hoc basis:
A single catalog item
-
In Data Catalog > Catalog Items, select the required catalog item (or attribute), and from the profiling menu, select the profiling you want to run.
Multiple catalog items
-
In Data Catalog > Catalog Items, select the required catalog items from the list, and in the ribbon that appears, select the profiling you want to run.
If the catalog items you want to analyze come from the same source, you can filter them out of the list using the Data Source and Location filters. 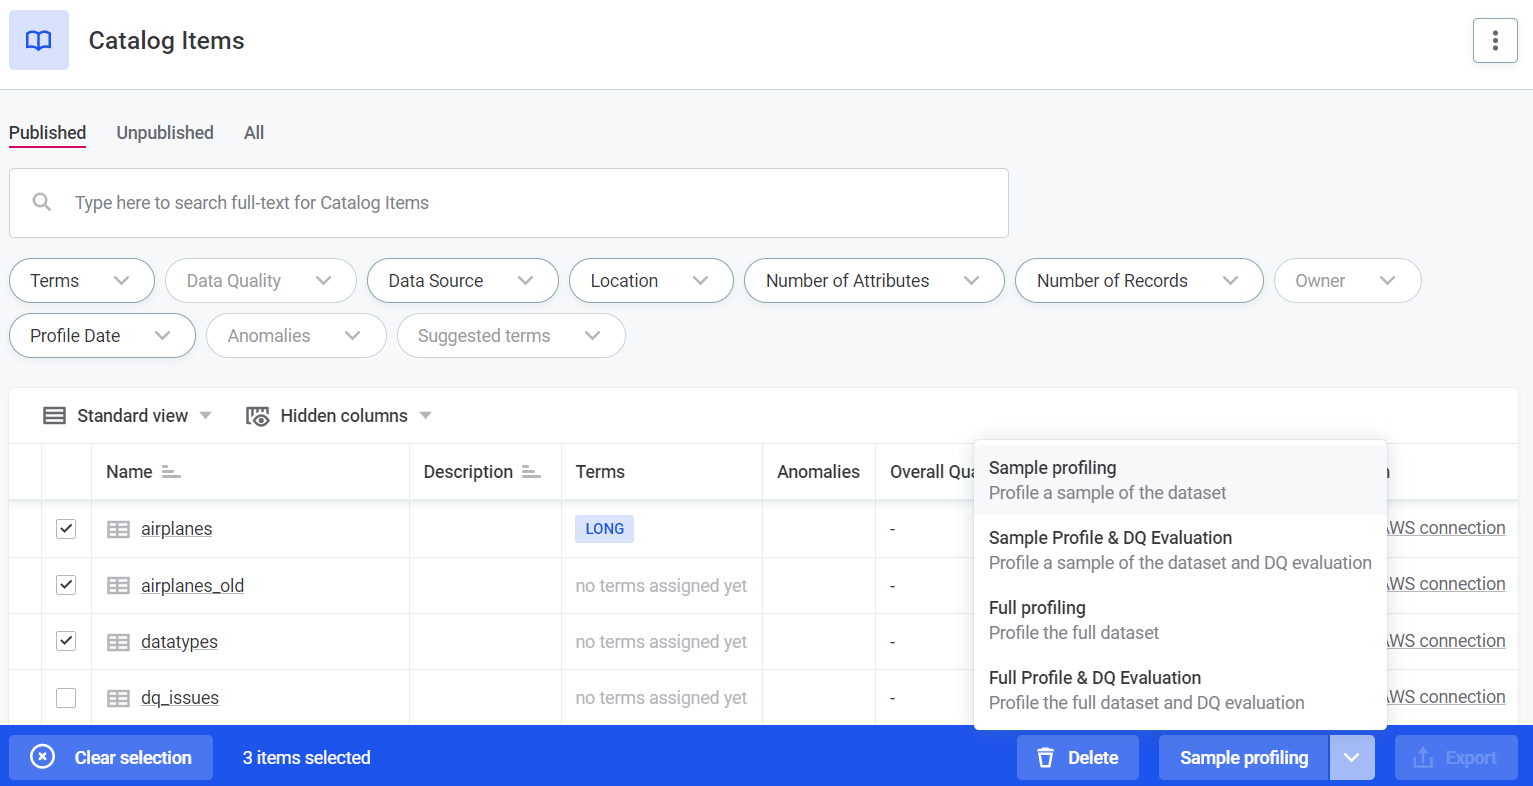
Profiling first imports the catalog item metadata, then processes the data. To track the progress, use the Processing Center. See Monitor profiling progress.
If the profiling was successful, navigate to the Profile & DQ insights tab of the relevant catalog item to see the results.
Profiling on partitions
| Profiling on partitions is supported only for metastore sources. To work with partitions using SQL catalog items, partitioning should be done in the query directly. |
When working with data sources with partitioned tables, there are additional profiling configurations:
-
<Profiling configuration> of the last partition - Profile the last partition only.
Last partition refers to the last partition in the full list of partitions, sorted in descending order. -
<Profiling configuration> of custom partition - Profile a partition of your choice.
-
<Profiling configuration> - Profile catalog item records regardless of partitions.
The <Profiling configuration> refers to any of the available profiling configurations.
Schedule profiling
To run profiling following a particular schedule:
-
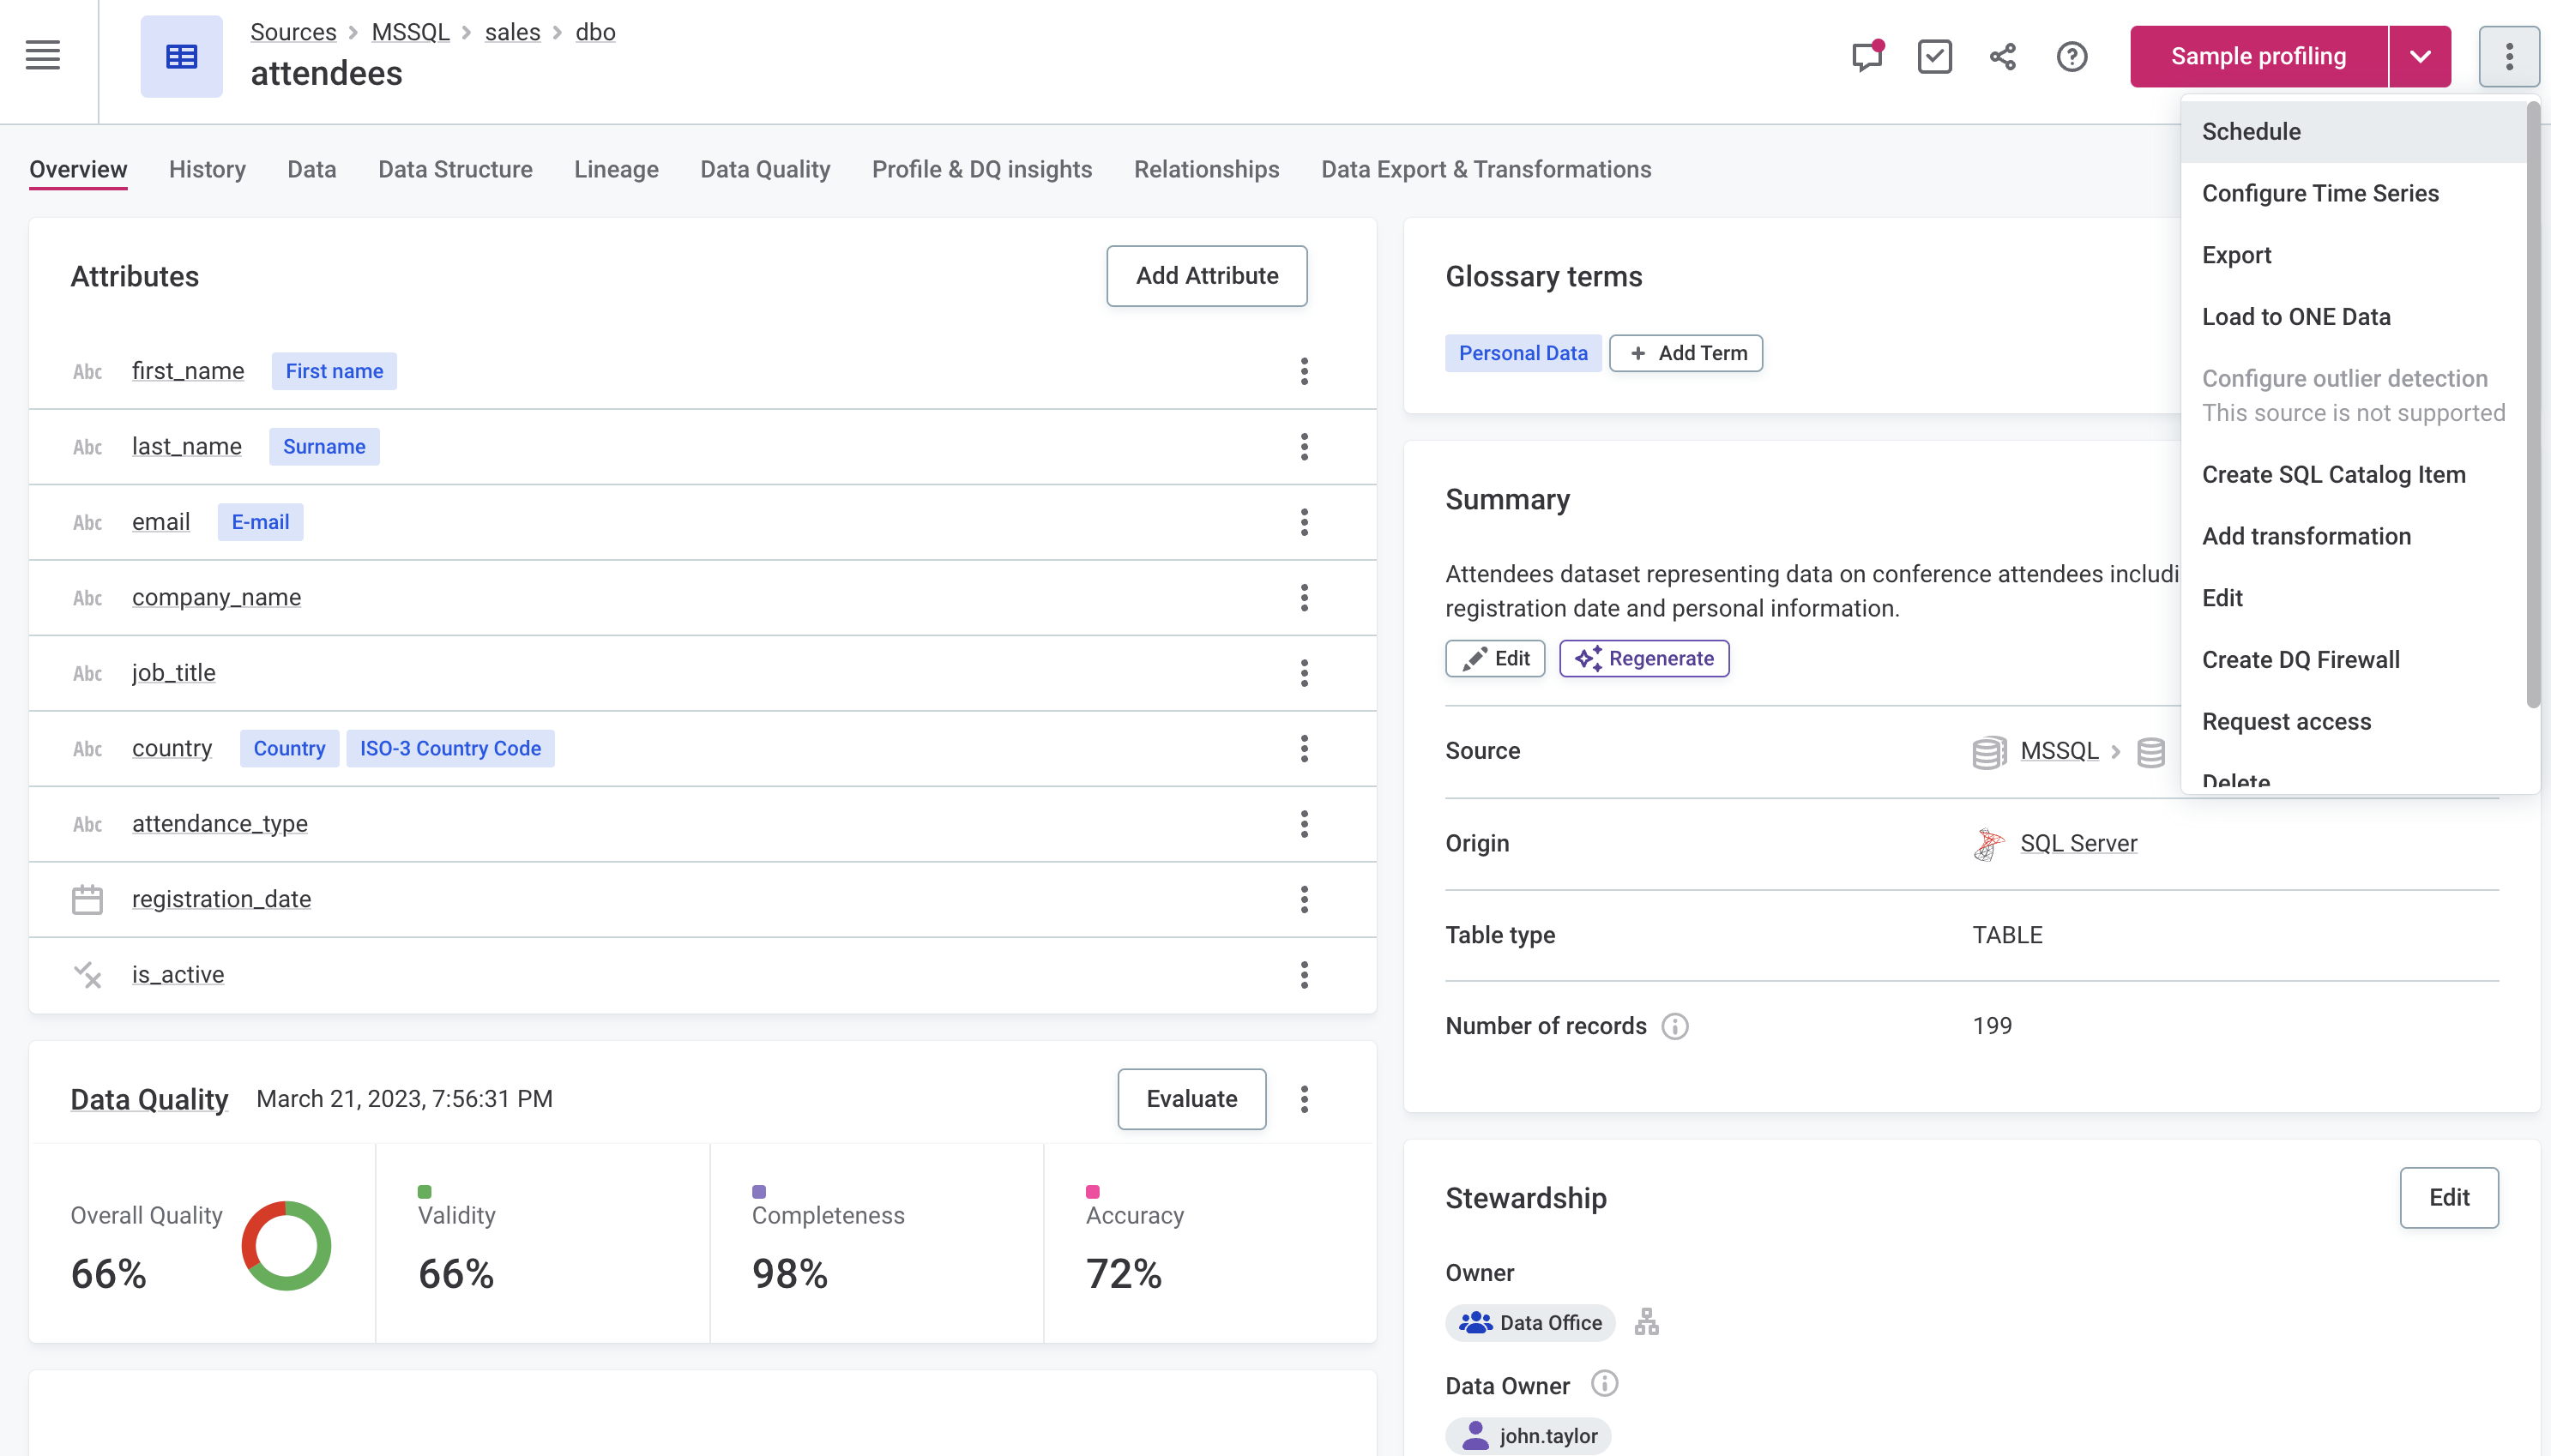
In Data Catalog > Catalog Items, select the required catalog item, and in the three dots menu select Schedule.
-
Select Add Scheduled Event.
-
Configure the following:
-
In Type, select Profiling Schedule.
-
If there are partitions, select which partitions to profile in Partition.
-
In Configuration, select from the available profiling configurations (full, sample, or custom).
-
-
Define the schedule using either Basic or Advanced configuration:
-
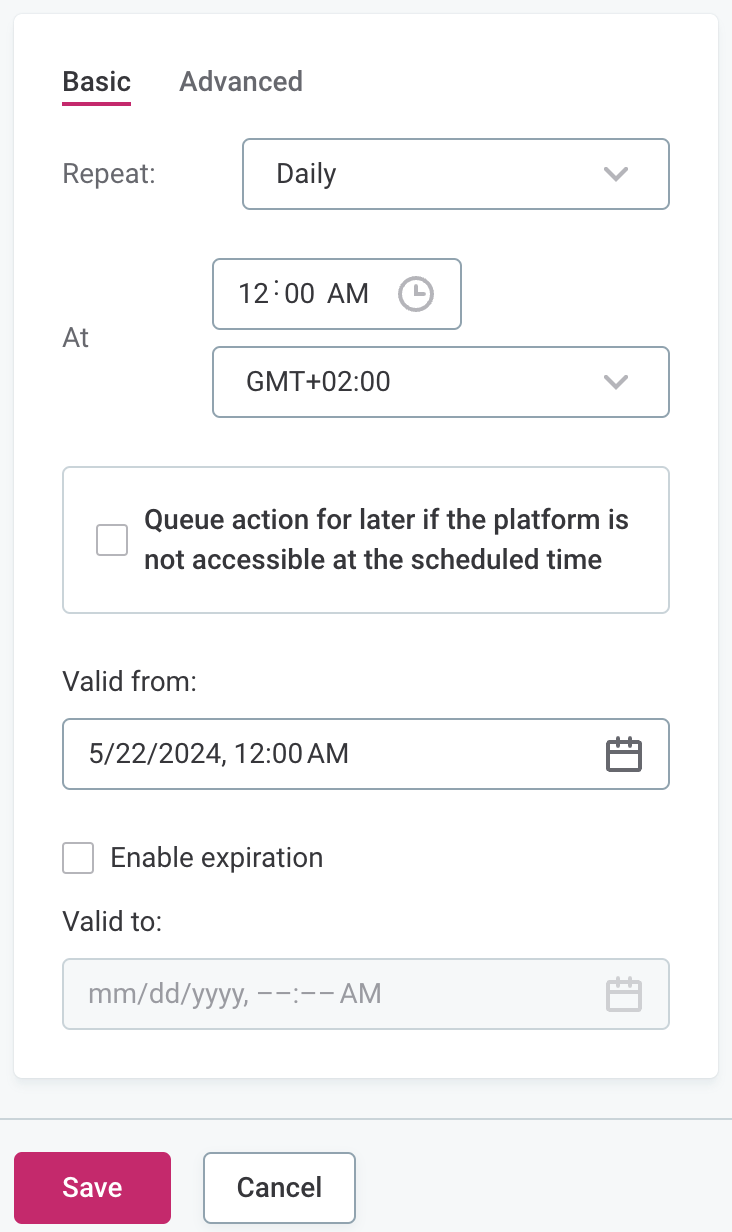
For Basic configuration:
-
In Repeat, select from the list of options how often profiling should run.
-
In At, specify the time (24-hour clock) at which the profiling should be run, and select from the list of available time zones.
-
If required, select Queue action for later if the platform is not accessible at the scheduled time.
-
In Valid from, define the date from which the schedule should be followed.
-
If the schedule should have a finite end date, select Enable expiration and in Valid to define the date at which the schedule should no longer be effective.
-
-
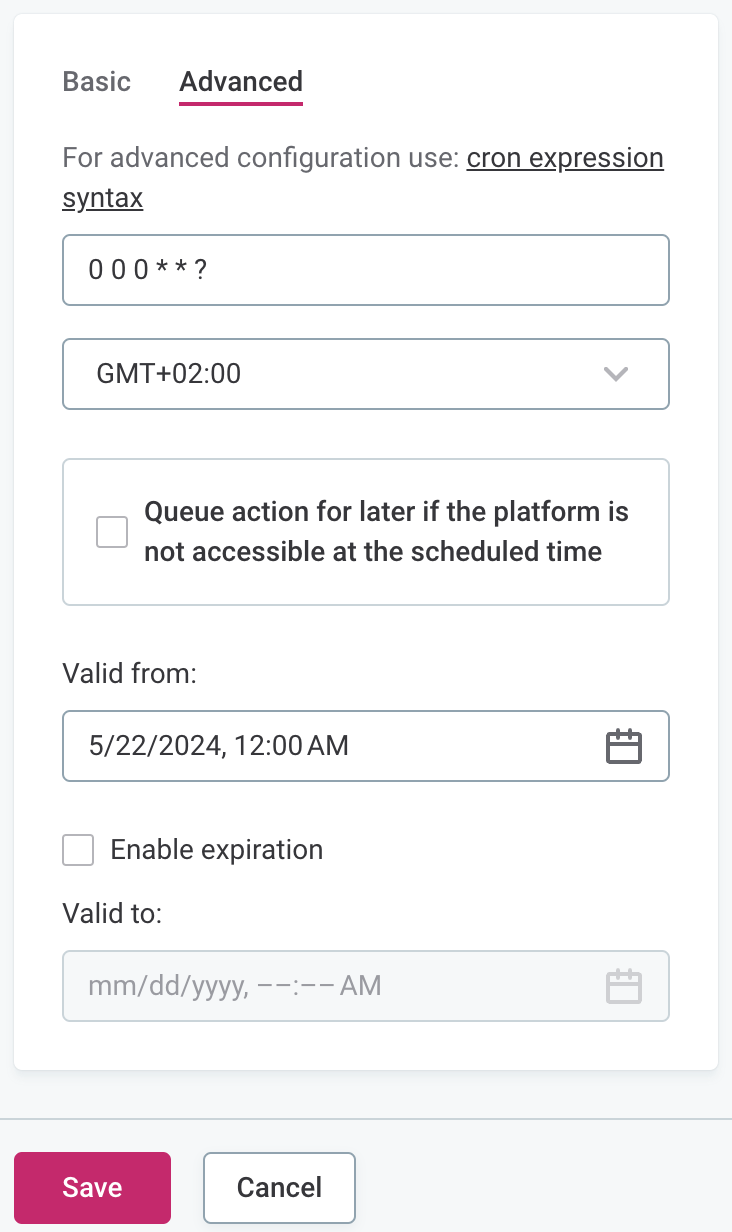
For Advanced configuration:
-
Set the schedule using Cron expression syntax. For more information, see Cron Expression Generator and Explainer.
-
In Valid from, define the date from which the schedule should be followed.
-
If the schedule should have a finite end date, select Enable expiration and in Valid to define the date at which the schedule should no longer be effective.
-
-
-
Select Save and publish your changes.
You can see the scheduled jobs in the Processing center under Scheduled jobs.
Edit scheduled event
To edit, pause, or delete the scheduled event, select the required catalog item, and in the three dots menu select Schedule. In the three dots menu for the event you want to modify, select the appropriate action:
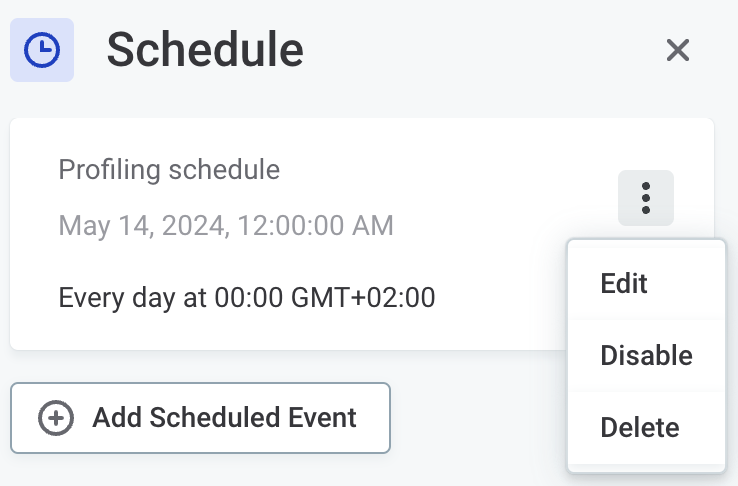
If an event is enabled, you can see the next date and time when it will be executed.
Next steps
Monitor profiling progress
When you run metadata import or profiling, ONE starts the following jobs for each profiled catalog items, depending on your profiling configuration: Metadata import, Metadata classification, Profiling, Anomaly detection (Full profiling only), and DQ Evaluation of catalog item (Profiling with DQ eval only) jobs.
More information about these jobs can be viewed at any time in the Processing Center.
Monitor job status
To monitor the job status, select the Processing Center icon in the main navigation menu to open the Processing Center notifications view.
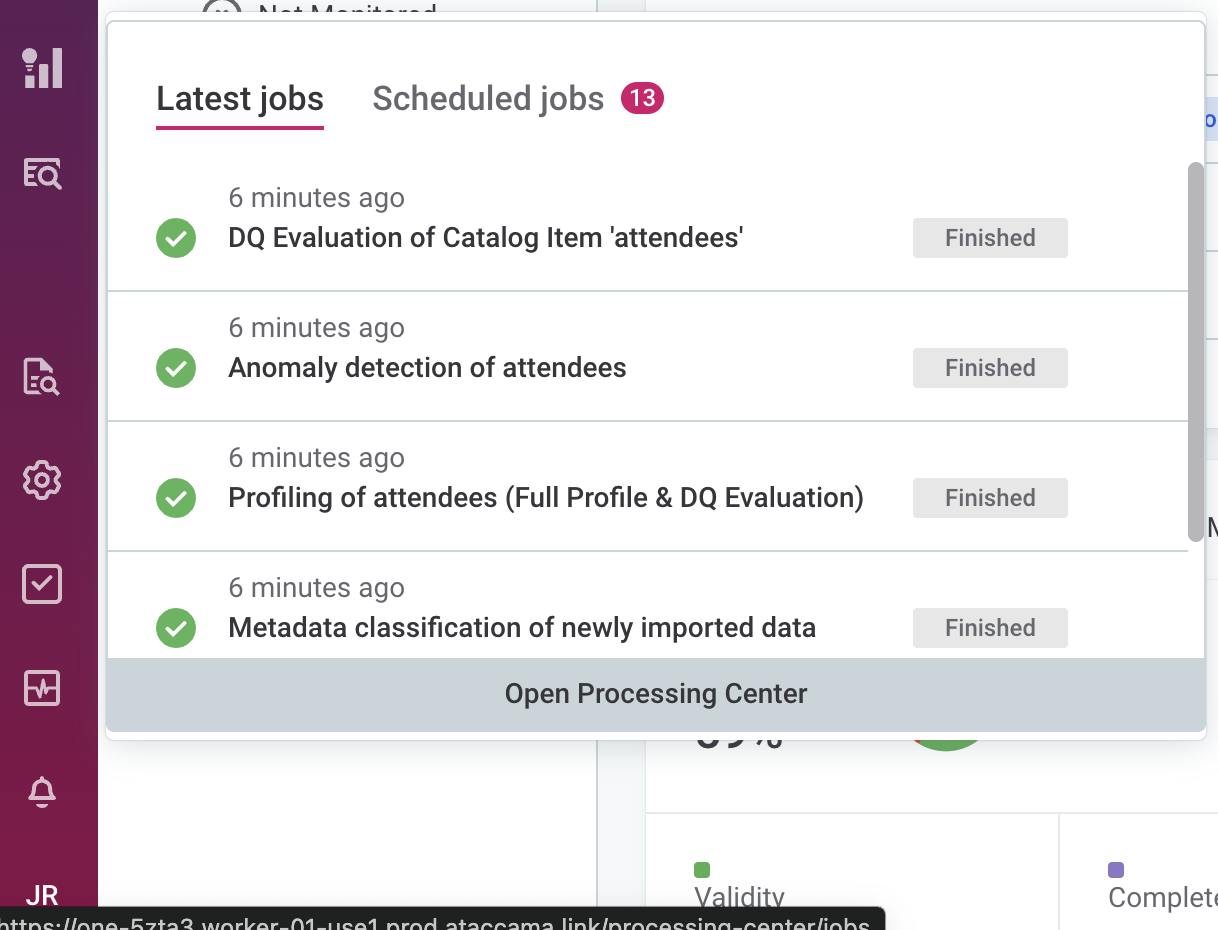
Once the job is successfully completed, its Status changes from RUNNING to FINISHED.
Otherwise, the status is updated to FAILED and an error message is provided.
To view the job results, select the job directly from the notifications list.
View job details
To see the job details, select Processing Center from the left navigation menu and then Open Processing Center under the list of notifications.
From the Base jobs menu, select the job type and locate your job.
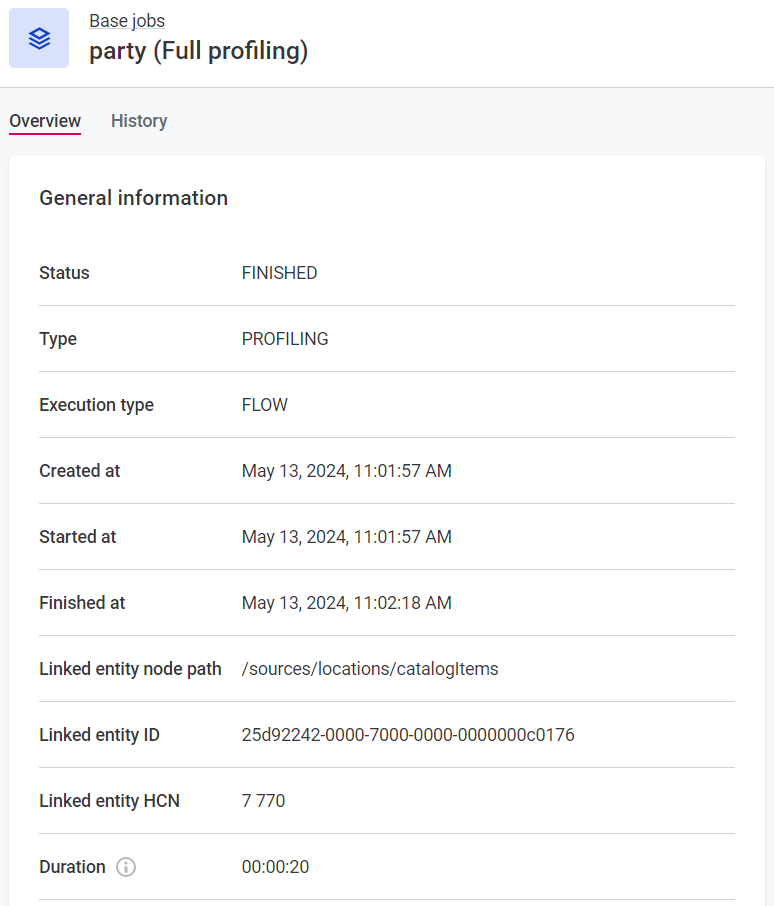
If the job was started as part of a documentation flow, its Execution type is FLOW.
For manually initiated jobs, the type is MANUAL.
View profiling results
Open the catalog item Profile & DQ insights tab to learn more about the state of your data and decide on the next steps for improving the data quality. For details, see Understand Profiling Results.
Troubleshooting
Profiling jobs failing with missing lookup
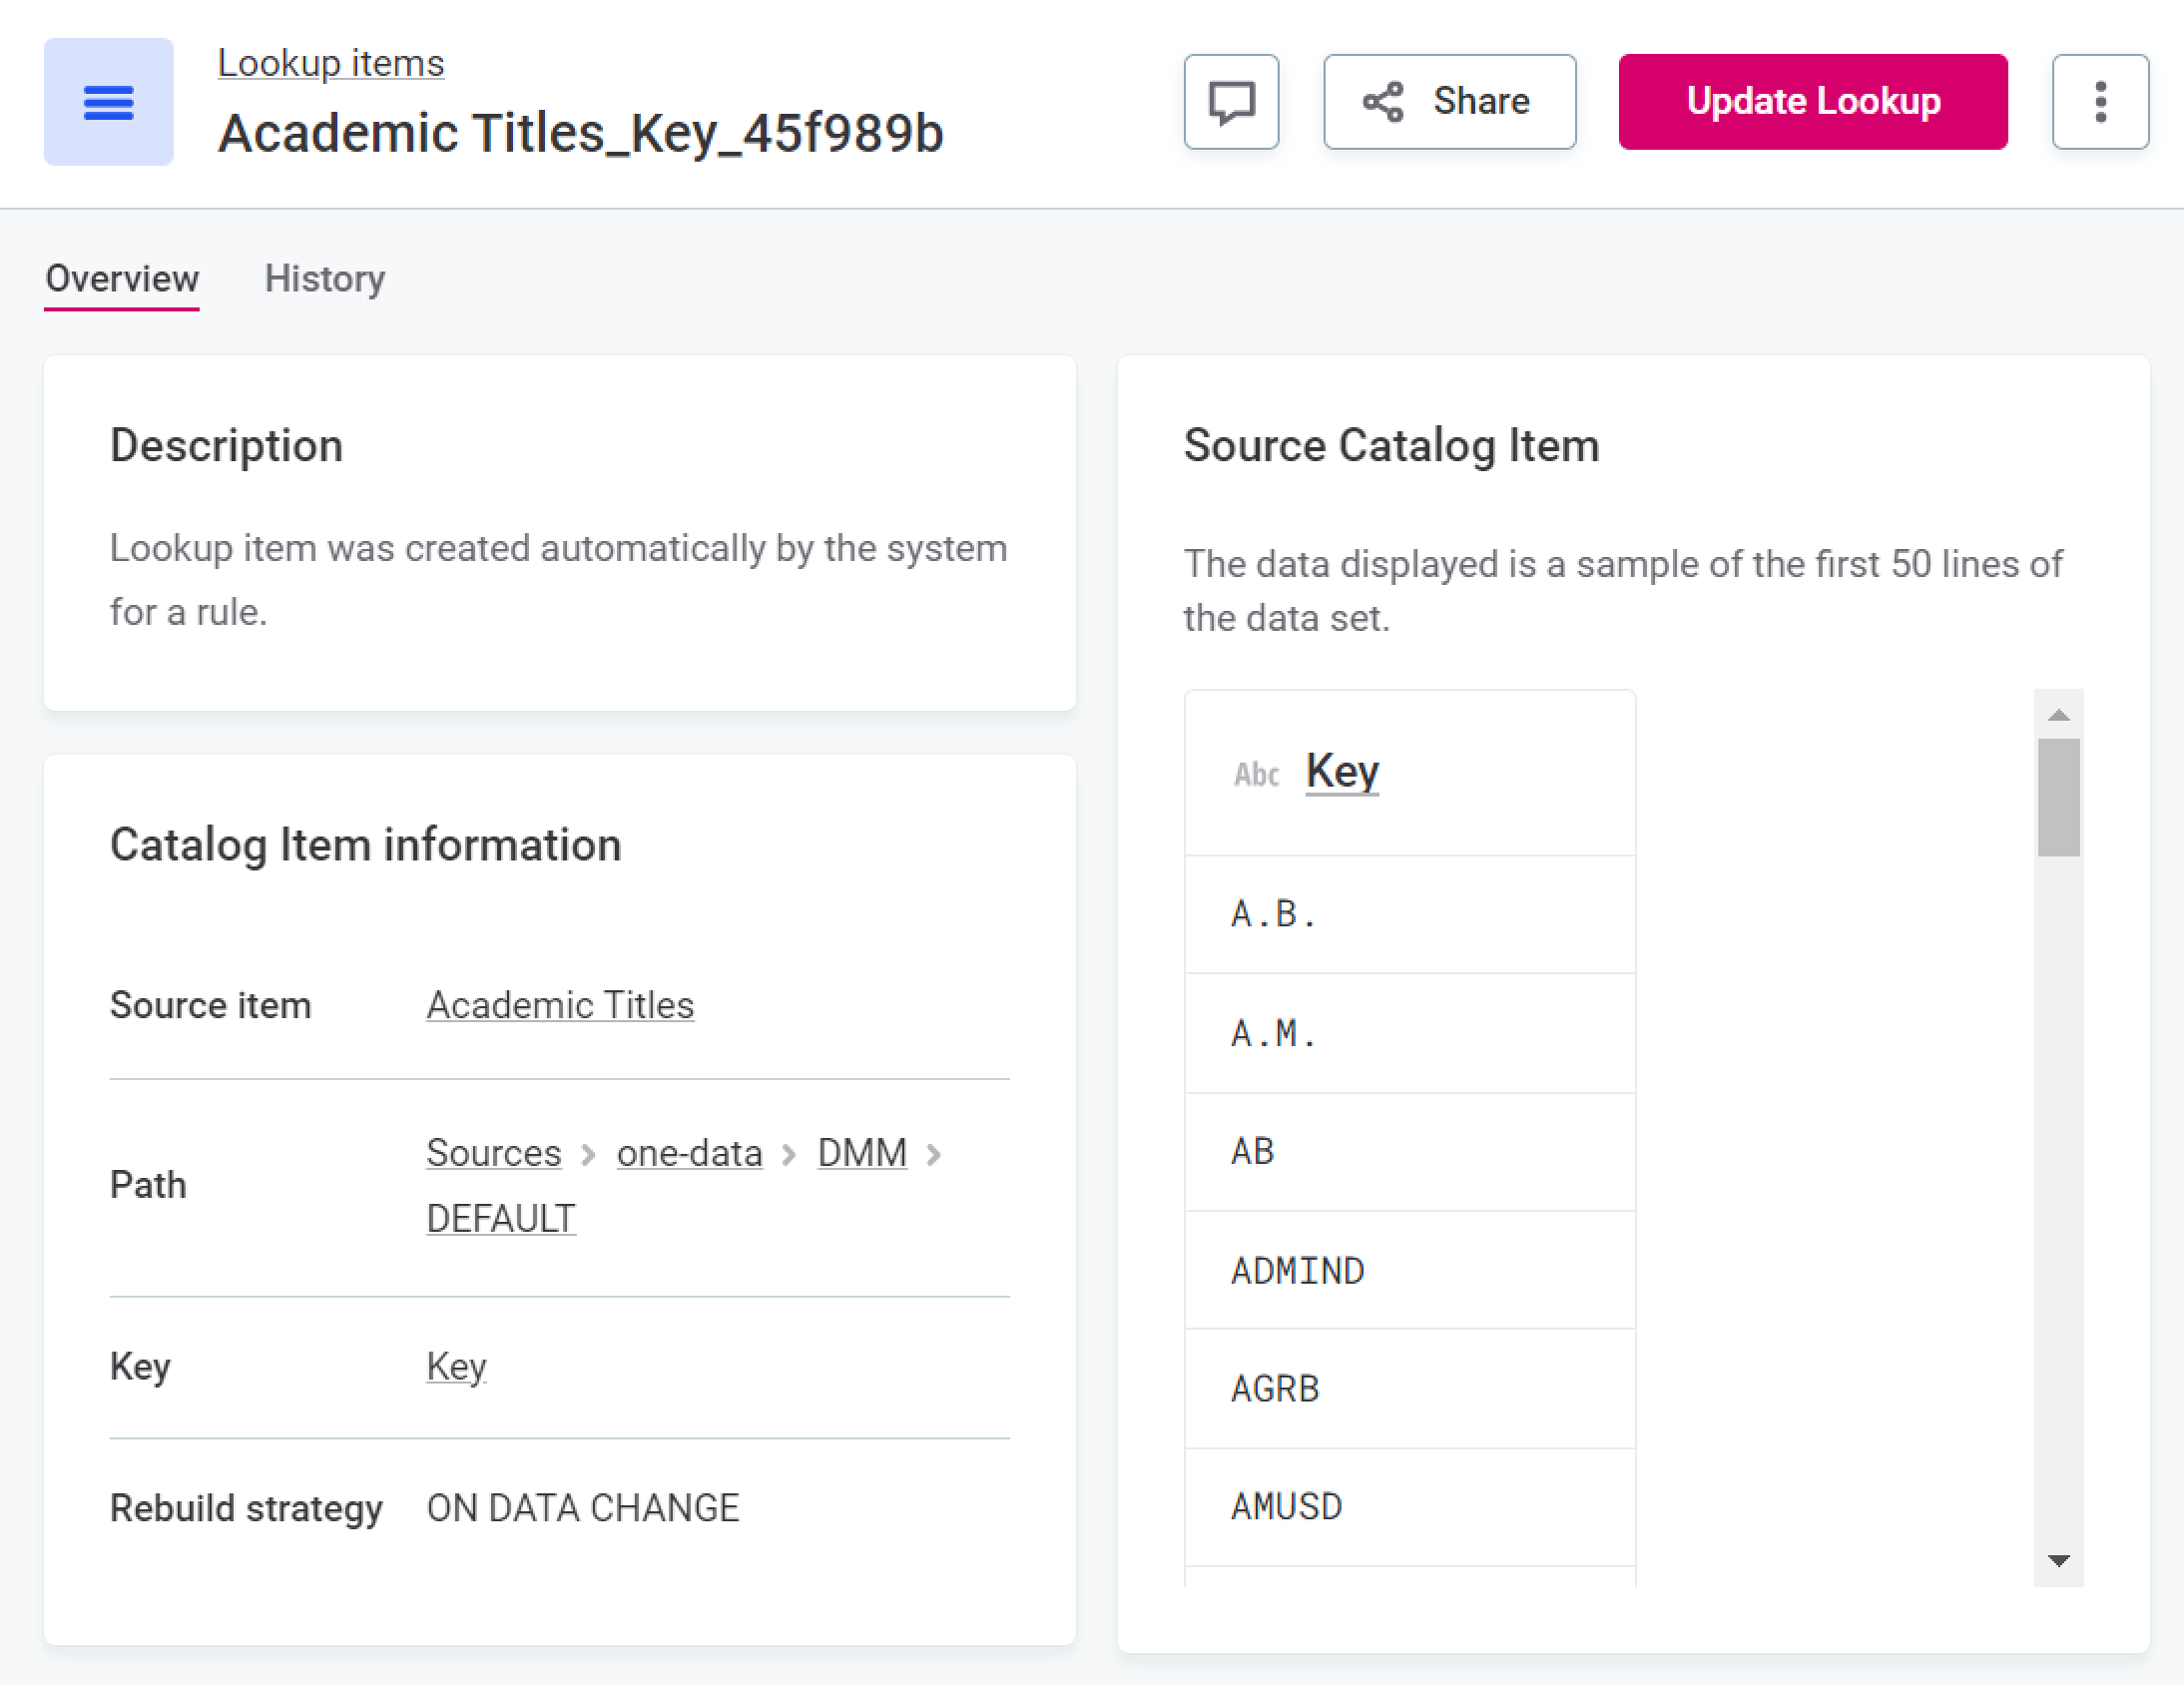
If profiling is failing due to missing lookup items, you can recreate the lookups from ONE:
-
If the original lookup is based on a catalog item, it can be rebuilt from the source catalog item. To do this, select the required lookup item and then Update Lookup.
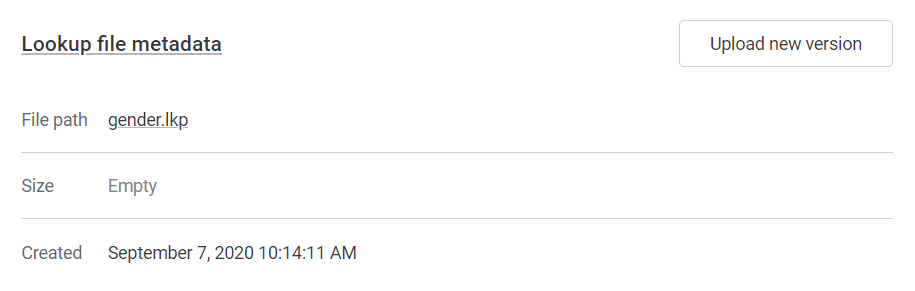
-
If this option is not available to you, it means the lookup item was not built from a catalog item and must instead be reuploaded. To do this, select the lookup item, and in the Lookup file metadata section, select Upload new version.
Publish changes and retry profiling.
Was this page useful?