Run Profiling
After you connect to a data source, start understanding your data better by running data discovery on the source or profiling a particular catalog item.
Sample vs. full profiling: What’s the difference?
The following are the default options available for profiling:
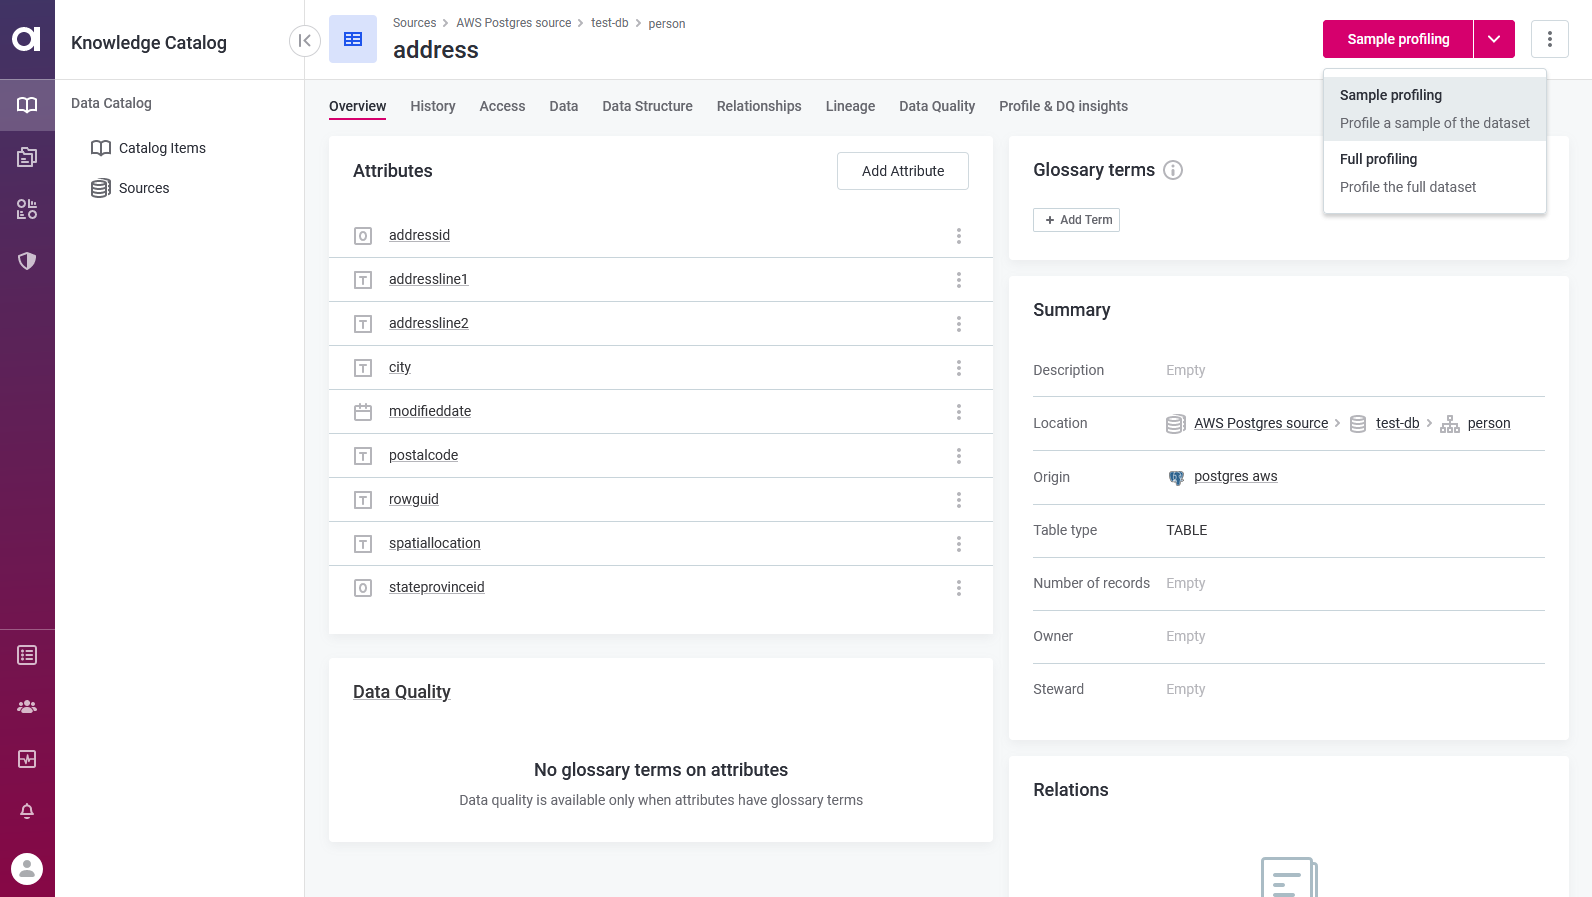
- Sample profiling
-
Analyzes a small sample of records from the selected catalog item as quickly as possible, in a performance-friendly way. This means calculating statistics, determining patterns, masks, and frequencies in your data, as well as applying rule and pattern-based domain detection to identify business domains.
Sample profiling processes 20% of your records, or at most 10,000 records, whichever is lower. - Full profiling
-
Processes all records of the selected catalog item. This type of profiling also includes anomaly detection, which helps identify potential irregularities or corruptions in your data.
By default, all profiling options also run on partitions.
You can customize the default profiling configurations as needed, or create a custom one (see Configure Profiling).
| If you run manual profiling on catalog items that are included in monitoring projects, any detected anomalies will also be visible in the monitoring project results. |
|
We do not recommend making changes to technical (imported) catalog item metadata after it’s been profiled. If attributes (or tables) are renamed, modified, or removed, subsequent profiling attempts might fail. However, if such changes are required, first delete the catalog item and all the related objects, such as monitoring projects, then reimport the data and run profiling again. You can freely edit non-imported metadata like descriptions, stewardship, and relationships. |
Ad hoc profiling
To run profiling on an ad hoc basis:
A single catalog item
-
In Data Catalog > Catalog Items, select the required catalog item (or attribute), and from the profiling menu, select the profiling you want to run.

Multiple catalog items
-
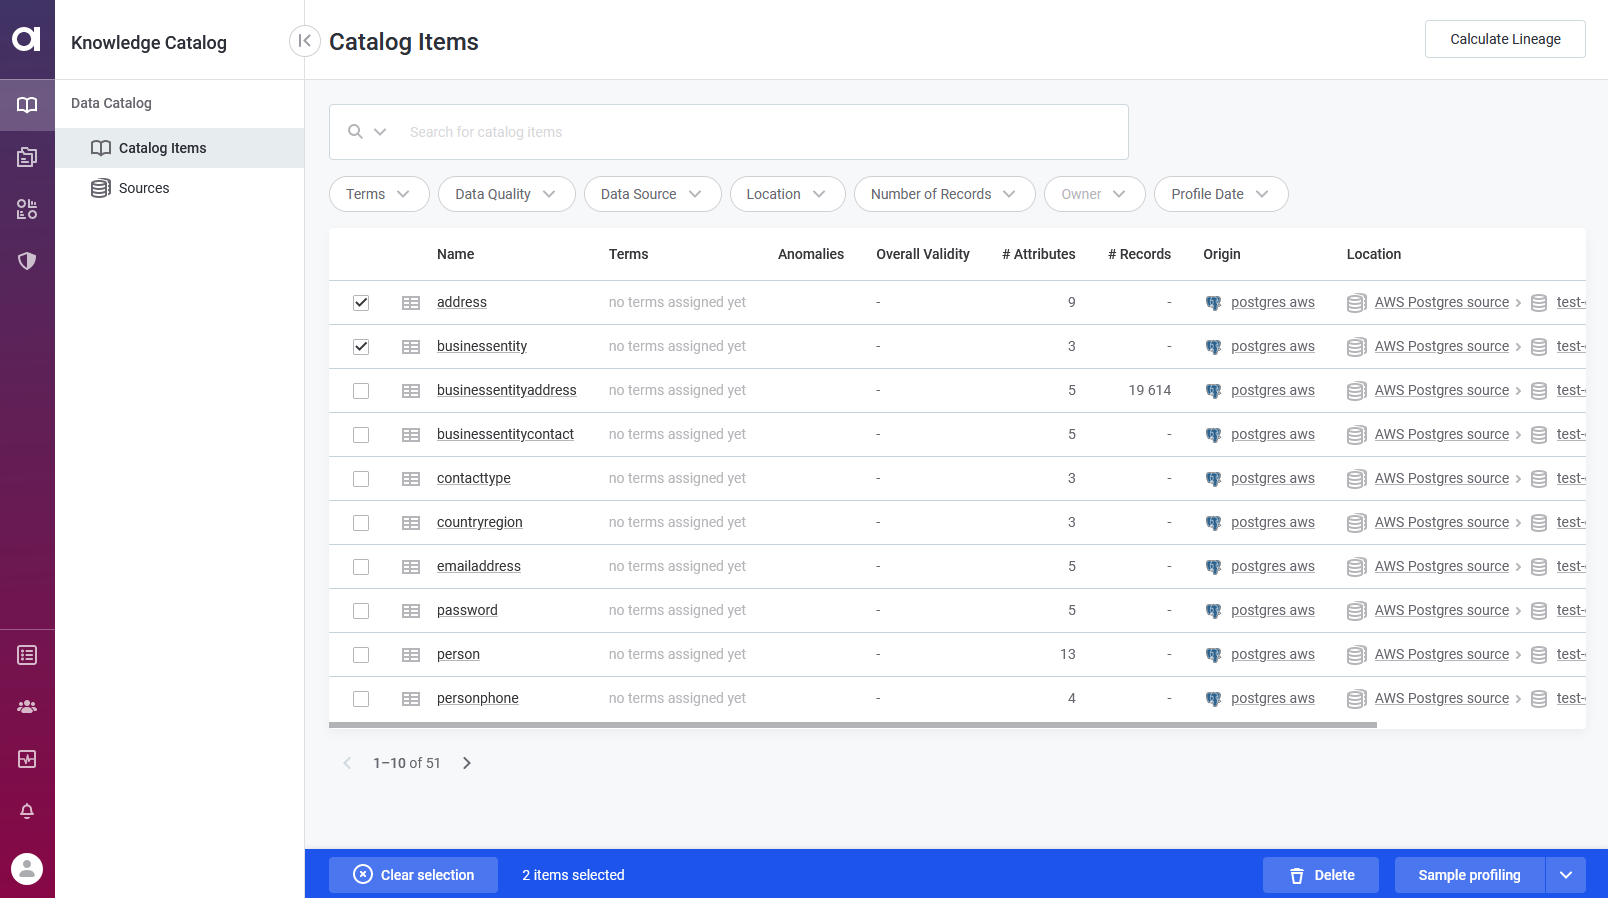
In Data Catalog > Catalog Items, select the required catalog items from the list, and in the ribbon that appears, select the profiling you want to run.

If the catalog items you want to analyze come from the same source, you can also run profiling from the source. In Data Catalog > Sources, select the required source, and from the Catalog Items tab, select the catalog items as needed and then the profiling option.
Profiling first imports the catalog item metadata, then processes the data. To track the progress, use the Processing Center. See Monitor profiling progress.
If the profiling was successful, navigate to the Profile & DQ insights tab of the relevant catalog item to see the results.
Profiling on partitions
| Profiling on partitions is supported only for metastore sources. |
When working with data sources with partitioned tables, there are additional profiling configurations:
-
<Profiling configuration> of the last partition - Profile the last partition only.
Last partition refers to the last partition in the full list of partitions, sorted in descending order. -
<Profiling configuration> of custom partition - Profile a partition of your choice.
-
<Profiling configuration> - Profile catalog item records regardless of partitions.
The <Profiling configuration> refers to any of the available profiling configurations.
Next steps
Monitor profiling progress
When you run metadata import or profiling, ONE starts the following jobs for each profiled catalog items, depending on your profiling configuration: Metadata import, Profiling, and Anomaly detection (Full profiling only) jobs.
More information about these jobs can be viewed at any time in the Processing Center.
Monitor job status
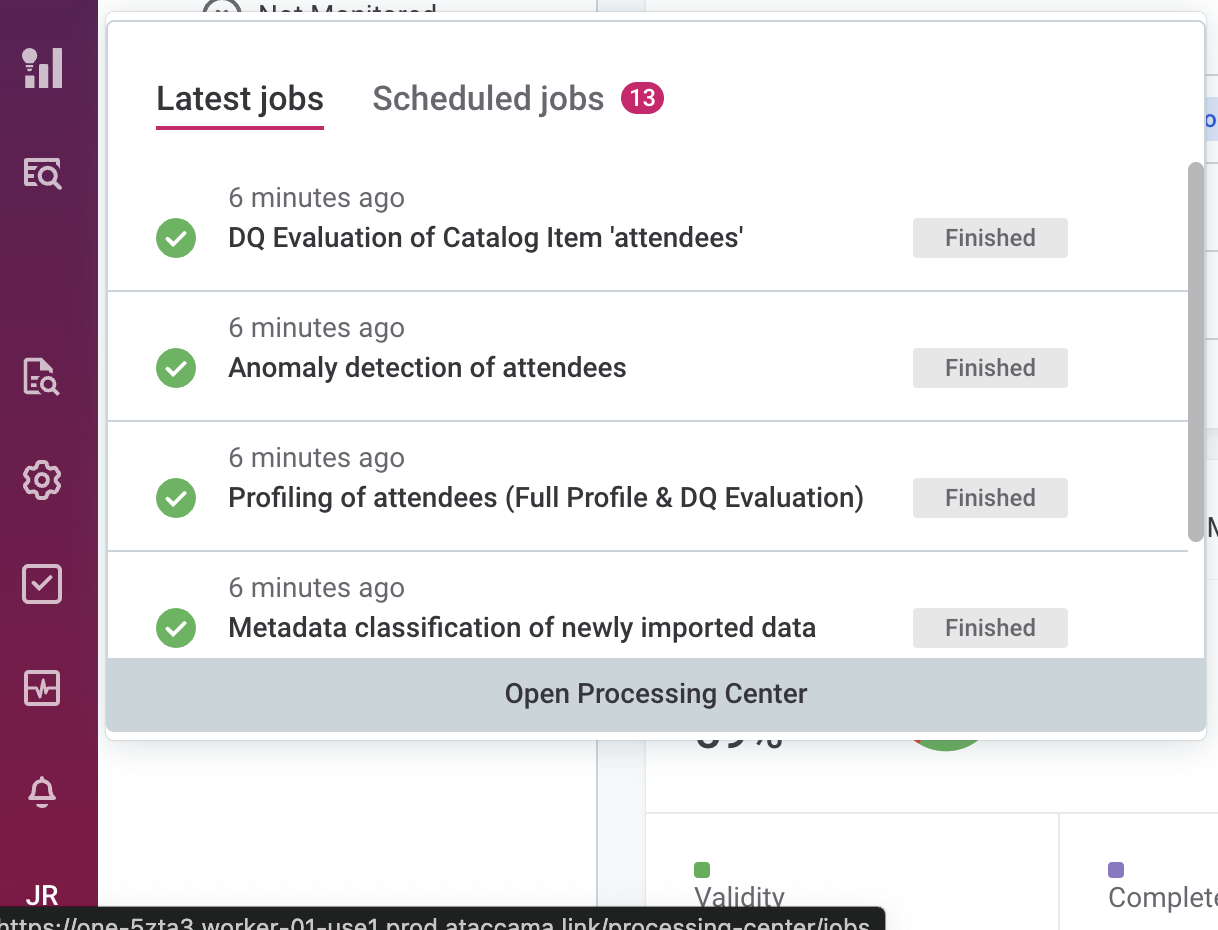
To monitor the job status, select the Processing Center icon in the main navigation menu to open the Processing Center notifications view.

Once the job is successfully completed, its Status changes from RUNNING to FINISHED.
Otherwise, the status is updated to FAILED and an error message is provided.
To view the job results, select the job directly from the notifications list.
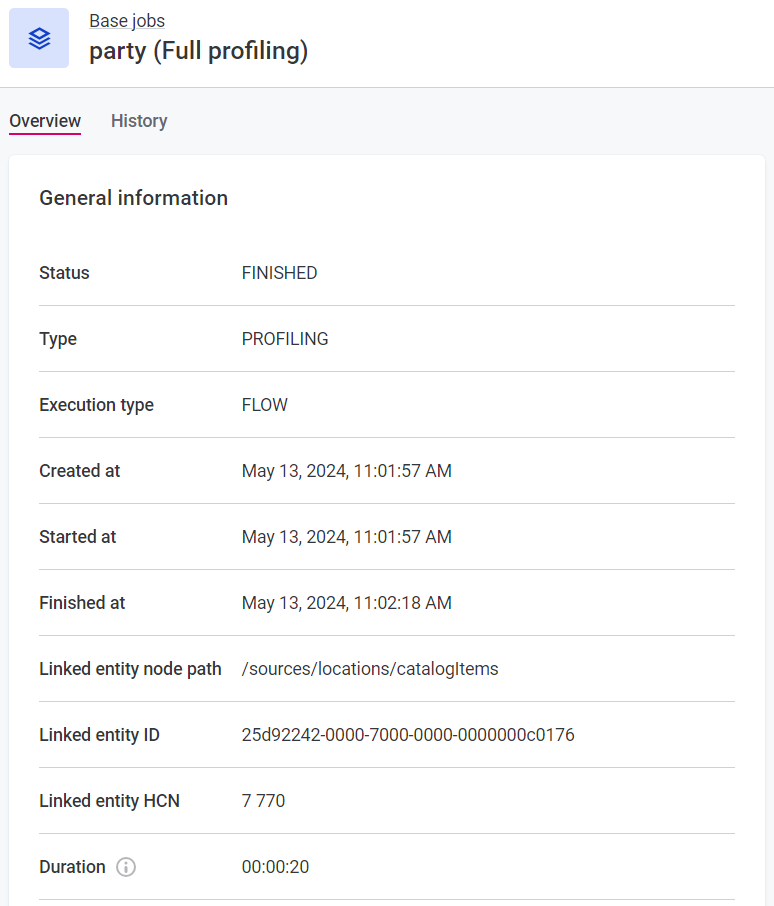
View job details
To see the job details, select Processing Center from the left navigation menu and then Open Processing Center under the list of notifications.
From the Base jobs menu, select the job type and locate your job.

If the job was started as part of a documentation flow, its Execution type is FLOW.
For manually initiated jobs, the type is MANUAL.
View profiling results
Open the catalog item Profile & DQ insights tab to learn more about the state of your data and decide on the next steps for improving the data quality. For details, see Understand Profiling Results.
Was this page useful?
