
Monitoring Project Results, Reports, and Notifications
Results
Once you have run your monitoring project, you can see issues or anomalies detected in your data set.
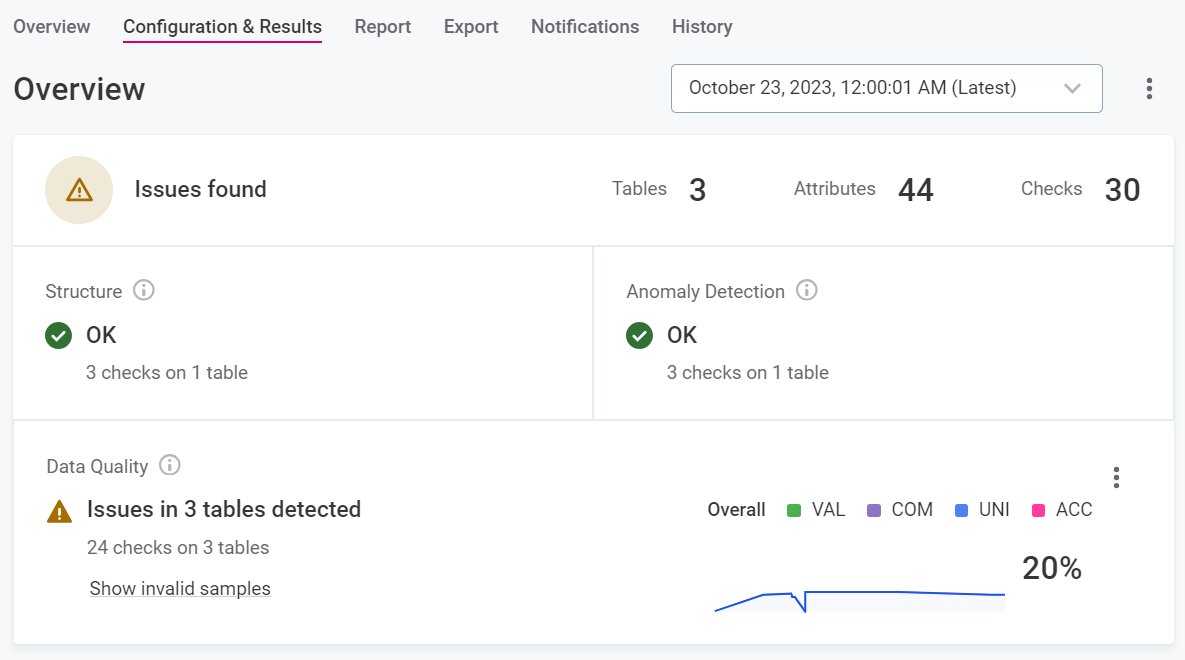
Issues
Issues relate to failed DQ rules. From the Configuration & Results screen, you can access invalid samples, that is, a sample of the records which failed data quality rules.
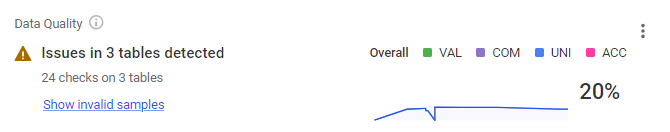
This can be done both at the project level and at the catalog item level: select Show invalid samples.
| From the Report tab, it is also possible to see invalid samples from individual dimensions. |
Detailed results of each rule are available on the Report tab. For more information, see Reports.
What should I do with failed records?
Consider creating a post-processing plan from the catalog item. Using the plan you can apply data transformations and write to a ONE Data table for subsequent data remediation.
For more information, see Post-Processing Plans and Data Remediation with ONE Data accordingly.
Anomalies
Anomalies shown in Anomaly Detection are those detected on the metrics of catalog items and attributes, such as value distribution, standard deviation, numeric statistics,and string statistics. The value of the metric is considered to be an anomaly if it is beyond the usual range.
Anomalies can be confirmed or dismissed from the Profile inspector.
See Anomaly Detection in Monitoring Projects, starting from the section Detected anomalies.
Reports
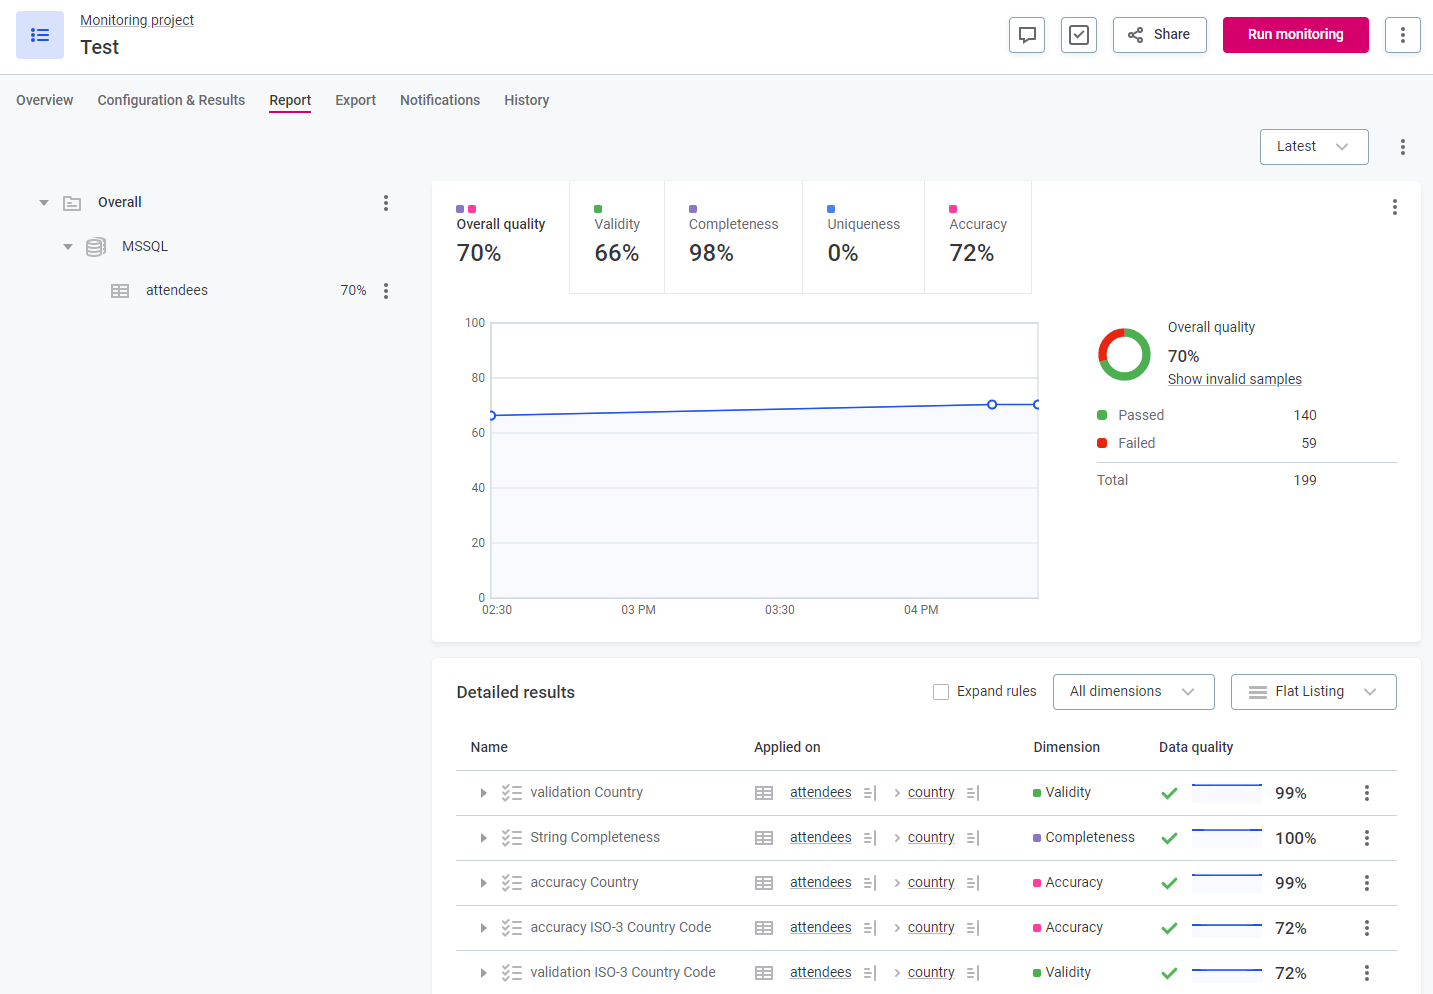
DQ reports show the DQ results and detected anomalies over time for all monitoring runs. They provide an overview of issues and statistics, meaning it is possible to see the changes in DQ for the whole monitoring project, for catalog items, for specific DQ dimensions, and on specific rules applied to the attributes. You can also explore any of the identified issues in more detail.
DQ stewards are notified when a new report is available and can see DQ issues (and expand details) as well as anomalies and the corresponding profiling results.
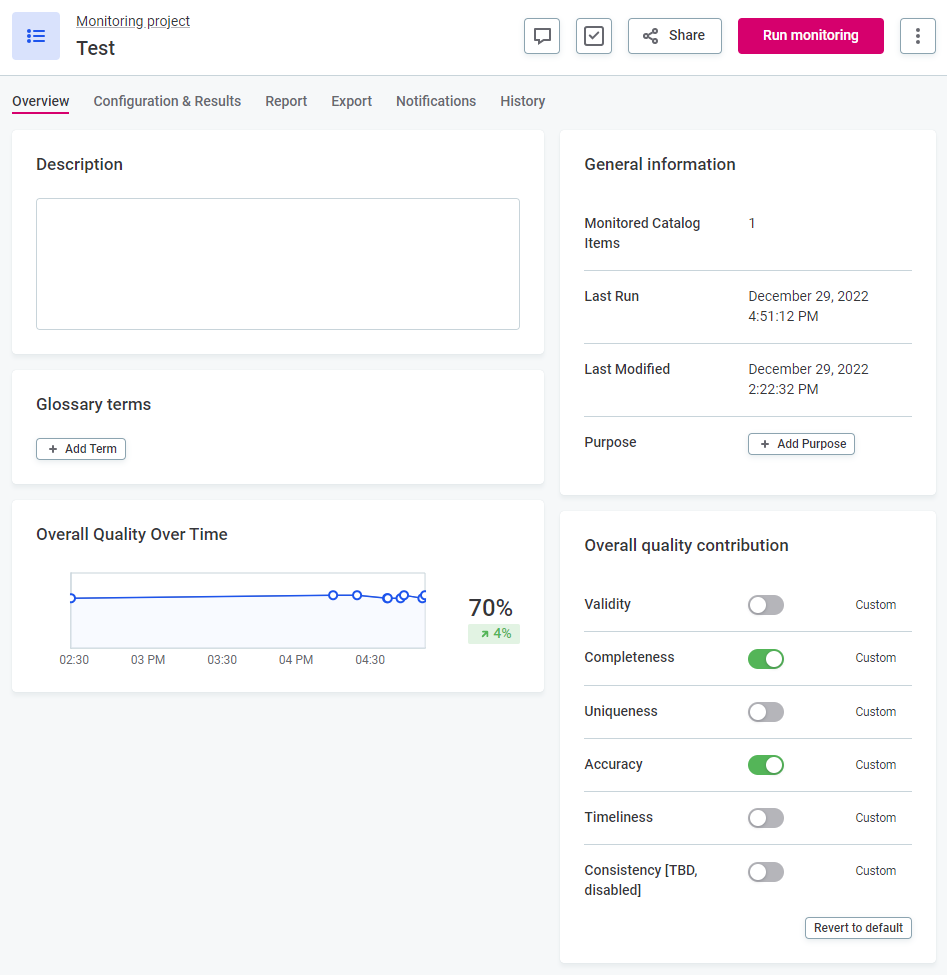
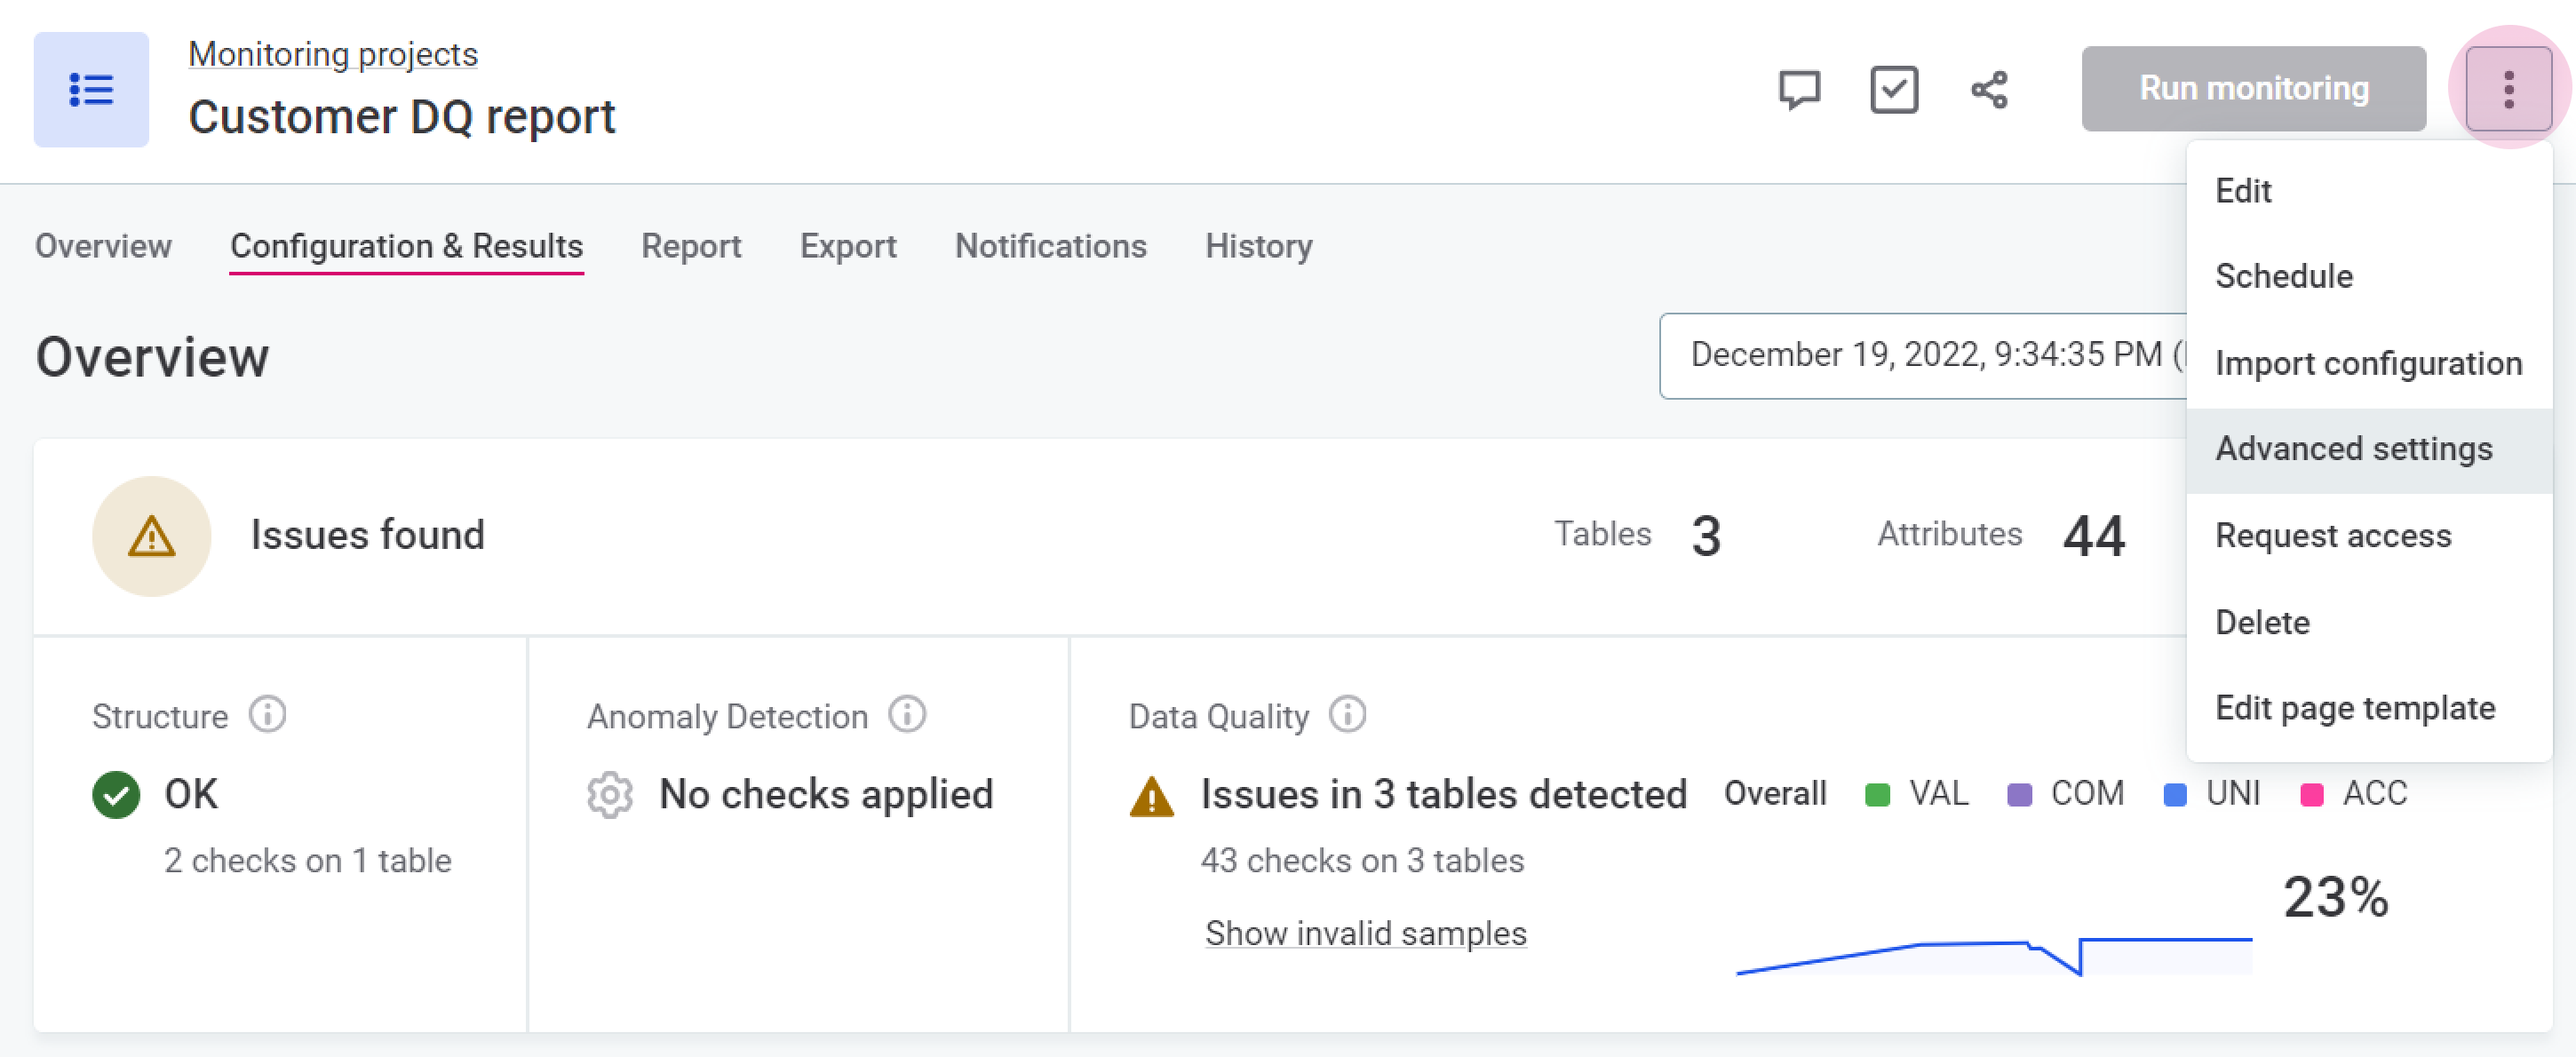
Once monitoring has finished, the DQ report is available on the Report tab. From here, you can see where anomalies have been detected, invalid samples, data quality results (overall and for individual dimensions), and individual rule results.
|
If you selected attribute filters in your monitoring project, these are also available in your report when you select the catalog item for which you enabled the filters. 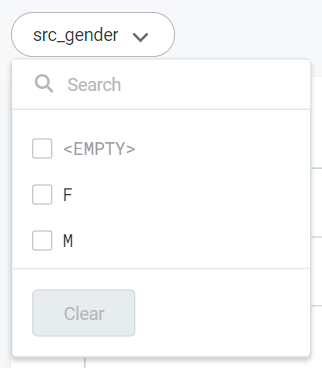
|
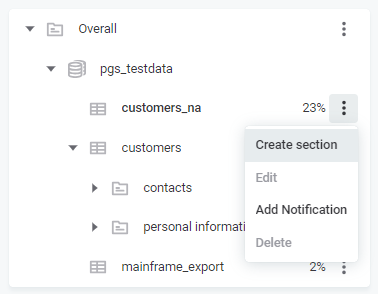
If you are particularly interested in an individual rule, you can create a section in the report for that rule.
To do this:
-
For the required catalog item, select the three dots menu and then Create section.
-
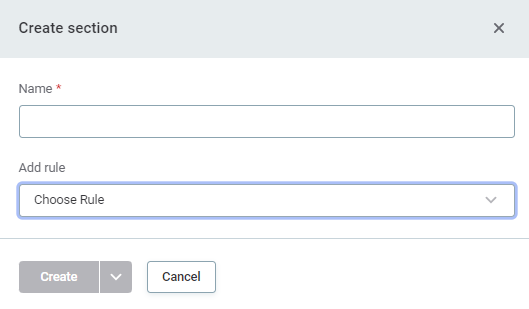
Specify a name for the section and select from the list of the rules available for the item.
-
Select Create.
| If you do not have access to the full data set, you see results for the relevant subset. |
To see the data quality for all rules used in the monitoring project, expand the rules in the Detailed results list.
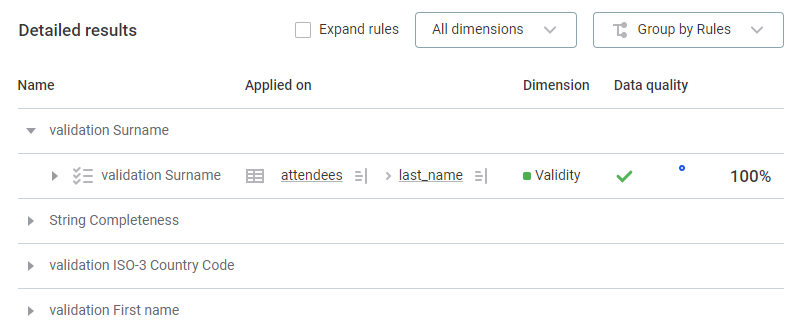
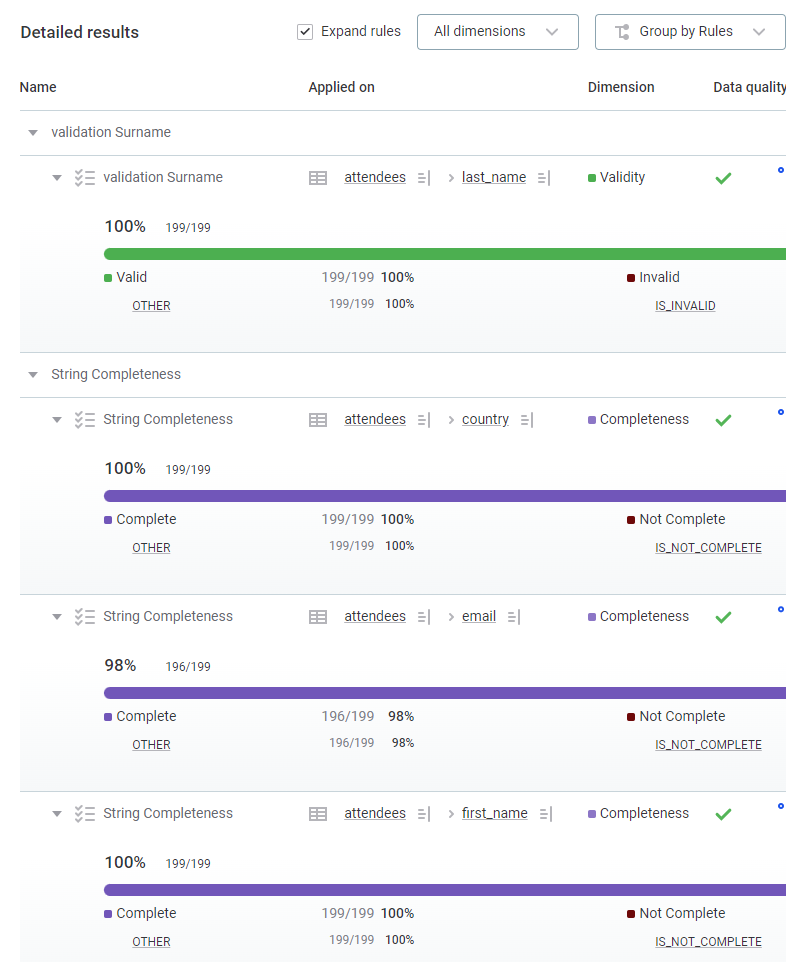
| Use the Expand rules option to see details of all rules without having to manually expand each one, or select a dimension to filter results. |
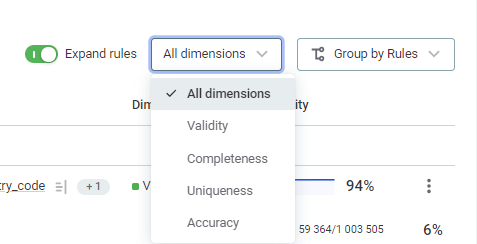
In the report, you can view aggregated DQ results using the Overall quality tab, or only results for a specific dimension. There is a tab for all dimension types of rules applied in your monitoring project.
| The overall quality percentage is always the same or lower than the pass and fail percentage of any of the contributing dimensions. This is a result of how the results are aggregated, that is, a record is considered passed if all applied rules result in passed. |
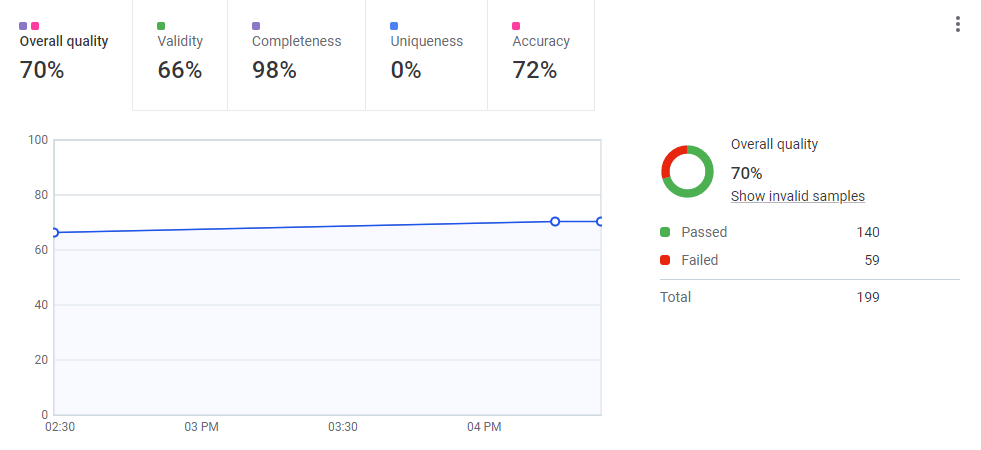
Which dimensions are contributing to the overall quality aggregation is indicated by the colors visible on the Overall quality tab. These can be verified by hovering over the Overall quality tab, or by checking the DQ dimension configuration in the monitoring project overview. For more information about DQ dimensions, see Data Quality Dimensions.
Results retention
You can select how long you would like to store the results of monitoring projects. This can be for maintenance reasons or for security, for example, in case there is company policy that forbids data to be kept longer.
Retention period can be based on days or runs, that is, you can choose to remove results older than the defined number of days or runs:
-
Keep last
Xruns. -
Remove runs after
Xdays.
The retention period can be set on the global level (power users only) as well as separately for each monitoring project.
Data is deleted when:
-
A run is older than either the global or project configuration allows.
-
There are more runs than either the global or project configuration allows.
-
A power user manually deletes processing in Metadata Management Module (MMM).
When results are cleared, the following is removed:
-
Processing in MMM.
-
Invalid samples from ONE Object Storage.
-
DQ results from DQ storage.
-
Filter values from DQ storage.
-
Post-processing plan (PPP) exports from ONE Object Storage.
Global retention
Power users can configure global retention settings in ONE or via API. For instructions, see Retention Settings or ONE API, section Monitoring projects global retention, respectively.
If global settings are configured, you are notified in Advanced settings for your monitoring project.
Configure retention per monitoring project
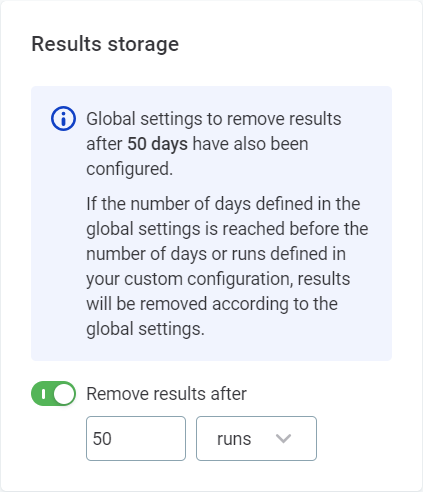
| If the number of days defined in the global retention settings is reached before the number of days or runs defined in your custom configuration, results are removed according to the global settings. |
To configure removal of the results:
-
In the required monitoring project, select the three dots menu and then Advanced settings.
-
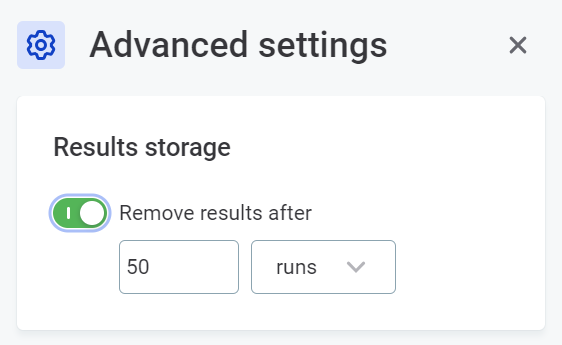
Select the option Remove results after to enable removal.
-
Select between days and runs and enter the number as required.
-
If you select runs, the number corresponds to the number of runs that are kept. For example, Remove results after 50 runs means only the results for latest 50 runs are stored.
This is most suitable if your aim is to reduce the amount of unnecessary data that is retained.
-
If you select days, the number corresponds to the number of days the results are stored for. For example, Remove results after 50 days means all results older than 50 days are removed.
This is most suitable if data can only be stored for a limited amount of time for security reasons.
-
-
Close the sidebar and publish the changes.
Export and post-processing plans
Using post-processing plans, you can transform and export monitoring project results to be used in ONE Data or other business intelligence tools.
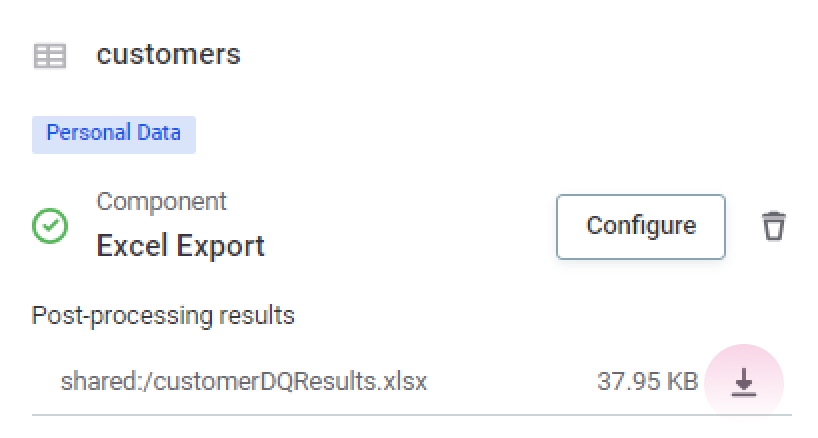
Post-processing plans and their outputs are found on the Export tab.
There are two types of post-processing plans:
-
Legacy post-processing plans, which are implemented from ONE Desktop. For more information, see Post-Processing Plans.
-
Data transformation plans, which are implemented in ONE, using the transformation plans feature. For more information, see Data Transformation Plans - DQ Monitoring Results.
Once the post-processing plan has finished, download the output from the Export tab.
Notifications
There are two available types of notifications: general and specific.
-
General notifications: High-level alerts about monitoring events (monitoring failed, critical error in structure, new results, DQ issue or anomalies). Emails contain summary information only.
-
Specific notifications: Granular alerts triggered by DQ thresholds you define. Emails include detailed DQ report data for the specific rules or instances you configure.
If specific notifications aren’t configured, emails don’t contain detailed data quality reports. Instead, a "No DQ Report Available" message is displayed in the DQ results section.
To receive detailed DQ information in email notifications, add specific notifications.
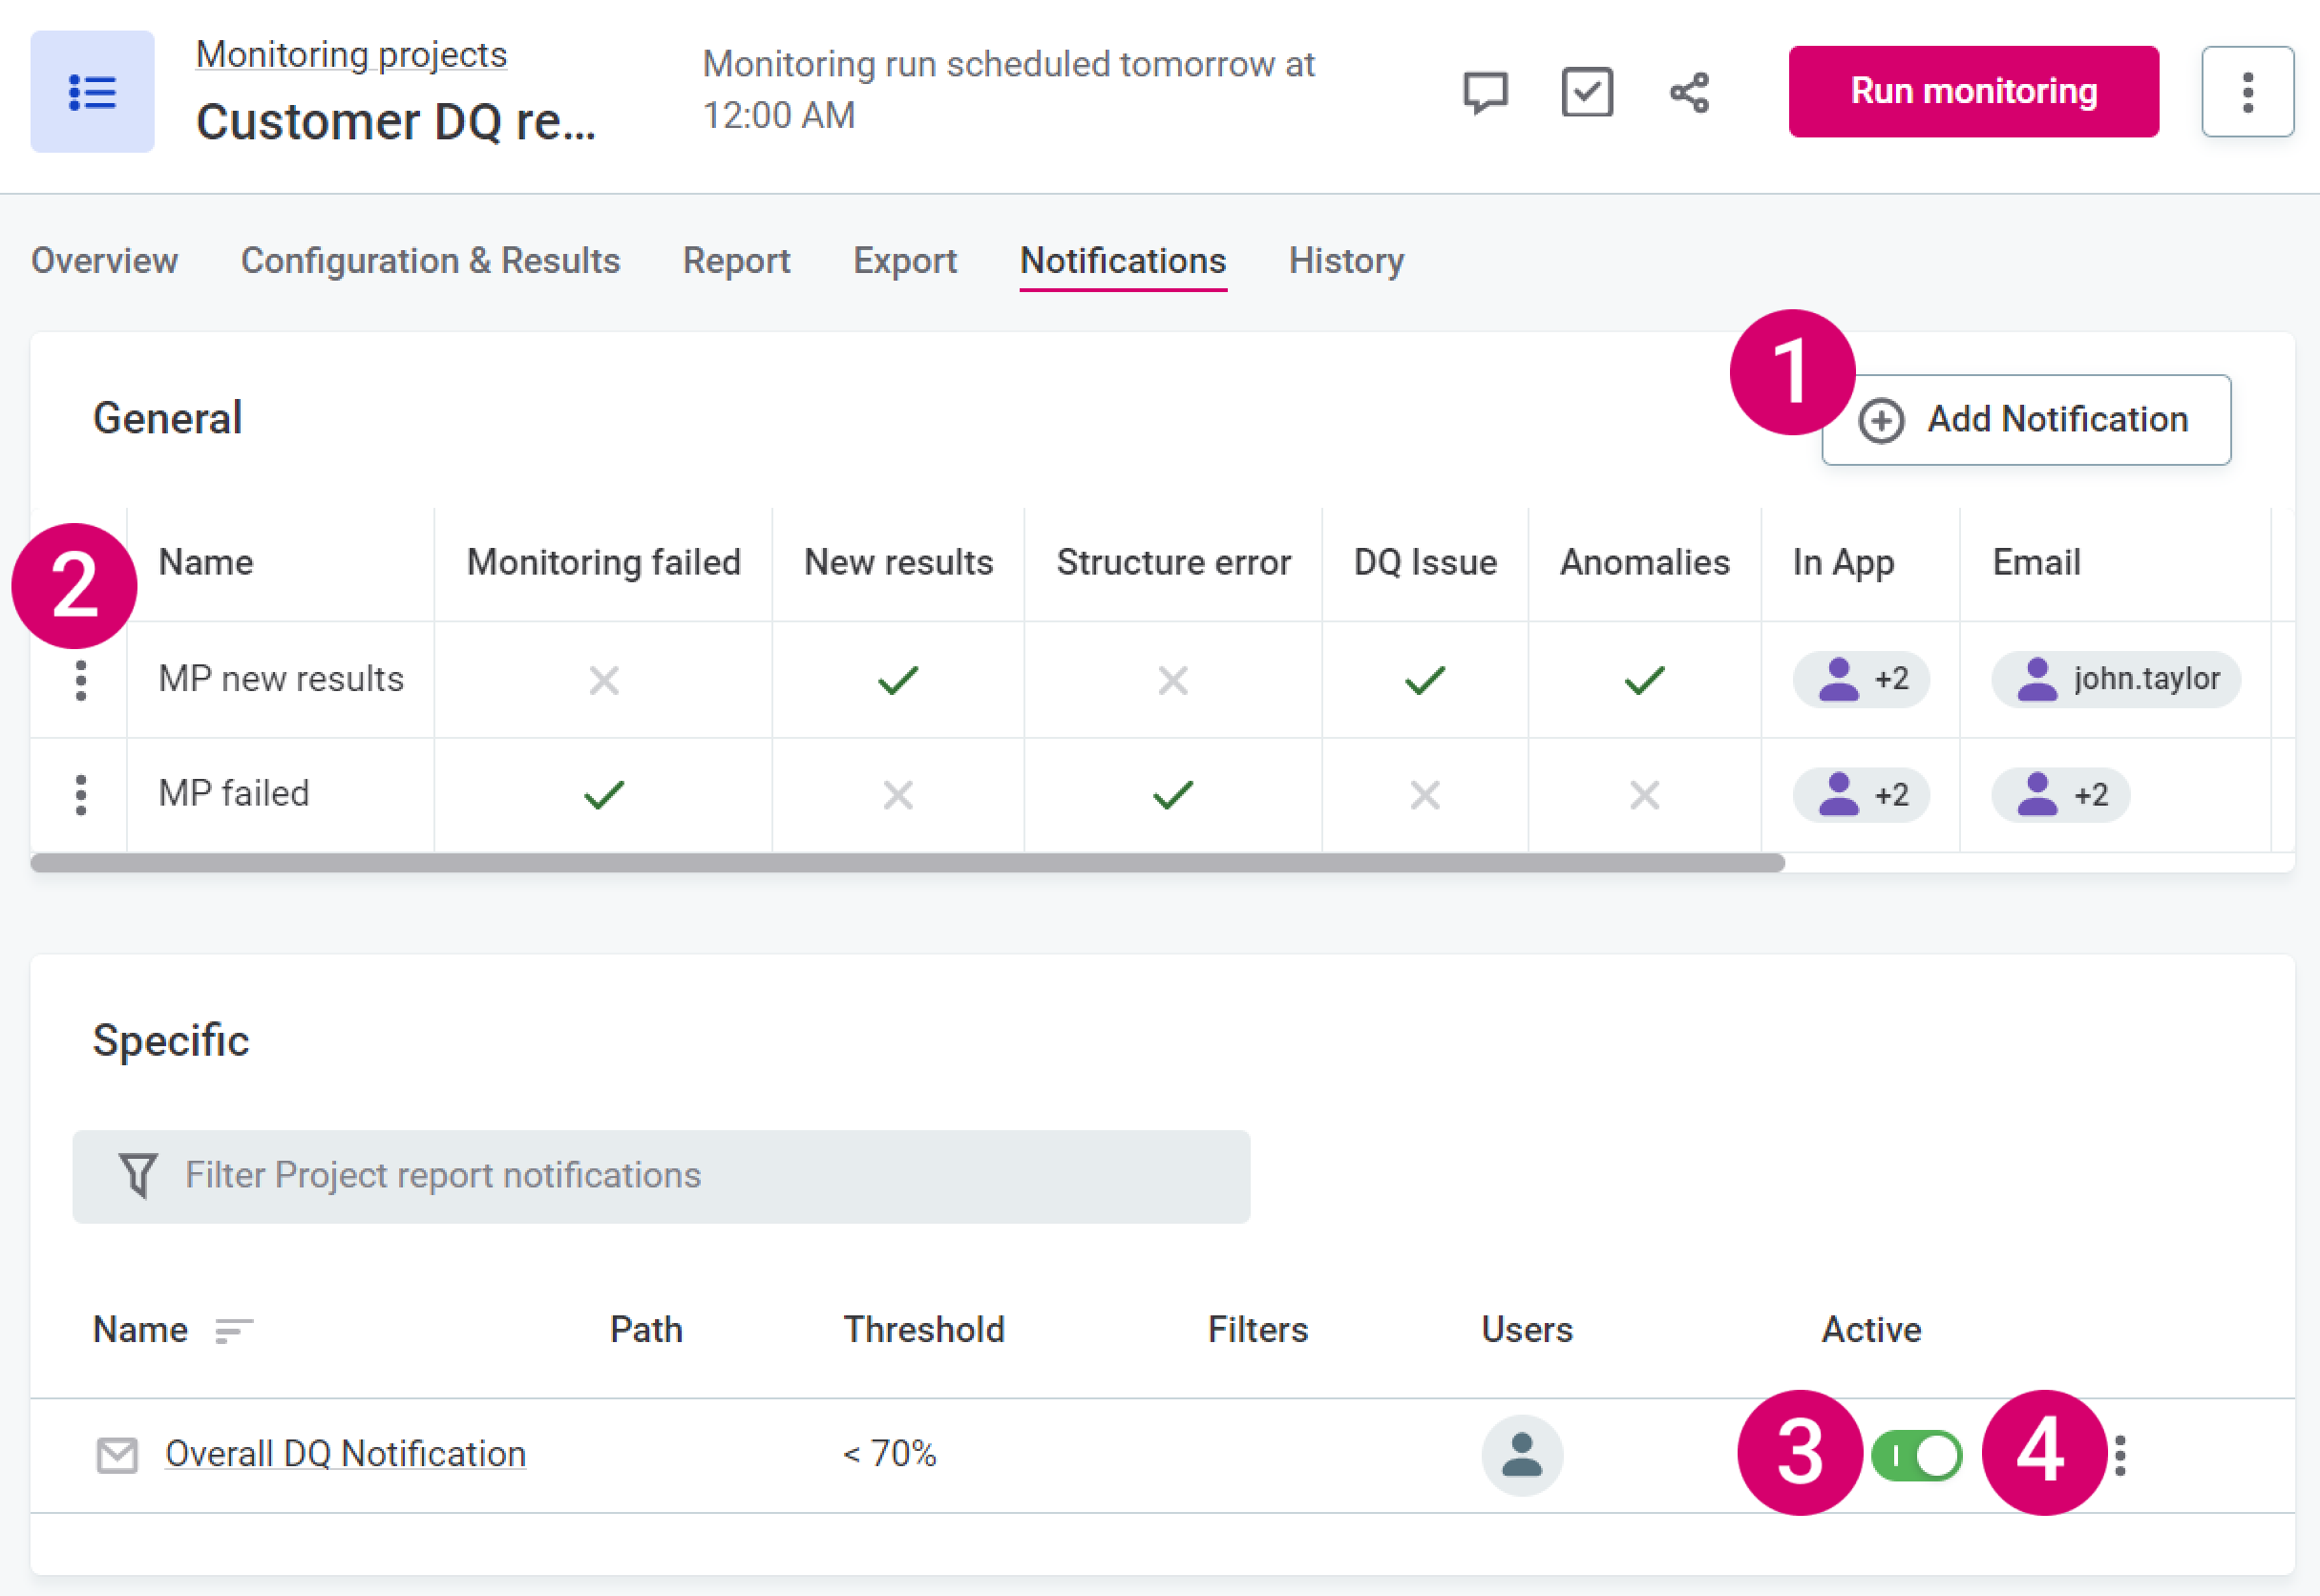
Both general and specific notifications are listed on the monitoring projects Notifications tab. From here, they can be edited, turned on or off, or removed as required.
-
Add general notifications.
-
Edit or delete general notifications.
-
Enable or disable specific notifications.
-
Edit or delete specific notifications.
However, the steps for adding new notifications differ for these two sections. New general notifications can be added directly from the Notifications tab but new specific notifications are added from the Report tab.
General notifications
To set notifications for one of the preselected scenarios when running monitoring:
-
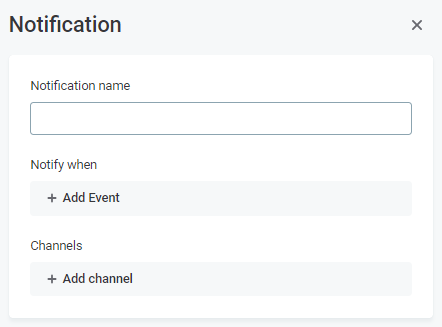
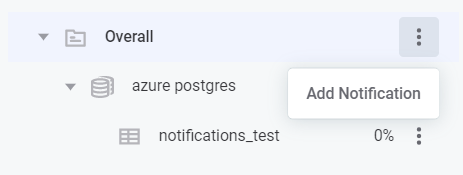
Navigate to the Notifications tab of the project and under General, select Add Notification.
Or, click the row to edit an existing notification.
-
Select the events for which you would like notifications to be triggered.
-
Select the channels on which you want to receive the notification.
-
In app: Select the users you want to receive the in app notification.
-
Email: Select the users you want to receive the email notification.
-
Slack: Enter the channel name. If ONE is not connected to Slack, you can connect to your workspace in General settings. See Slack Integration.
-
Microsoft Teams: Insert the webhook URL. See MS Teams Integration.
-
| Roles correspond to those defined in your identity and access management tool. |
|
Email notifications are turned off by default. If you want to receive email notifications, you must first enable the plugin and configure the SMTP server. For more information see MMM Configuration, section SMTP server. |
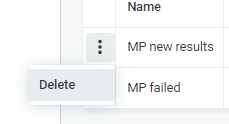
Delete an existing notification by selecting the three dots menu and then Delete.
Specific notifications
Specific notifications have much greater granularity than general notifications and can also be assigned to individual users (Persons) as well as Roles.
You can define specific data quality thresholds which determine when these notifications should be triggered, as well as filter conditions. For example, configure a notification that is sent only if the quality is lower than 70% and is from a specific date range.
Notifications configured in this way are delivered to the user as an email. In the email template design, the Overall results section contains the information resulting from General notifications, whereas the DQ results section contains notifications from Specific notifications. The email includes direct links to items in the report.
While specific notifications can be edited and deleted directly from the Notifications tab, to add new specific notifications, you need to go to the Report tab.
To add a new notification:
-
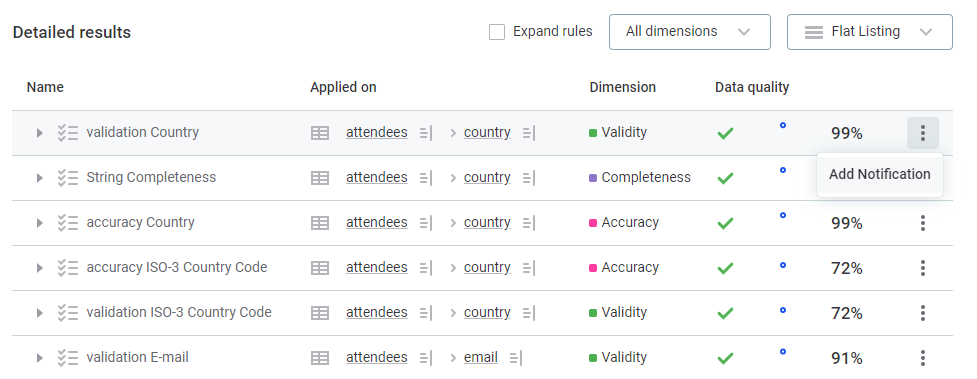
Go to the Report tab.
-
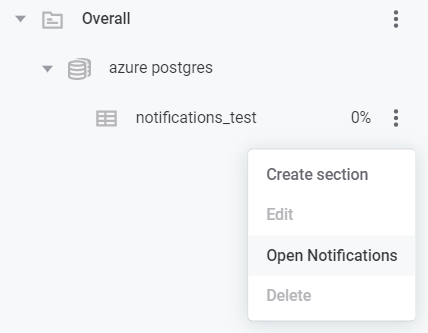
Select the instance or rule for which you’d like to add the notification. Use the three dots menu and select Add Notification.
-
If notifications are already configured for that instance, you see Open Notifications instead.
-
-
After selecting Add or Open notifications, a sidebar opens:
-
If no notifications exist, you can now create one.
-
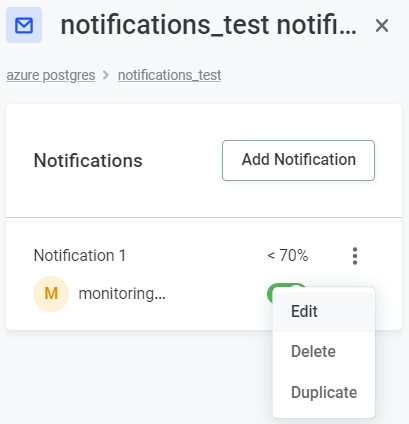
If notifications already exist on that level, you are shown an overview instead. From here, you can add a new notification (select Add Notification) or edit an existing notification (select the three dots menu and then Edit).
-
-
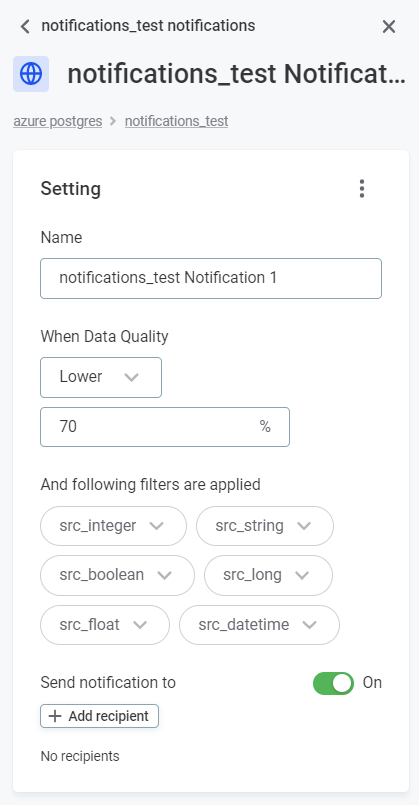
When creating or editing notifications, provide the following information:
-
A custom name for the notification. If no name is specified, the default format is applied.
-
The data quality in percentage (
%) and whether the result should be lower or higher than this number in order for the notification to be triggered.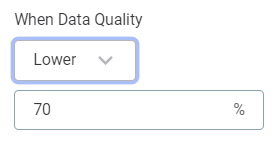
-
-
Filter conditions. If filters are available on the item (that is, if Filter by has been enabled for one or multiple attributes on the catalog item during monitoring project configuration) you can define filter conditions.
Use the dropdown for the required attribute filters and select the values which apply.
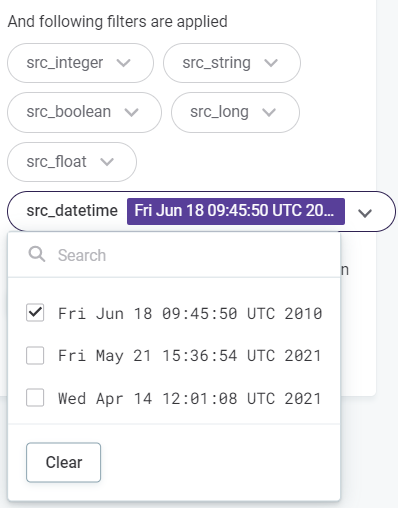
Filters displayed in notification settings reflect the settings that existed the last time the monitoring project was run. If changes have been made since, you need to re-run the project in order to see the currently configured filters. -
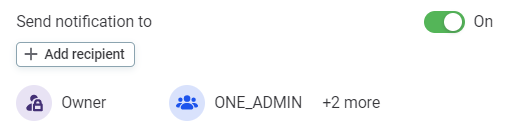
Recipients. Select Add recipient and select the Persons or Roles who should receive the notification.
-
Select Save and publish.
Troubleshooting
SMTP authentication issue
- Problem
-
When trying to send mail, it fails with the following error:
SMTPSendFailedException: 530 Authentication required. - Solution
-
Confirm you have passed the parameters
-Dmail.smtp.auth=true,-Dmail.smtp.starttls.enable=true, and-Dmail.smtp.ssl.protocols=TLSv1.2to the relevant JVM.The Sendmail step can be run on a DQIT server, a ONE Runtime server, or as a DPE job. If running as a DPE job, the parameters must be set in
plugin.executor-launch-model.ataccama.one.launch-type-properties.LOCAL.env.JAVA_OPTS.For more information, see Executor configuration in DPE Configuration.
Was this page useful?