
Monitoring Projects
Use monitoring projects for manual monitoring of your most critical data assets. Select catalog items on which to run anomaly detection and schema checks, and evaluate data quality based on the data quality rules you apply.
Monitoring projects provide reactive monitoring of selected data. If you want to monitor entire data sources or schemas without needing to apply rules manually, consider using the Data Observability feature.
Create monitoring project
|
If you would like to add additional items to a current project or edit or copy the configuration of a current project, head to Add catalog items or Additional Configuration Options, respectively. If you want to understand the results of your project better, see Monitoring Project Results, Reports, and Notifications. |
To create a new monitoring project:
-
In the navigation menu, select Data Quality and then Monitoring Projects.
-
Select Create.
-
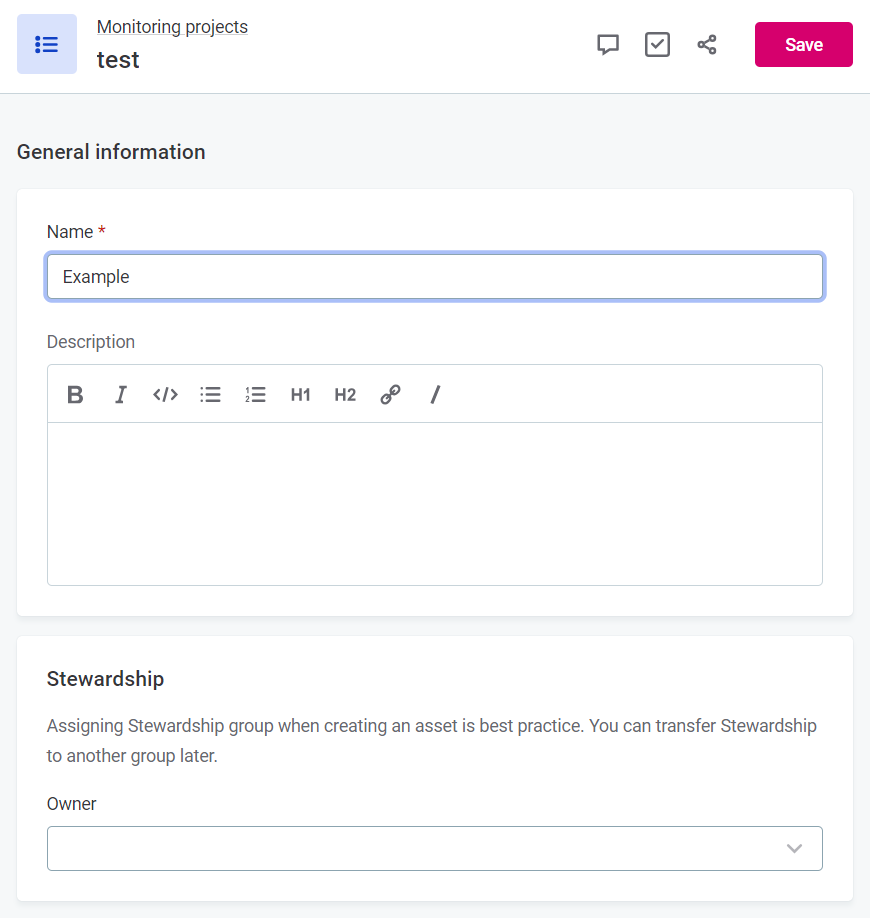
Provide a name for the project.
-
Describe the aim of the monitoring project (optional).
-
In Stewardship, select the user group which will be owners of the asset. After you select a group, the list of users assigned to the governance roles within the selected group is displayed.
For more information, see Stewardship
-
Select Save.
You can edit the information provided here anytime by selecting the project, using the three dots menu, and selecting Edit.
Add catalog items
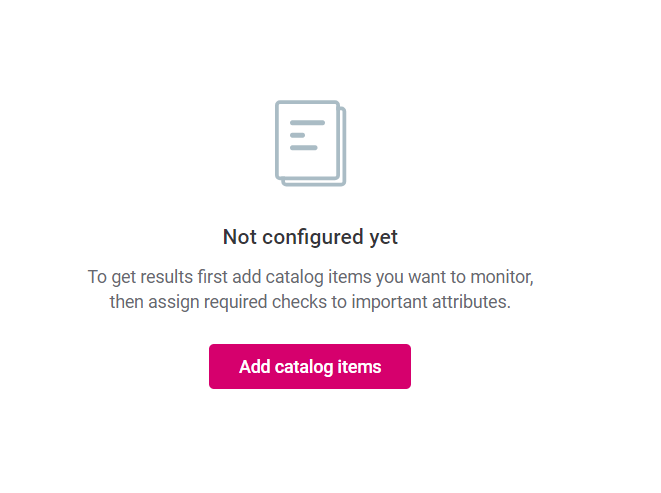
After you have created your project, add the required catalog items.
To do this:
-
Navigate to the Configuration & Results tab.
-
Select catalog items:
-
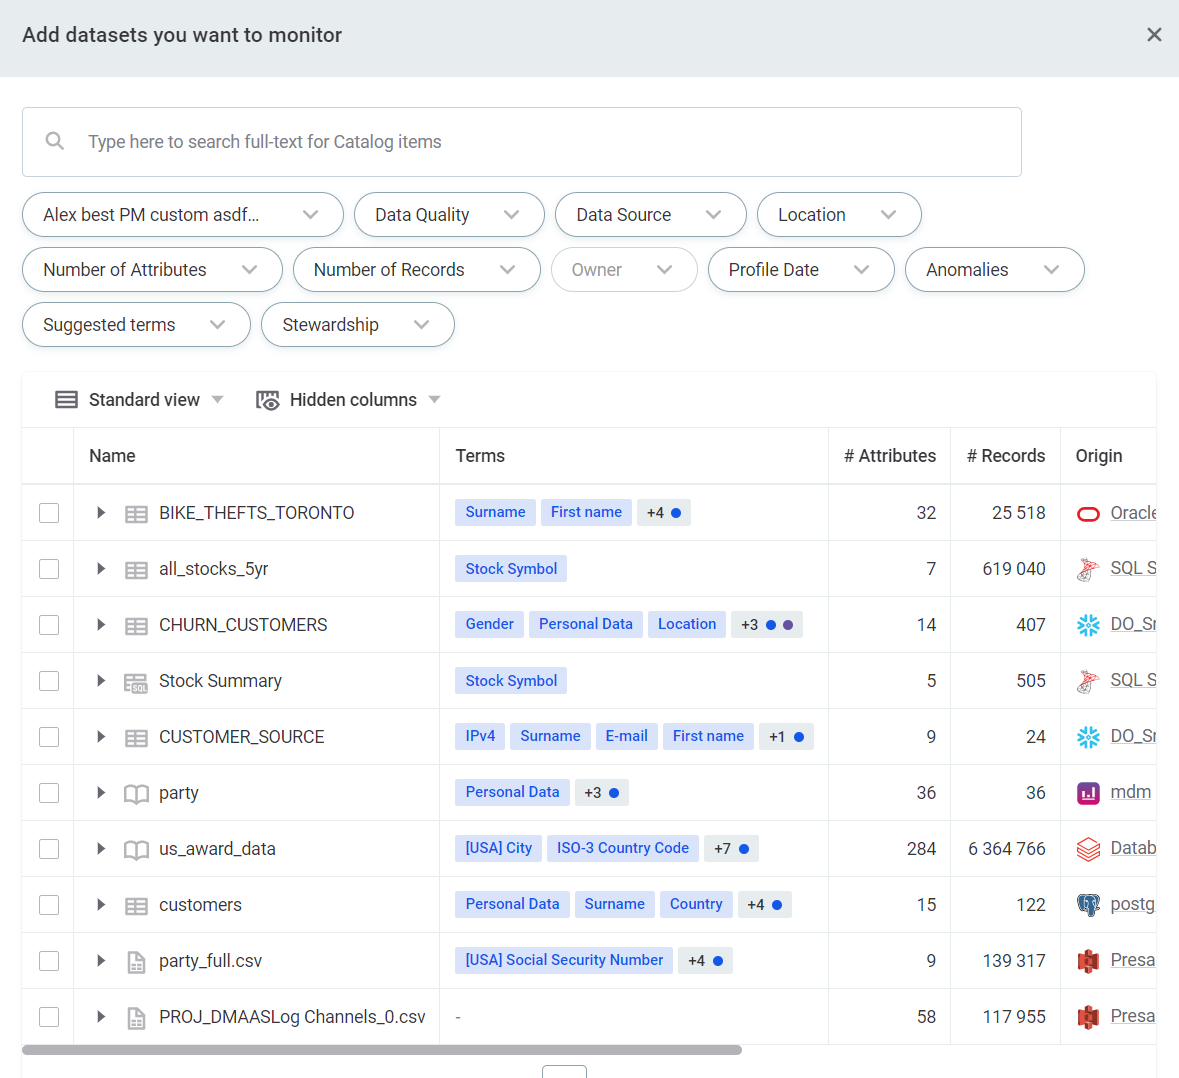
If you are working with a new project, select Add catalog items and select the required items.
-
If you want to add additional items to a preconfigured project, in the Items to Monitor section, select Add.
-
-
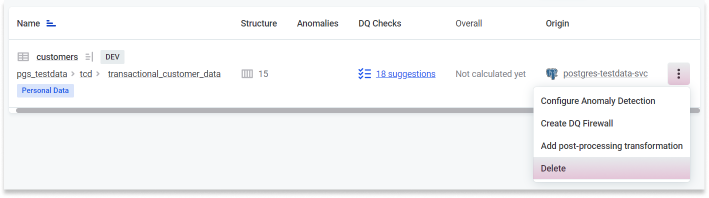
To remove an existing item, use the three dots menu and select Delete.
-
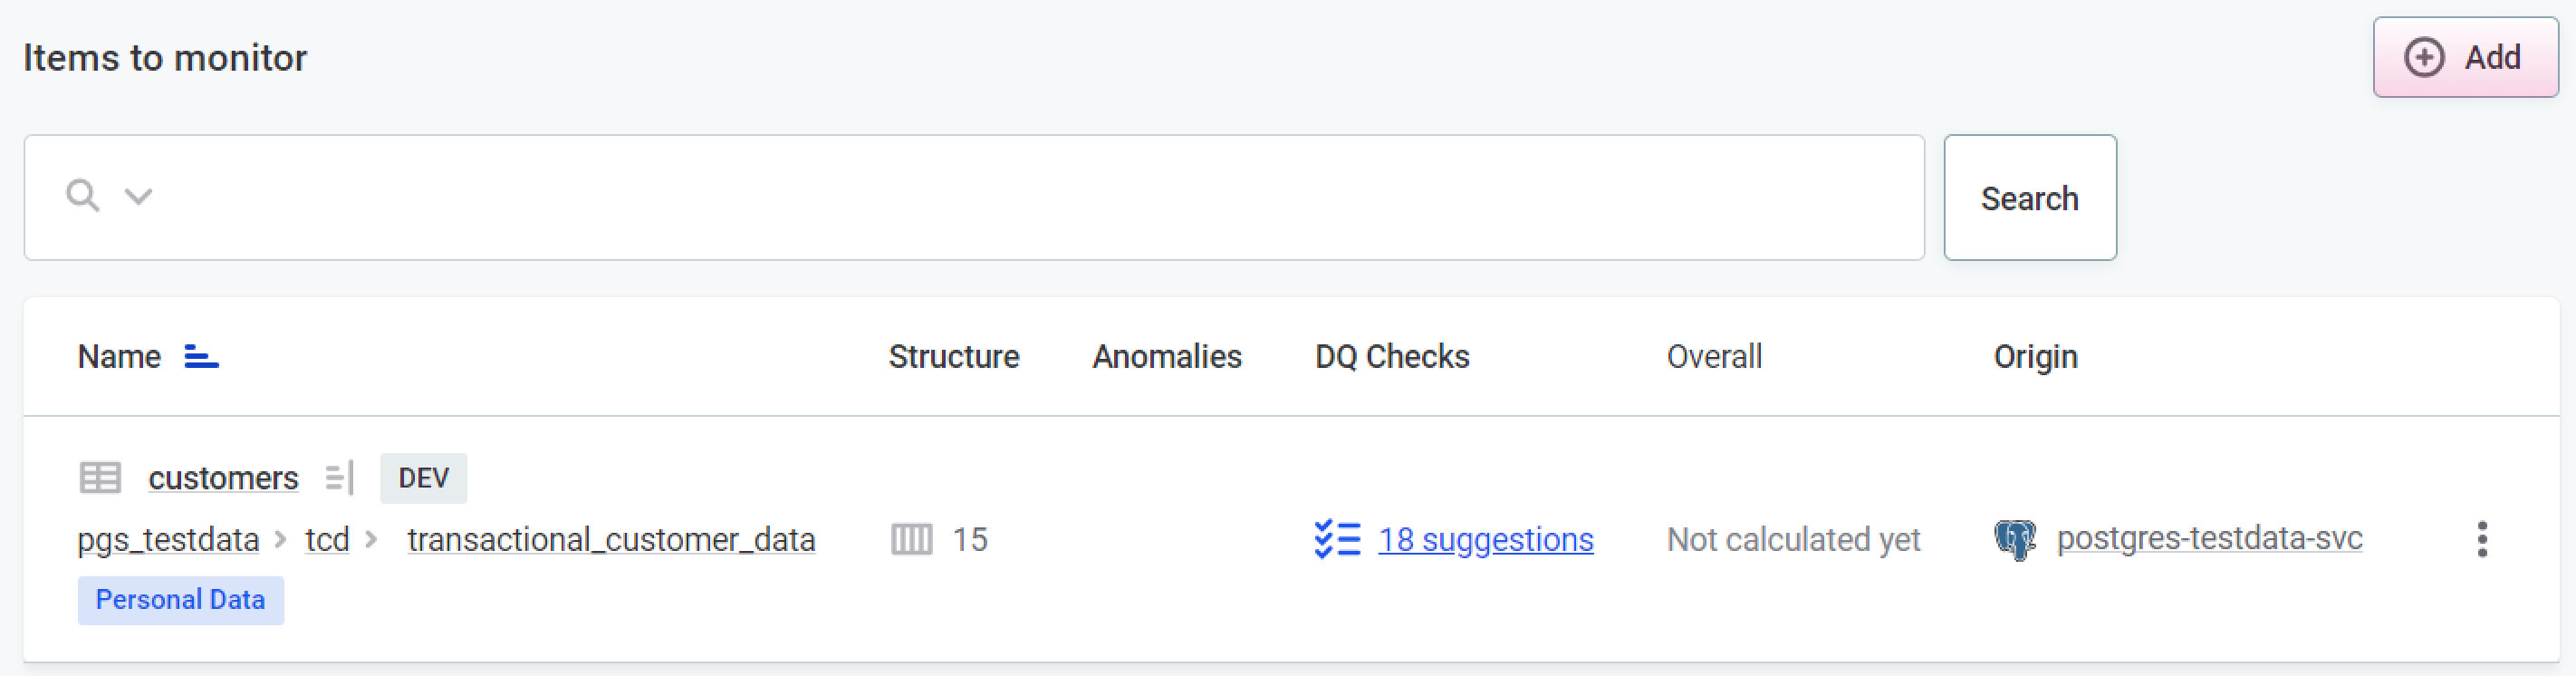
Once you have selected the necessary items for the project, you can find these listed under Items to Monitor, along with the following information:
-
Structure: Number of rows and columns in the catalog item.
-
Anomalies: Shows if anomalies were detected on any of the catalog item attributes.
-
DQ Rules: Shows the number of DQ rules applied to the catalog item attributes.
-
Overall: Shows an aggregated value for quality based on DQ rules applied to the item attributes. Only results of DQ rules which are contributing to overall quality are included in the aggregation.
-
Results for individual data quality dimensions, listed under their assigned abbreviation.
-
Origin: Catalog item source.
-
| Open any catalog item in the list by selecting its name. This lets you see the attribute view, and add or edit rules on the attributes. |
Apply structure checks, DQ rules, and anomaly detection
Once you have selected the required catalog items, you need to select each item individually to start adding checks. Select an item by clicking the item name.
Three types of checks can be applied:
To remove wrongly applied checks:
-
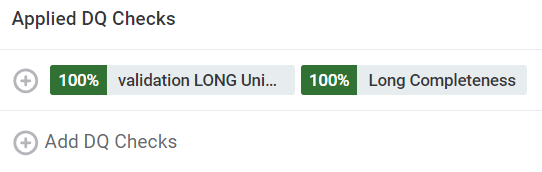
Hover over the applied check in the table and delete using the X icon.
After both adding or removing checks, make sure to publish your changes.
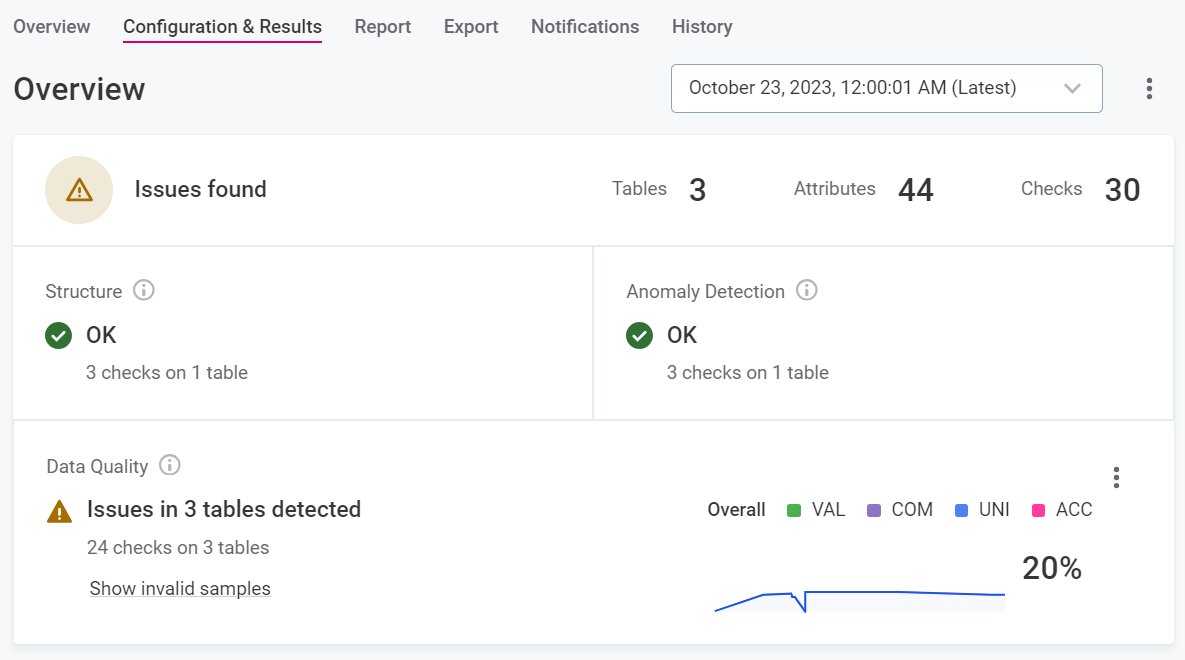
After a monitoring project has been run, an overview of the results for structure checks, anomaly detection, and data quality rules are displayed on the Configuration & Results tab.
More detailed results can be found on the monitoring project Report tab. For more information, see Monitoring Project Results, Reports, and Notifications.
Structure checks
Structure checks alert you when a column is renamed, removed, or has its data type changed in the source. The next monitoring project run detects these changes automatically, and the structure check finishes with issues. To resolve them, reconcile the attribute structure changes.
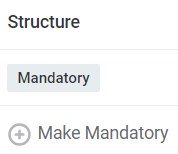
Structure checks are enabled on an attribute-by-attribute basis by selecting Make Mandatory for each attribute you want to check.
Reconcile attribute structure changes
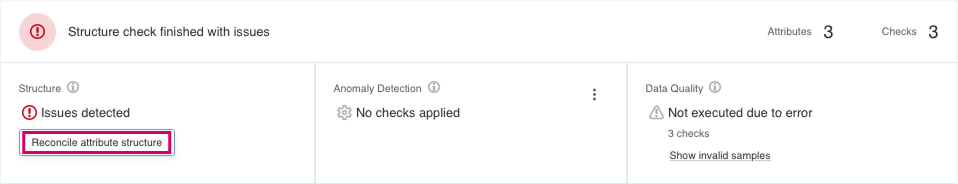
When a structure check detects issues, the Structure widget on the Configuration & Results tab shows Issues detected.
Reconcile to align the monitoring project attributes with the data source. Where possible, reconciling keeps the rules and results of the affected attributes. For each affected attribute, you can:
-
Map a renamed column to its existing catalog attribute, keeping its rules and results.
-
Keep an attribute whose data type changed, with the new type applied, along with its rules and results.
-
Remove an attribute whose column no longer exists in the source, along with its rules.
To reconcile:
-
Select Reconcile attribute structure.
-
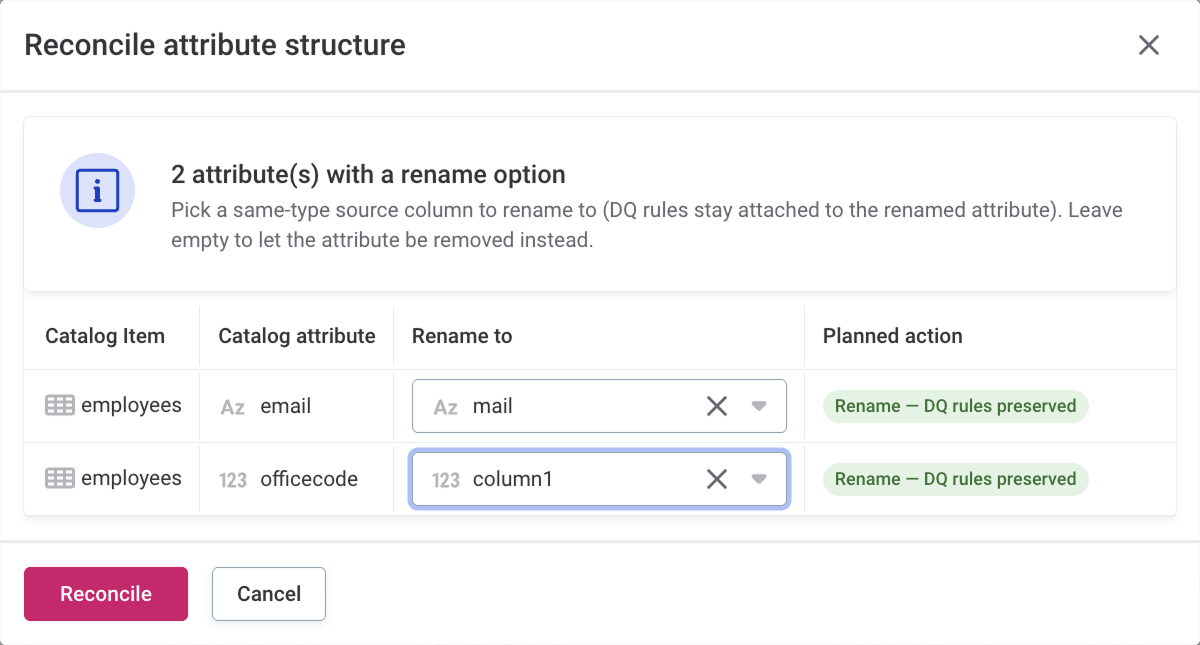
The Reconcile attribute structure dialog opens. It groups the affected attributes into up to three sections, depending on what was found in the source.
-
Renamed columns, listed under attribute(s) with a rename option.
To keep an attribute, select the new source column to map to in the Rename to column. You can only map to a source column of the same data type.
To delete an attribute and its DQ rules instead of renaming it, leave its Rename to column empty.
-
Columns with a changed data type, listed under attribute(s) will have type updated in place. The Type change column shows the change, for example, LONG -> FLOAT.
When you reconcile, the data type is updated on the existing attribute, and its DQ rules stay attached. Review the applied rules for semantic validity, for example, a numeric rule on a now-textual column.
-
Removed columns, listed under attribute(s) will be removed.
When you reconcile, they are removed from the catalog along with any DQ rules attached to them.
-
-
Select Reconcile.
Renamed and retyped attributes keep their DQ rules. The changes apply immediately, with no need to publish.
Limitations of reconciling attribute structure
The following changes cannot be reconciled:
-
A column that was renamed and changed to a different data type at the same time. Such a column is treated as removed, and any rules attached to the original attribute are lost.
-
A column replaced by a different column with the same name and data type. The structure check does not detect this as a change.
Anomaly detection
Anomaly detection is powered by AI and alerts you when potential anomalies are detected. For more information about how anomaly detection works in ONE, see Anomaly Detection: Behind the Scenes.
If you do not want to use the default settings and would like more information about how anomaly detection can be tweaked within your project, see Anomaly Detection in Monitoring Projects.
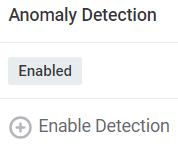
Anomaly detection is enabled on an attribute-by-attribute basis by selecting Enable Detection.
DQ rules
Data quality evaluation rules are defined in Data Quality > Rules (for more information, see Rule Types: DQ and Detection). You can manually apply them to attributes or use the rule suggestions.
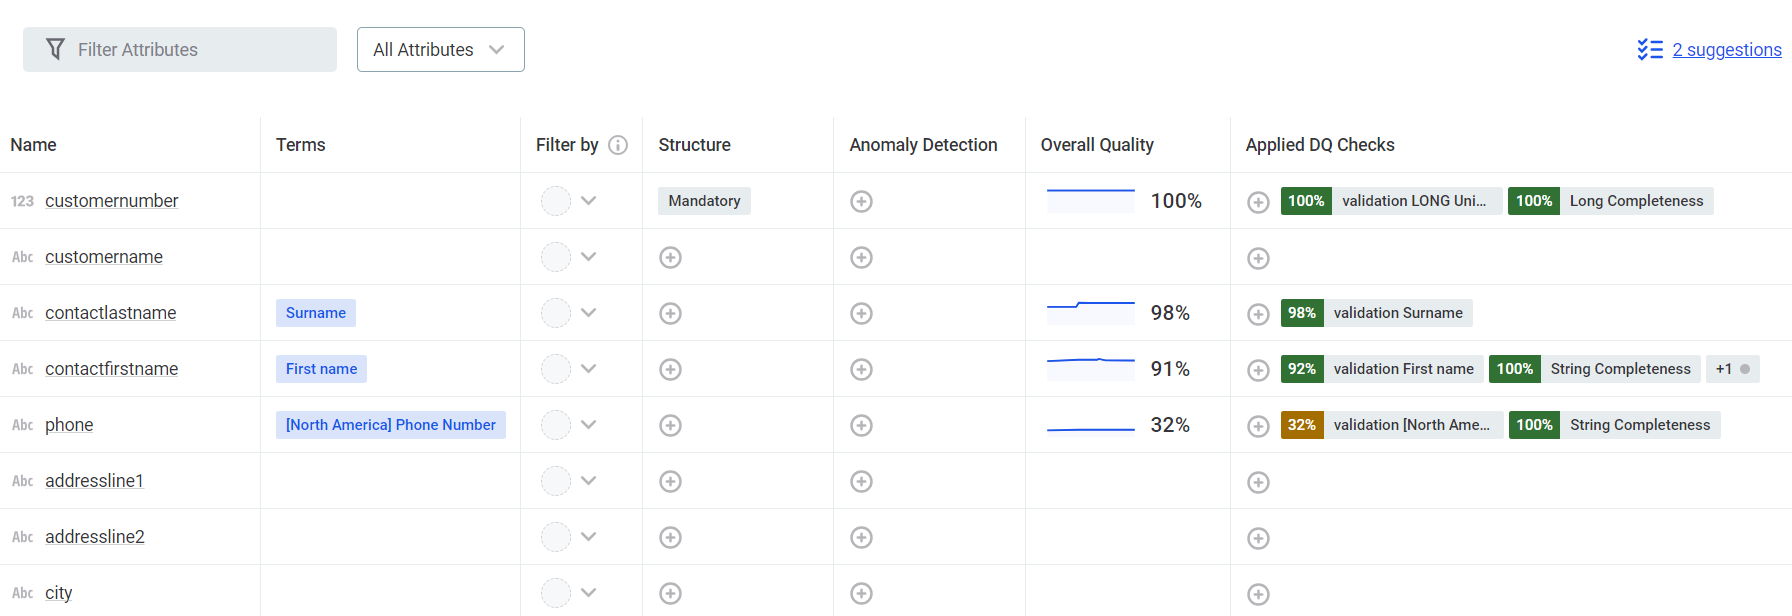
Of all the DQ rules applied, the Overall Quality section takes into account only the results of rules of DQ dimensions which contribute to overall quality. Columns for the results of individual data quality dimensions are named according to the abbreviation provided during configuration (for example, VAL, COM, ACC). For more information about data quality dimensions in monitoring projects, see Additional Configuration Options.
To apply DQ rules, either:
-
Use the plus icon under Applied DQ Rules and select rules from the list provided.
-
Accept rule suggestions.
-
Click the rule suggestions icon.
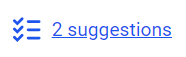
-
A list of suggested rules for the catalog item is shown. Accept or reject suggestions one-by-one, using the relevant icon (tick for accept and cross for reject), or accept or reject in bulk using the dropdown.
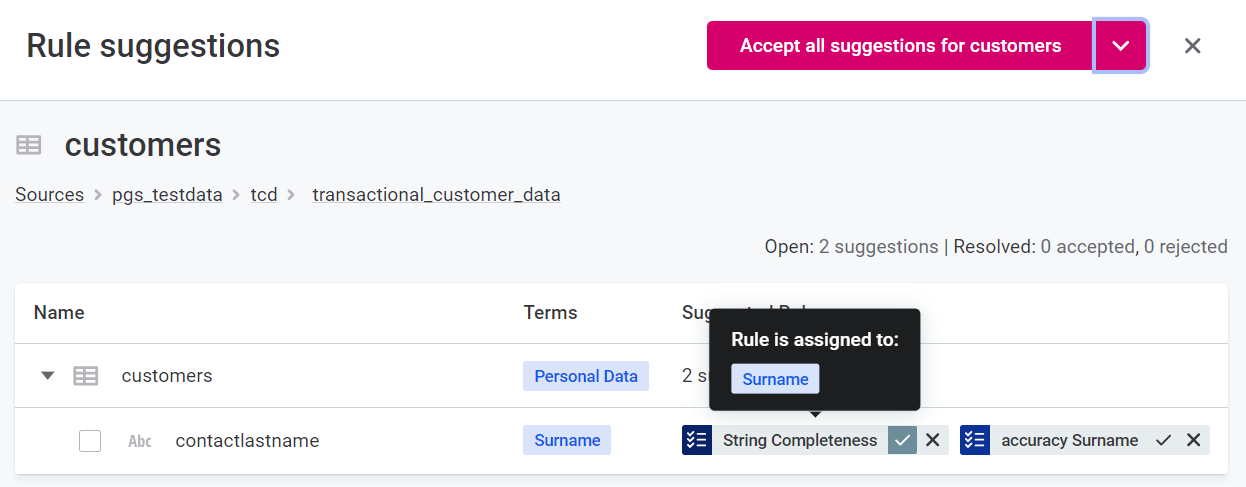
For more information about rule suggestions, see Rule Suggestions.
-
Update rule references
If your monitoring project contains mappings to rules that have since been edited, you are notified on the Configuration & Results screen.
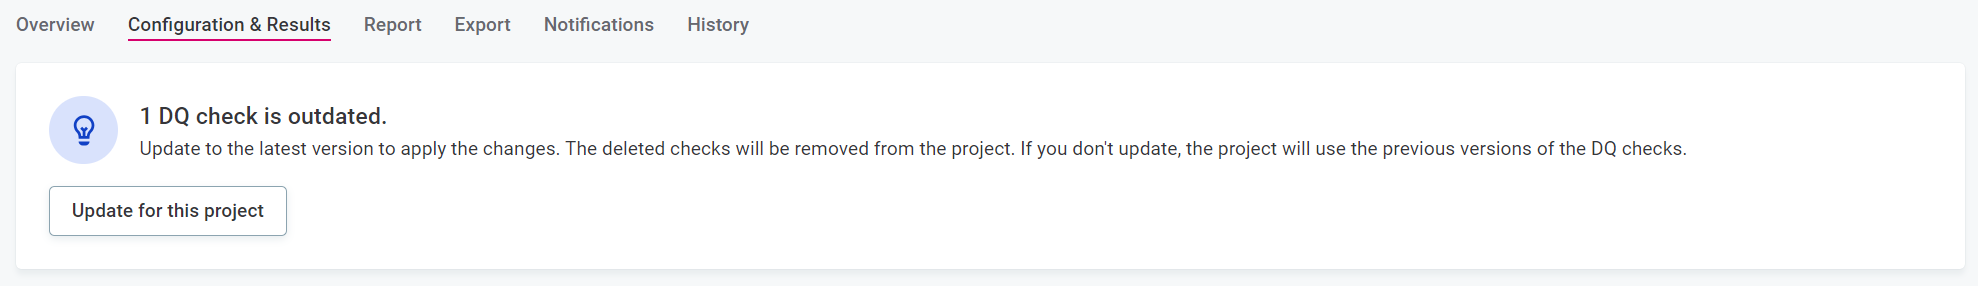
| This notification isn’t visible if you have view-only permissions for monitoring projects. |
To update all rules to the latest version, select Update for this project for the monitoring project or Update for this catalog item for a specific catalog item.
To update only selected rules, find the outdated rules in the list of attributes, marked with a lightbulb icon.
Select the rule to open the rule information, and then select See the details. You are redirected to the Preview changes screen: review the changes and then select Update Rule.
Application admins can turn on and off these notifications for all users through the core:reference trait.
If you change the trait after applying rules in the project, the trait doesn’t apply to those rules.
Make sure you define the required reference strategy before you configure your project. For more information, see Traits.
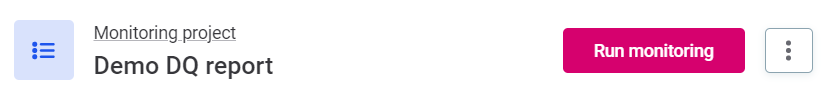
Run monitoring
| If you have made any changes or created a new project, you need to publish them before you can run monitoring. |
Select Run monitoring.
You are notified once monitoring finishes. Alternatively, schedule the project to be run at certain times by using the three dots menu and selecting Schedule.
| If monitoring fails, check out Troubleshooting for possible solutions. |
Scheduled runs permissions
Scheduled monitoring runs are performed with the permissions of the user who created the schedule. After each run, the schedule’s next run time is updated, which requires that user to still have the administrator rights they had when creating the schedule.
If you remove those administrator rights, the next run time can no longer be updated, the monitoring project stops running automatically, and its next run stays in the past.
To avoid this, create schedules with a dedicated administrator account whose permissions remain unchanged.
Run monitoring on partitioned tables
| Monitoring on partitions is supported only for metastore sources. To work with partitions using SQL catalog items, partitioning should be done in the query directly. Alternatively, you can use Data Slices. |
When partitioned tables are present in monitoring projects, you can identify them by the following icon:
Where partitioned tables are present, there are two options: Run monitoring and Run custom partition monitoring.
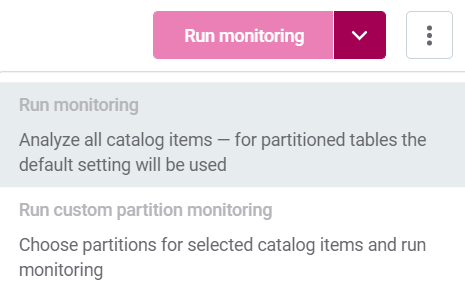
The Run monitoring option runs the project with default settings, that is, the default selected for the partitioned item, which can be either full analysis or last partition. For more information, see Set partition defaults.
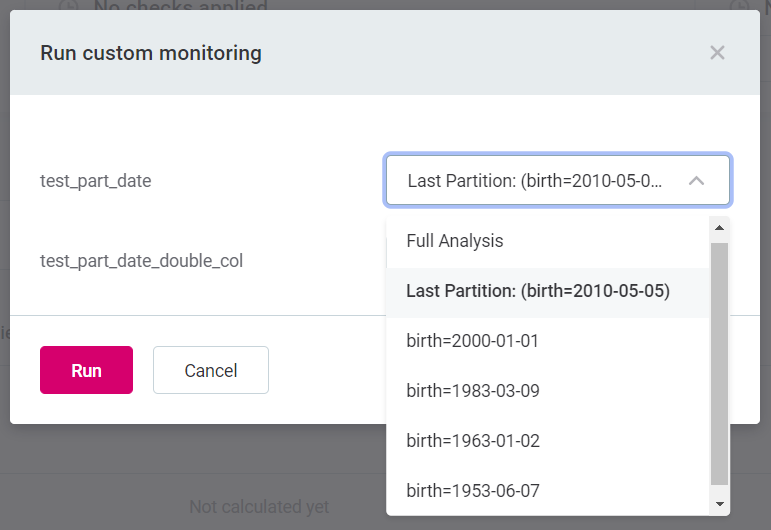
Selecting Run custom partition monitoring opens a new dialog. Select the required partitions from the list provided, and then select Run.
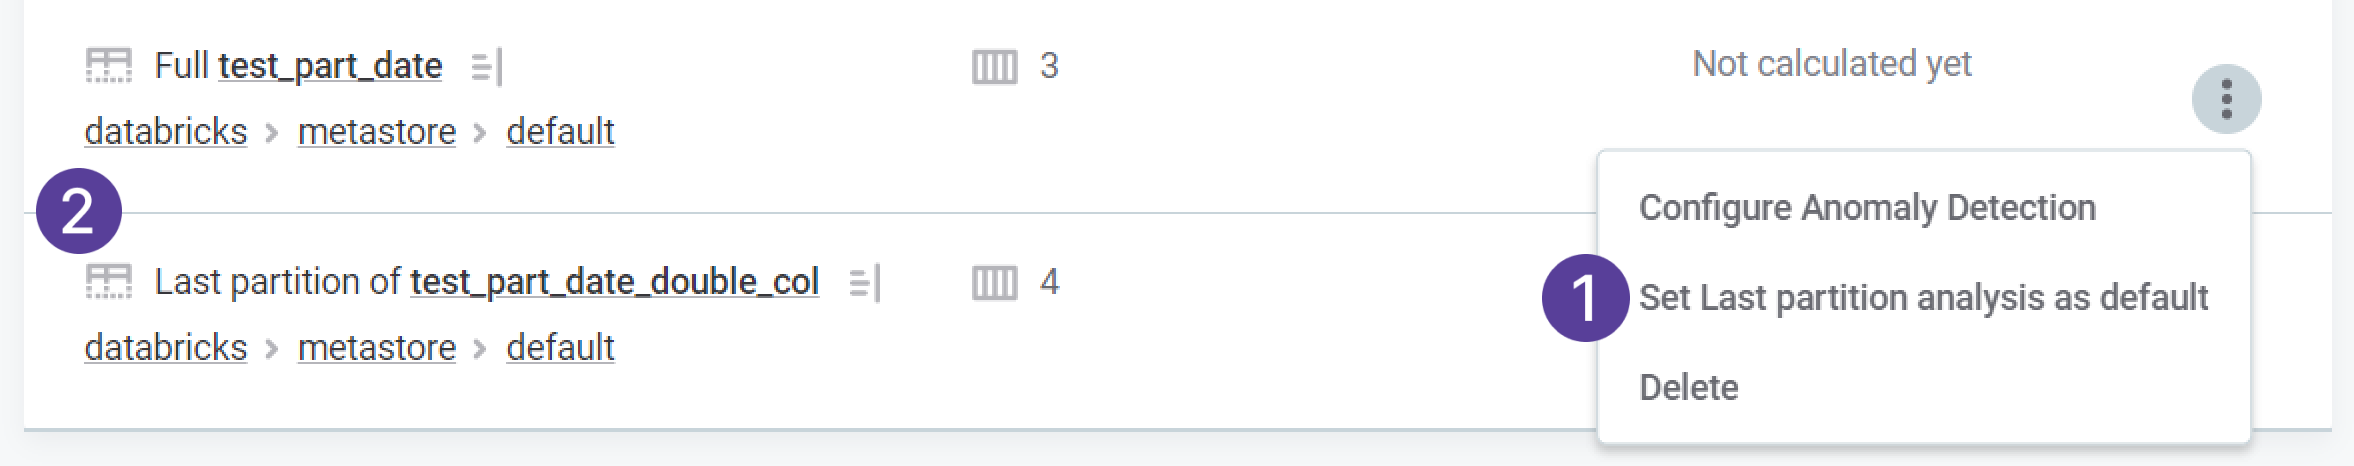
Set partition defaults
You can define how you would like to run monitoring on the partitioned table by using the three dots menu and selecting either Last partition analysis as default or Full analysis as default (1).
The chosen default is shown next to the catalog item name (2), and these settings are used on partitioned tables automatically if you select Run monitoring.
Use data slices in monitoring projects
If data slices have been created in the catalog items included in your monitoring project, you can run monitoring just on those data slices rather than the whole item.
To do this:
-
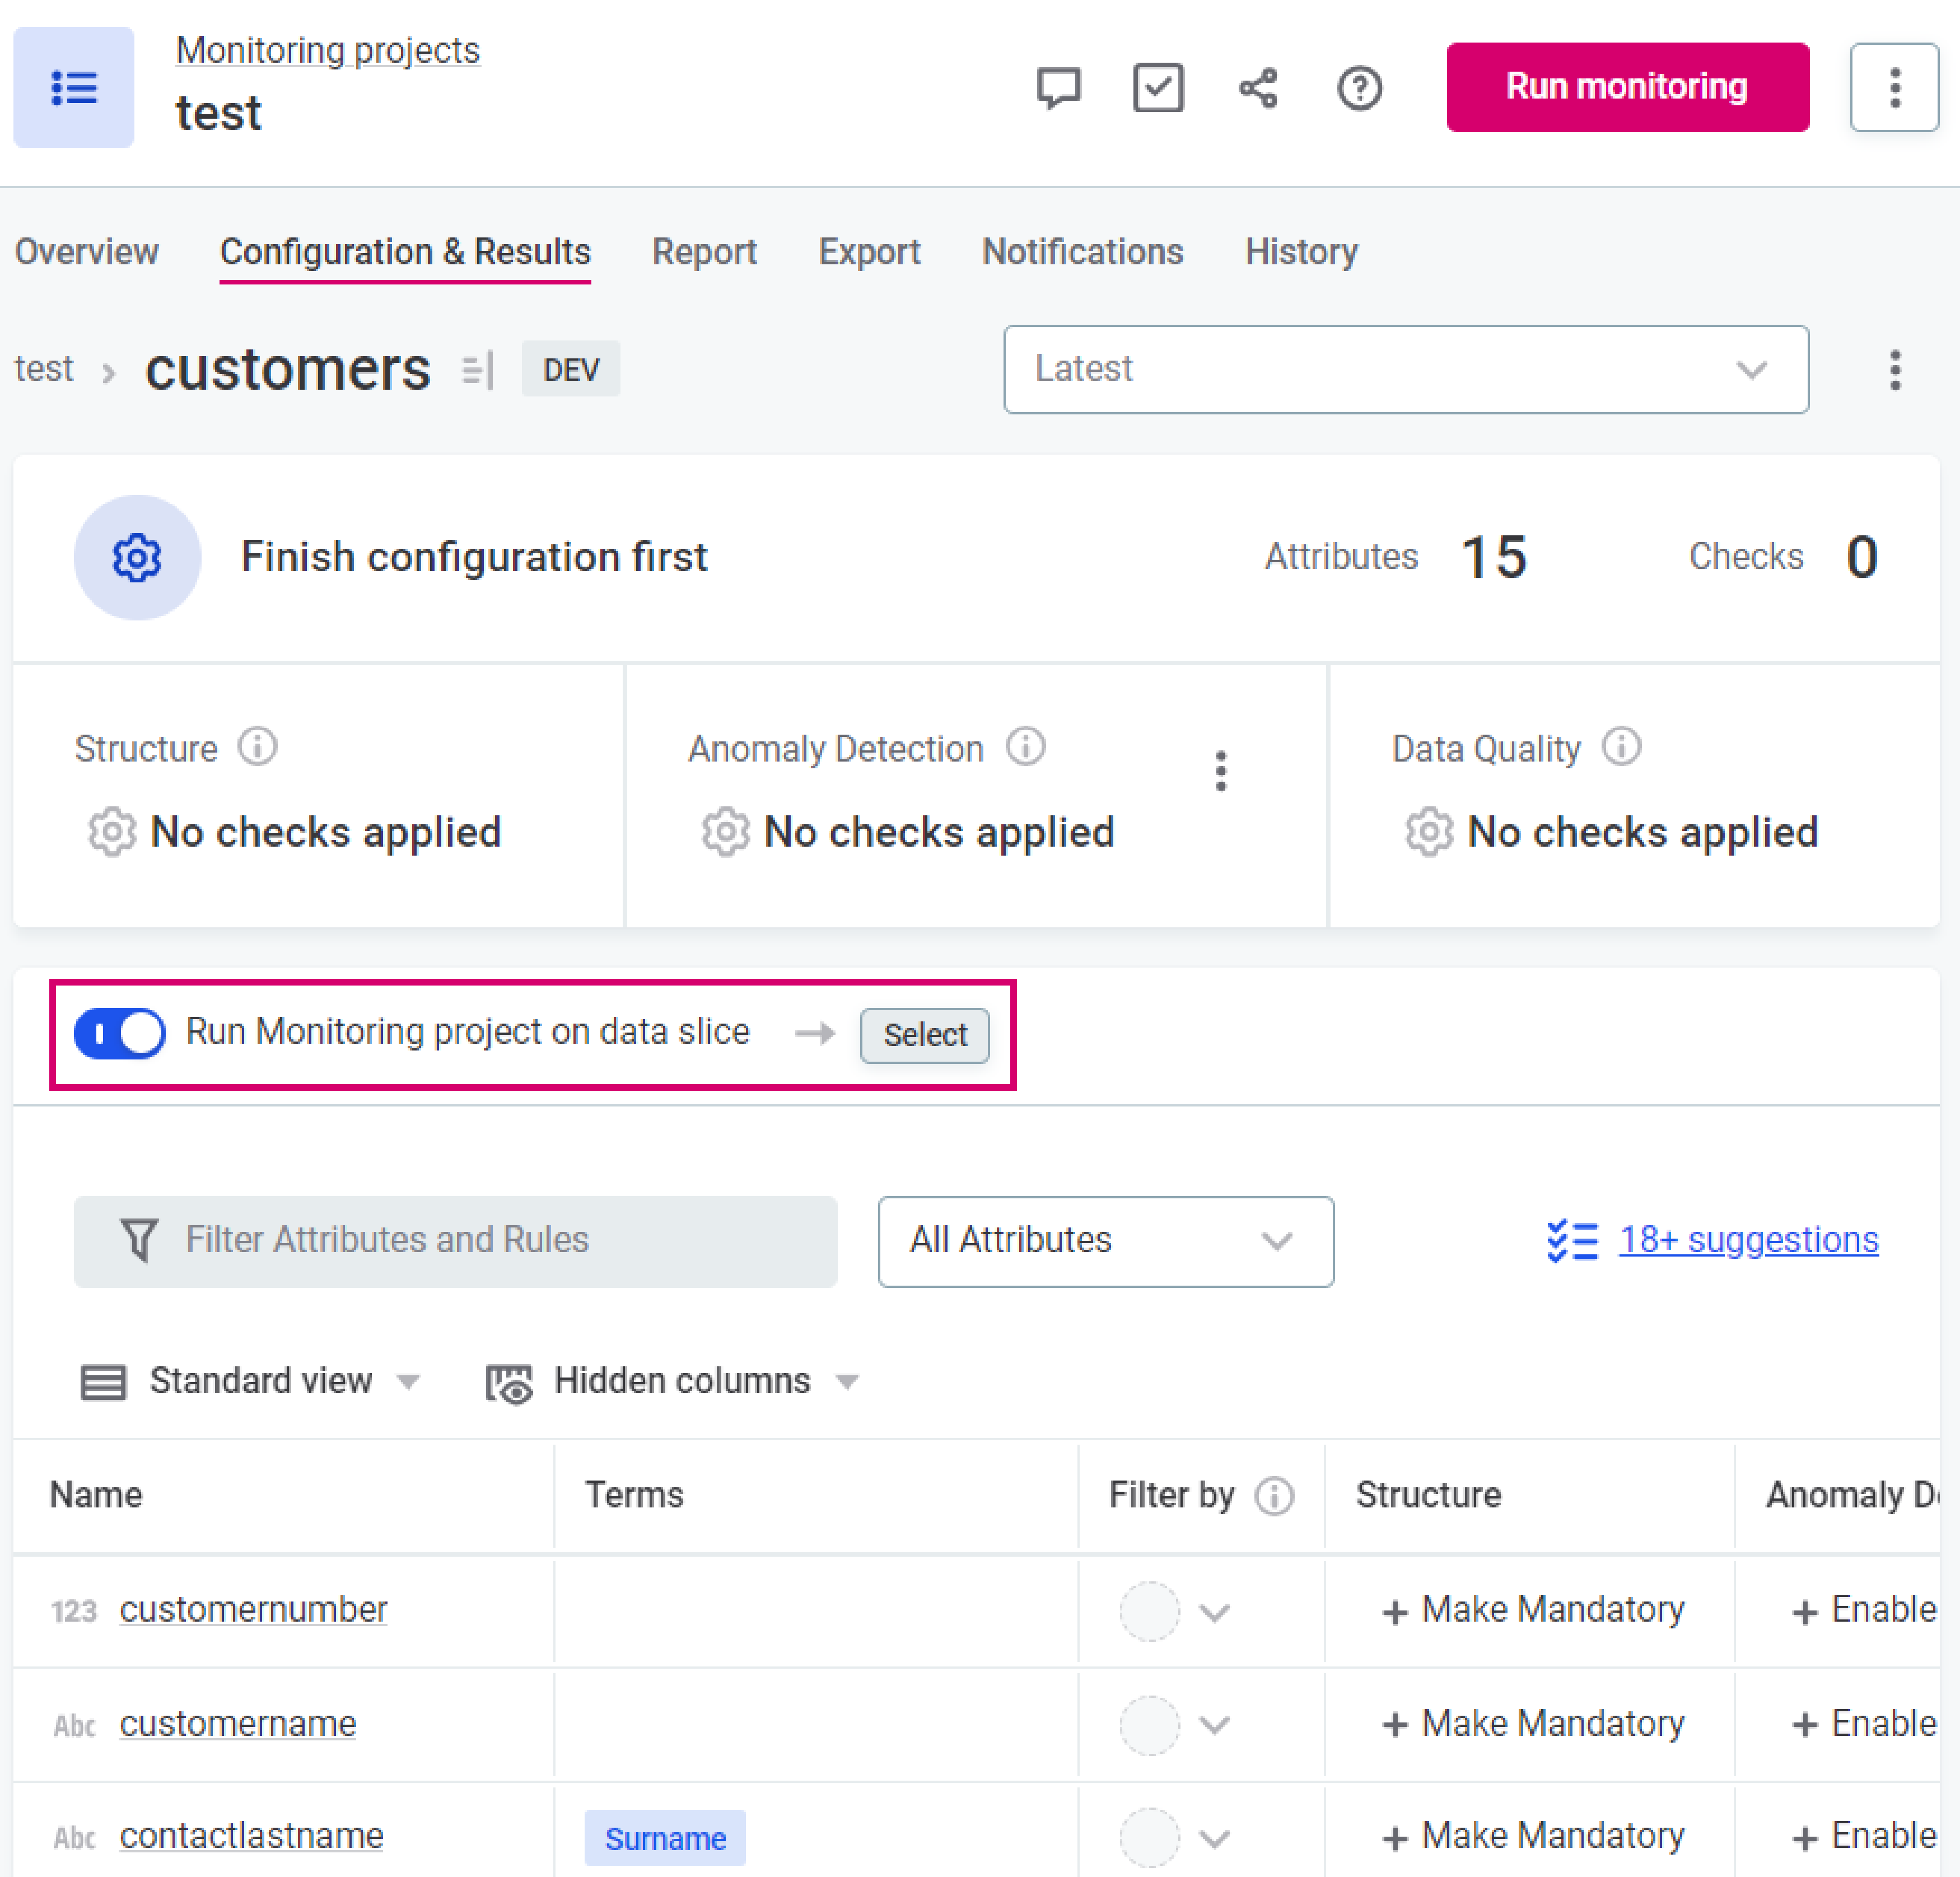
On your monitoring project Configuration & Results tab, select the catalog item with data slices.
-
Enable Run monitoring project on data slice.
-
Click Select.
-
Select the data slice you want to use, or create a new one (see Create a Data Slice).
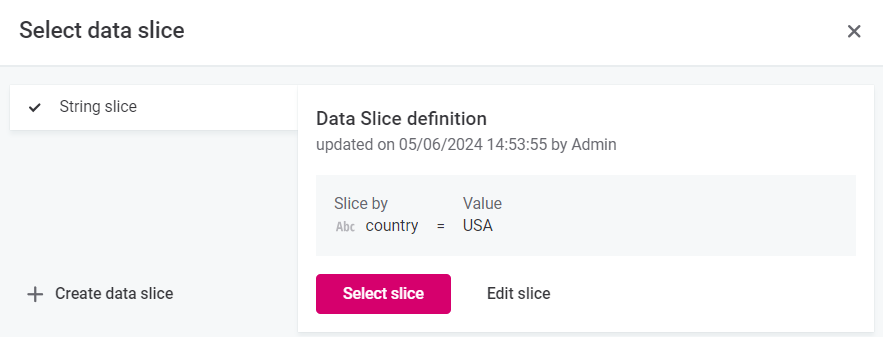
You can edit existing data slices, but note that editing the slice here changes the original instance of the slice. -
Repeat steps 3 and 4 to add additional slices.
-
Publish your changes.
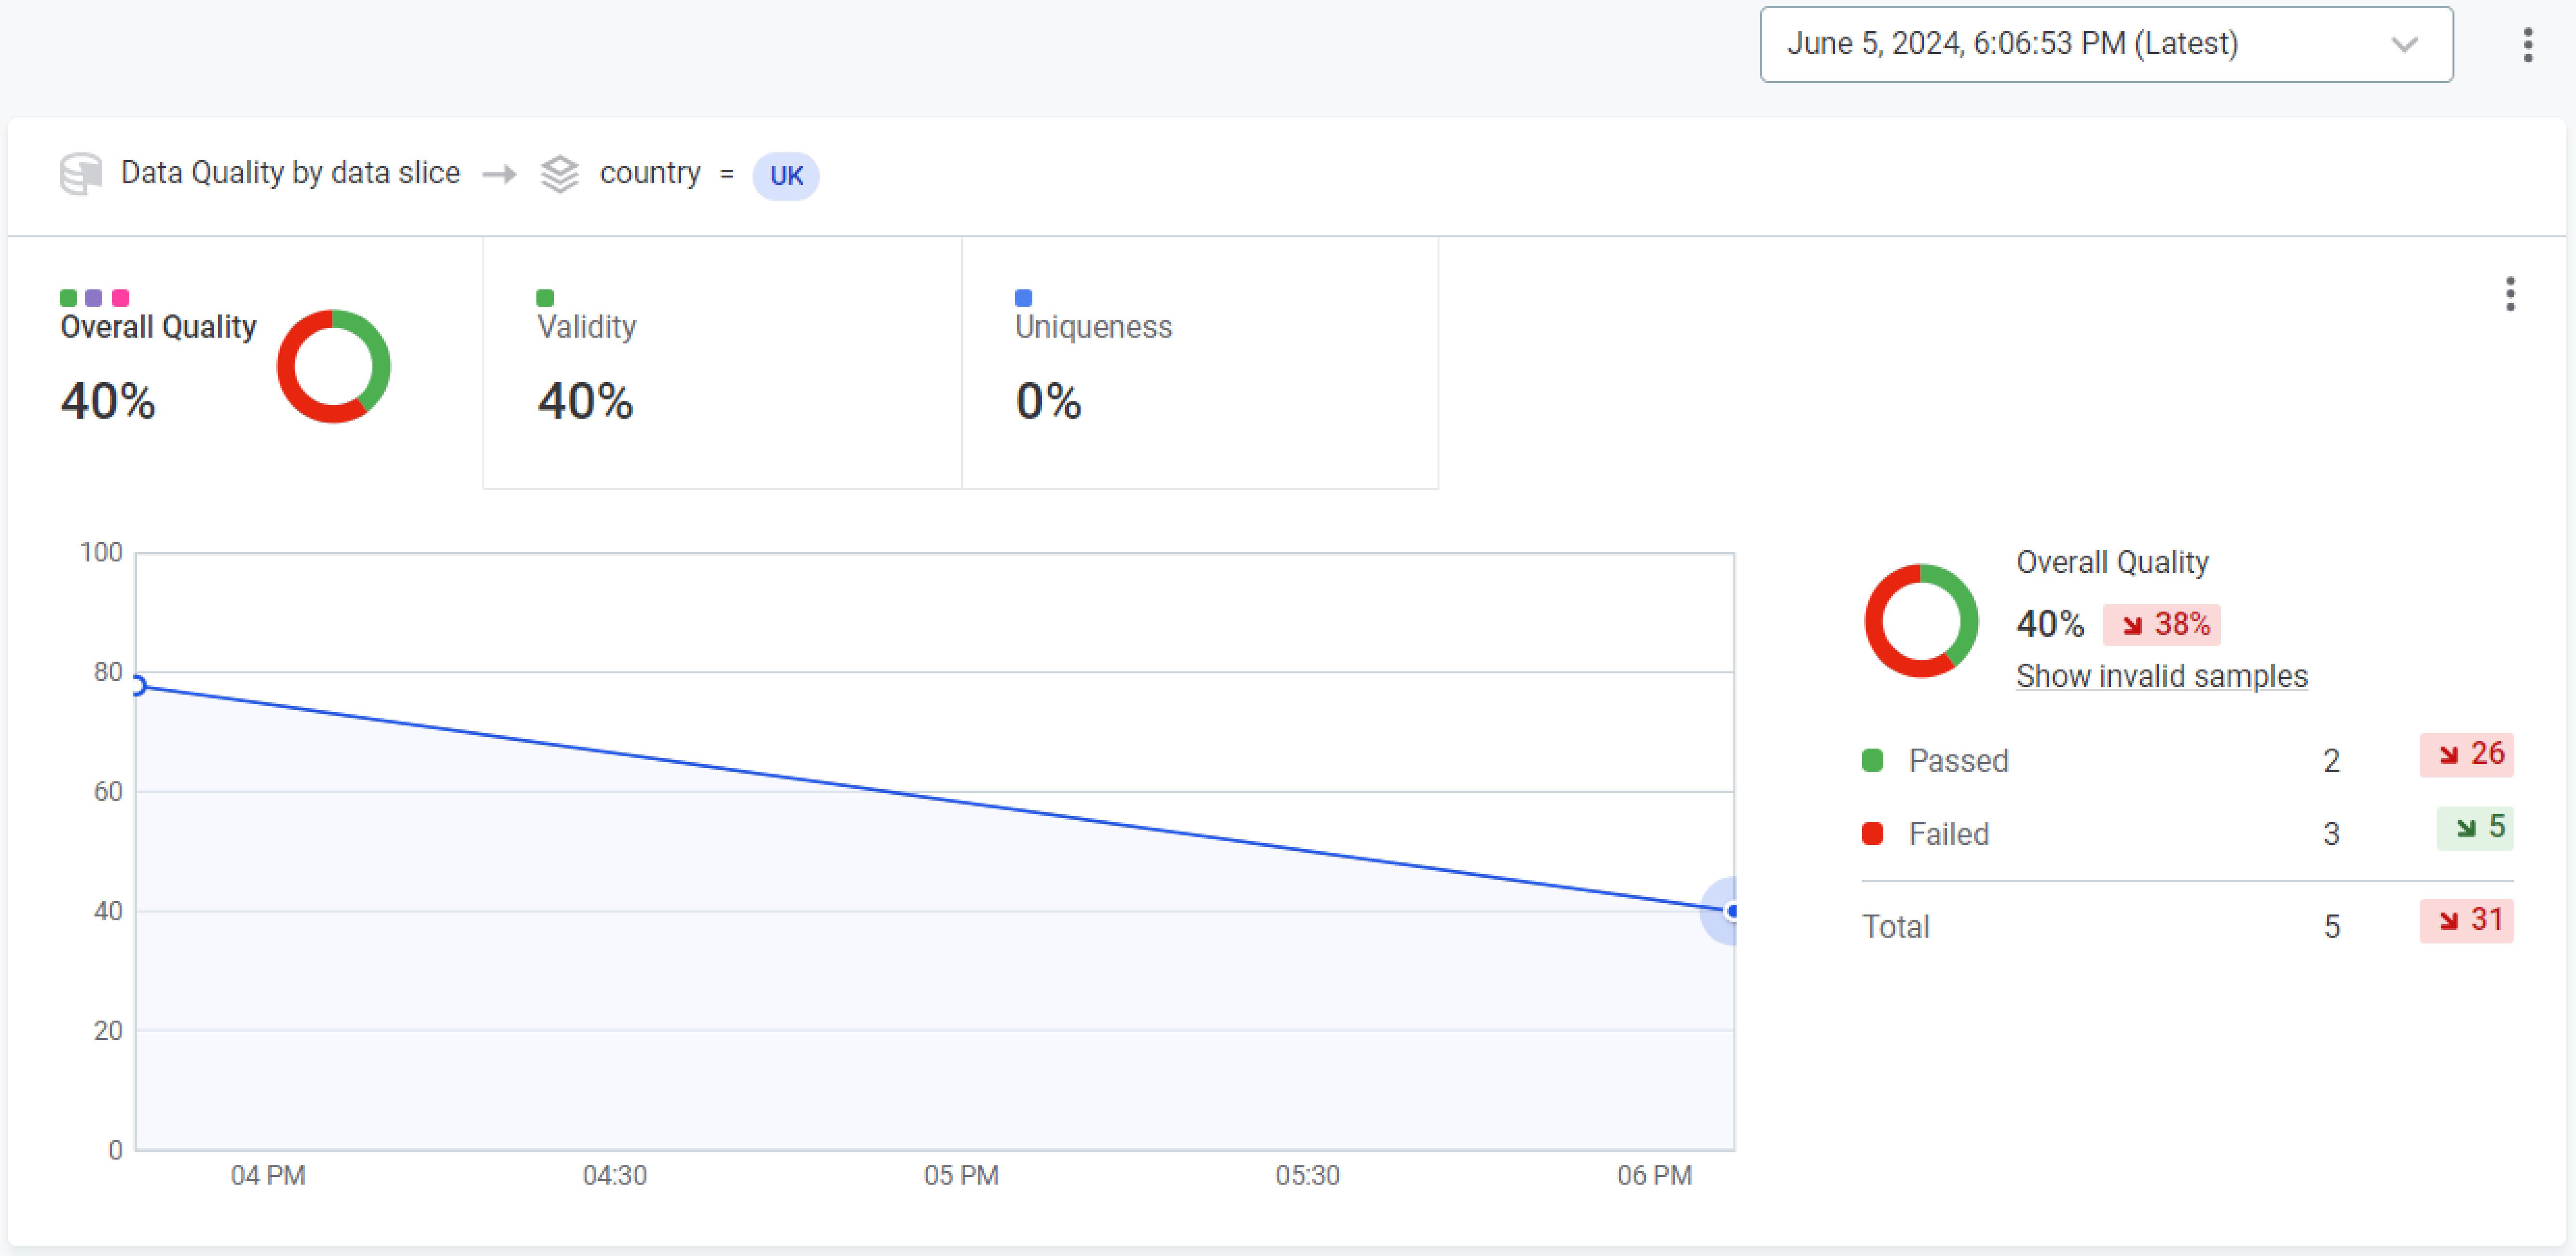
When you select Run monitoring, it now runs only on the selected data slices. This applies to all monitoring, that is, DQ evaluation, structure checks, and anomaly detection.
Results from these slices can be seen on the Report tab: expand the results view and select your data slice (1). Details of the slice configuration can be found above the results for each run of the monitoring project (2).

| Once you run the monitoring project on a data slice of a catalog item, it is not possible to turn off Run monitoring project on data slice. |
Limitations
The following limitations are currently applicable when using data slices in monitoring projects:
-
If you have multiple runs of the monitoring project, but you changed the configuration of the data slice, this change is not clear in the Overall Quality graph, nor in the percentage increase of decrease of Overall Quality.
-
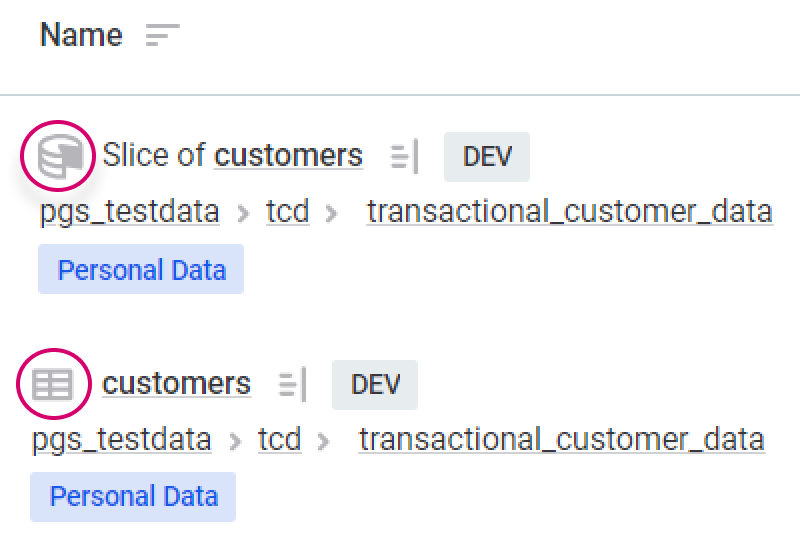
If you import the configuration of a monitoring project that uses data slices into a new project, as per Import Monitoring Project Configuration, the data slices are still active in the new project, but the data slice icon is not visible next to the item names. They instead appear as ordinary catalog items.
-
If Data Processing Engines (DPEs) have not been updated to the latest version, data slices are ignored and monitoring runs on the full catalog item. This is a known issue reported in Ataccama 15.3.0 Release Notes.
-
If a catalog item has been added to a monitoring project and had data slices enabled, and the catalog item has since been removed from the project and then re-added, it is not possible to see the Run monitoring project on a data slice option until you publish all changes and refresh the page.
-
If a data slice is added to a catalog item already used in a monitoring project that has previous runs, the Run monitoring project on data slice option does not appear until all previous runs are deleted. Once all runs have been deleted, the option becomes available.
-
Only one data slice per catalog item can be added to a monitoring project configuration. Additionally, a catalog item and its data slice cannot both be included in the same monitoring project.
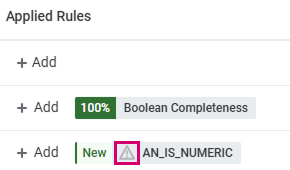
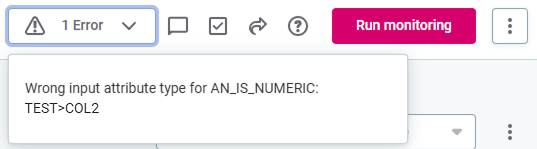
Monitoring projects with rule warnings
If there is a problem with an applied rule, a warning is displayed in the monitoring project header and next to the rule on the Configuration & Results tab. This can happen, for example, due to a wrong input attribute type after reimporting a changed catalog item.
Rules with warnings are ignored during monitoring project execution and excluded from data quality results. They do not prevent the monitoring project from running.
Troubleshooting
If a monitoring project fails, there are a couple of things you can check in order to find the cause. If no cause is identifiable, contact the Ataccama Support team.
In the DPM job log, scroll until you see exceptions.
If the job is here, in most instances a description of the error is provided (for example, unable to reach data source, source table structure changed and the fields no longer available).
If the job is not listed in the DPM log, check the Processing Center to see if there are any errors listed.
If you still cannot locate a reason, try the following:
-
Profile the catalog items that the monitoring projects is using. Take note of any errors if that fails.
-
Double-check the rule mappings in the project to see if they make sense.
-
Check if the monitoring project configuration page flags any errors.
-
Check that a set of connection credentials are configured as default.
-
Check if any mandatory fields are missing or incorrect in the configuration of DQ dimensions used in rules in the project.
Breaking errors are as follows:
-
Missing Name for dimension or result.
-
Missing Order for dimension or result.
-
Missing Color for result.
-
No result in the dimension selected as Main result.
-
Missing Default condition result.
-
Missing Default fallback result.
-
Results for Validity dimension changed from Valid and Invalid to something else, or missing results for Validity dimension.
-
One or more result or dimension Name is not unique.
Was this page useful?