
Monitoring Projects
Monitoring projects provide reactive monitoring of selected data. Use monitoring projects for manual monitoring of your most critical data assets. Select catalog items on which to run anomaly detection and schema checks, and evaluate data quality based on the data quality checks you assign.
Create monitoring project
|
If you would like to add additional items to a current project or edit or copy the configuration of a current project, head to Add catalog items or Additional Configuration Options, respectively. If you want to understand the results of your project better, see Monitoring Project Results, Reports, and Notifications. |
To create a new monitoring project:
-
In the navigation menu, select Data Quality and then Monitoring Projects.
-
Select Create.
-
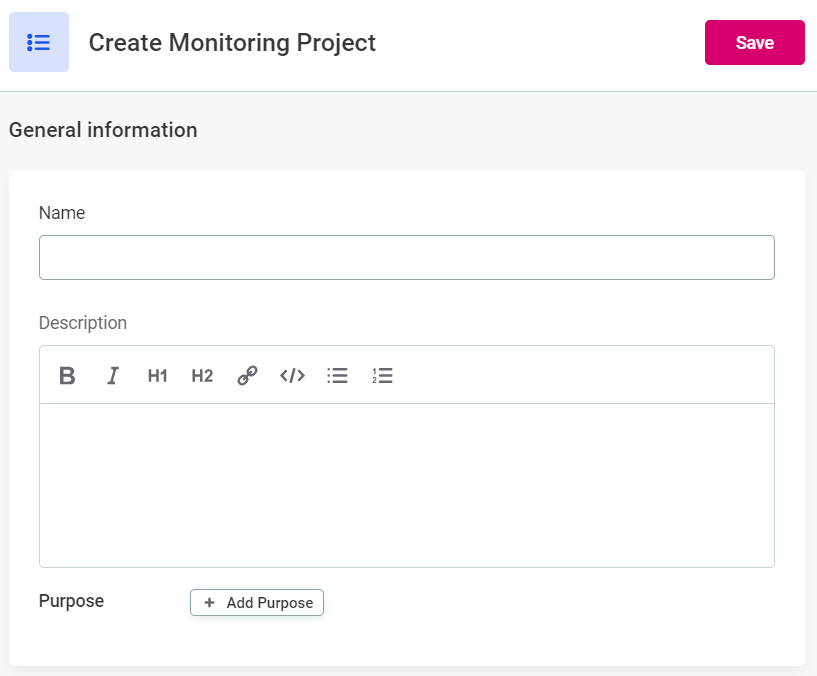
Provide a name for the project.
-
Describe the aim of the monitoring project (optional).
-
Add a
Purpose(optional). This assists you when working with multiple monitoring project instances (for example,devandprod). For more information, see Monitoring project lifecycles in Import Monitoring Project Configuration. It is possible to assign a purpose later in the project Overview tab. -
Select Save.
You can edit the information provided here anytime by selecting the project, using the three dots menu, and selecting Edit.
Add catalog items
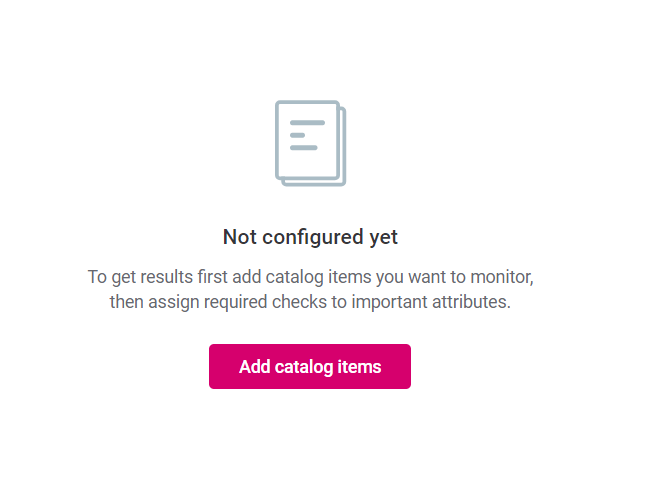
After you have created your project, add the catalog items you want to monitor.
To do this:
-
Navigate to the Configuration & Results tab.
-
Select catalog items:
-
If you are working with a new project, select Add catalog items and select the required items.
-
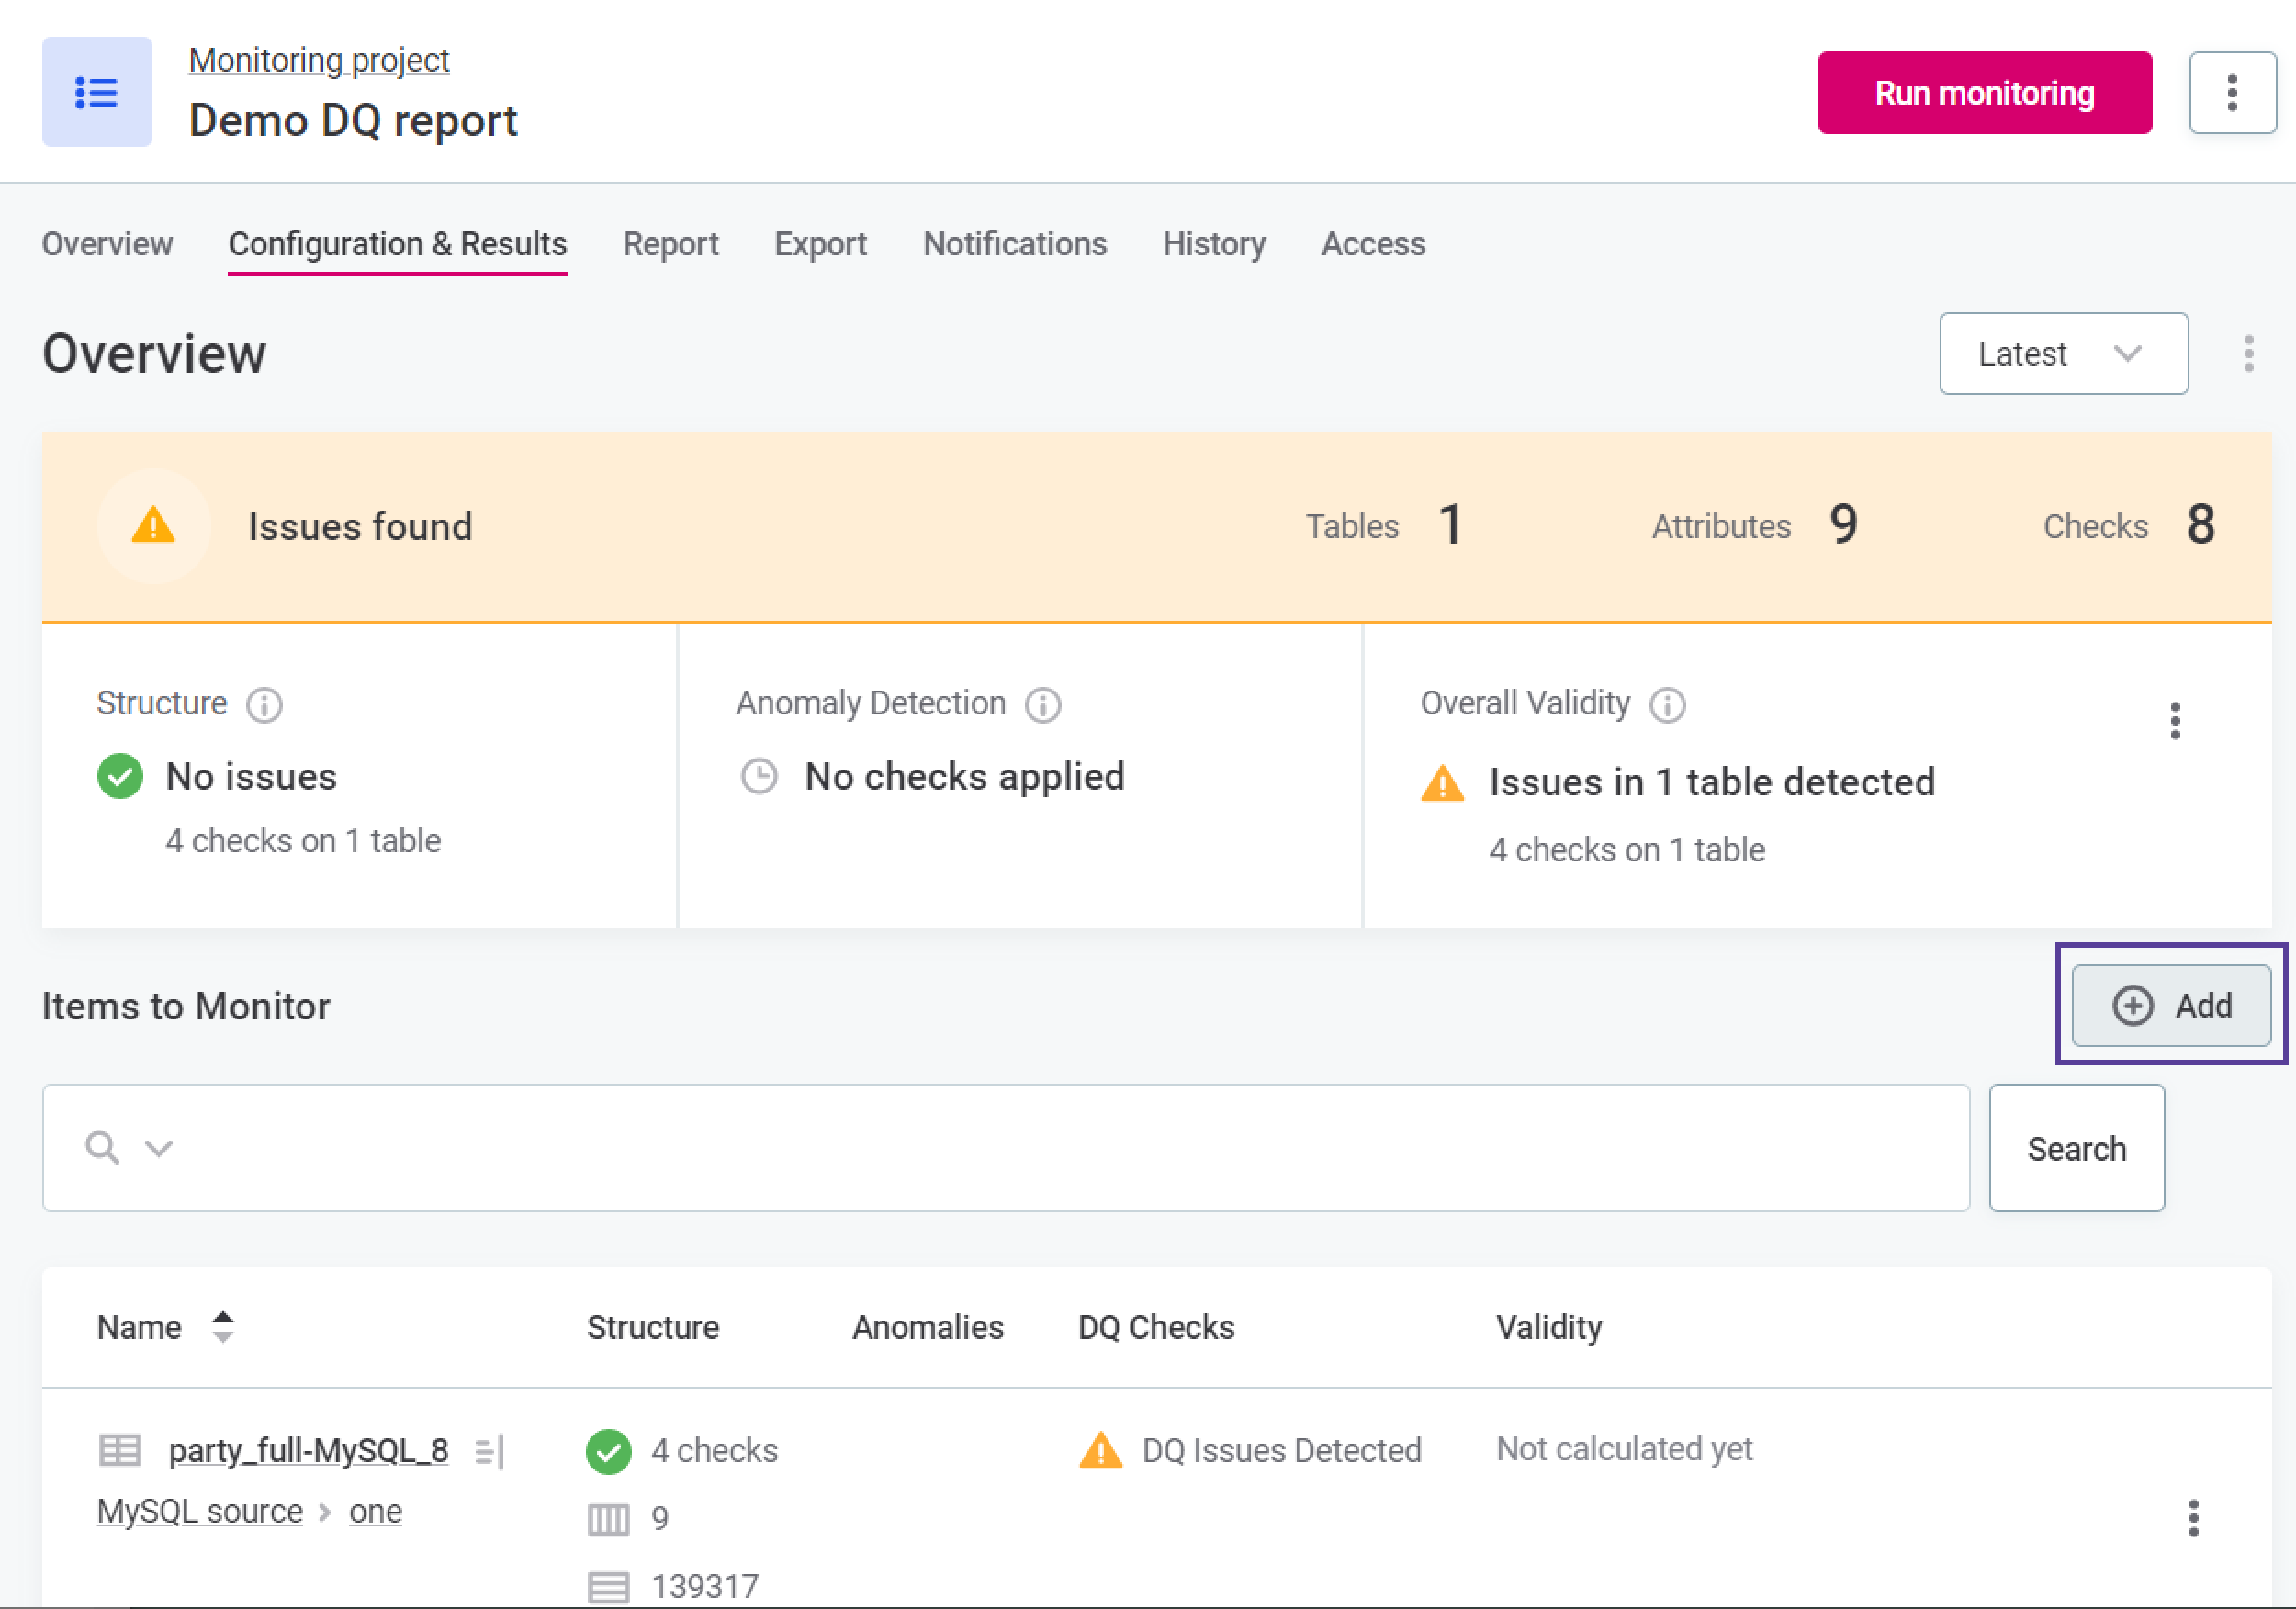
If you want to add additional items to a preconfigured project, in the Items to Monitor section, select Add.
-
-
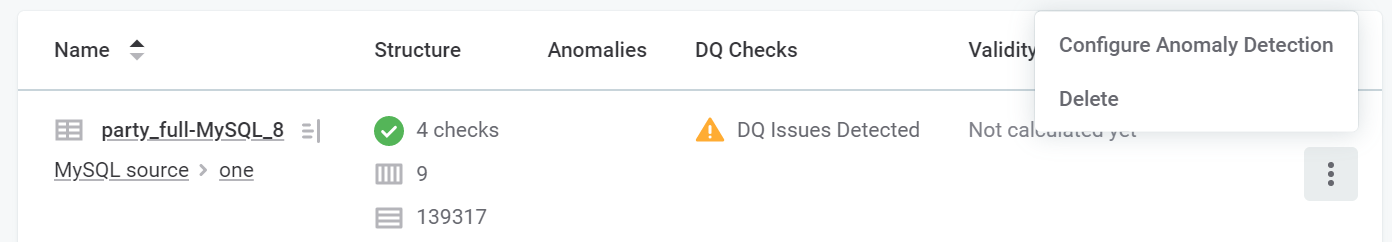
To remove an existing item, use the three dots menu and select Delete.
-
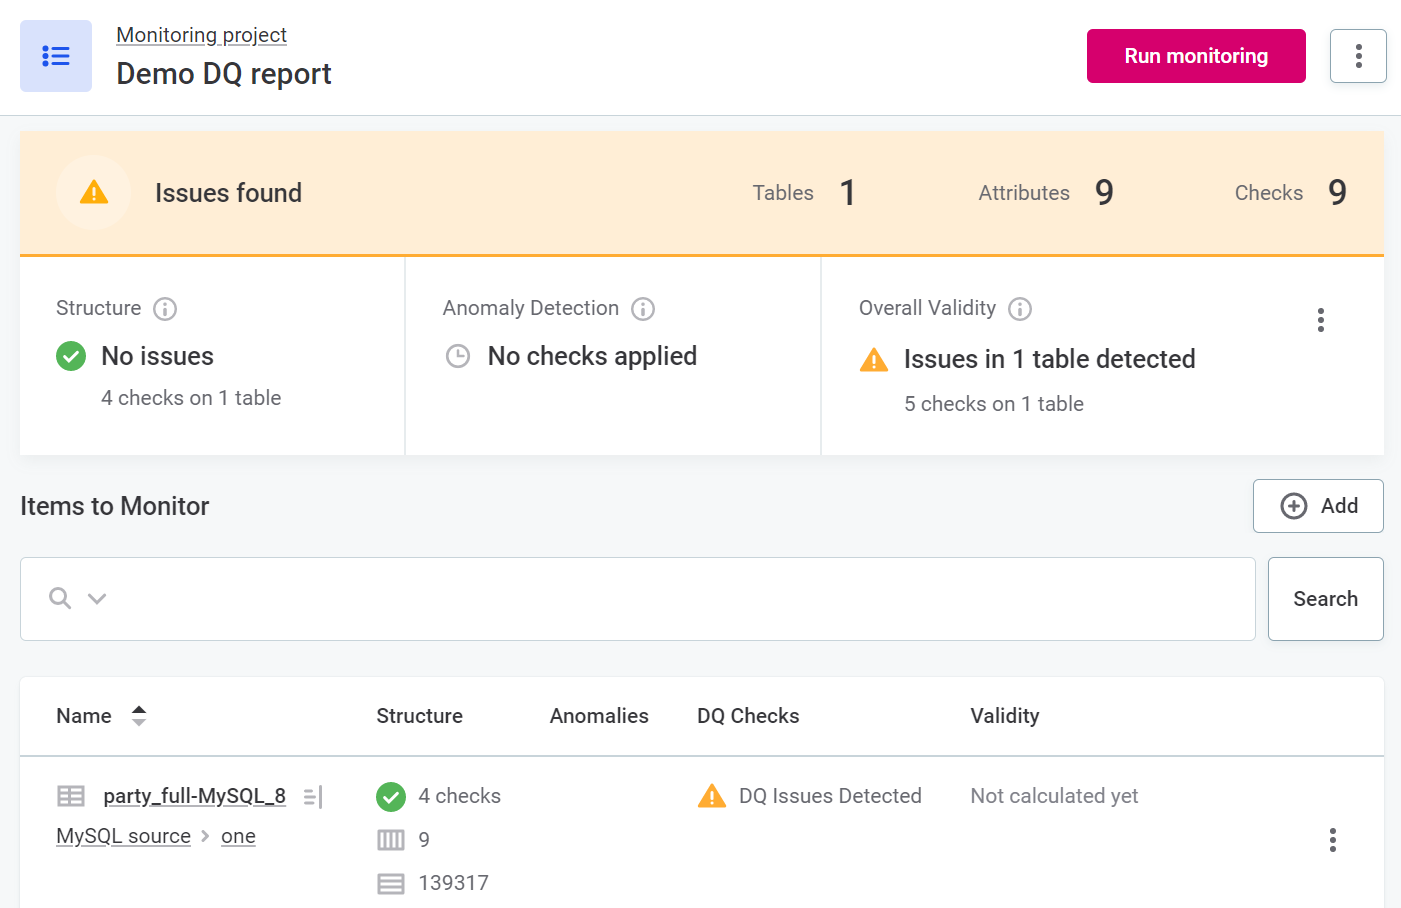
Once you have selected the necessary items for the project, you can find these listed under Items to Monitor, along with the following information:
-
Structure: Number of rows and columns in the catalog item.
-
Anomalies: Shows if anomalies were detected on any of the catalog item attributes.
-
DQ Checks: Shows the number of DQ checks assigned to the catalog item attributes.
-
Validity: Shows an aggregated value for validity based on DQ checks of the validity dimension assigned to attributes within that item.
-
| Open any catalog item in the list by selecting its name. This lets you see the attribute view, and add or edit checks on the attributes. |
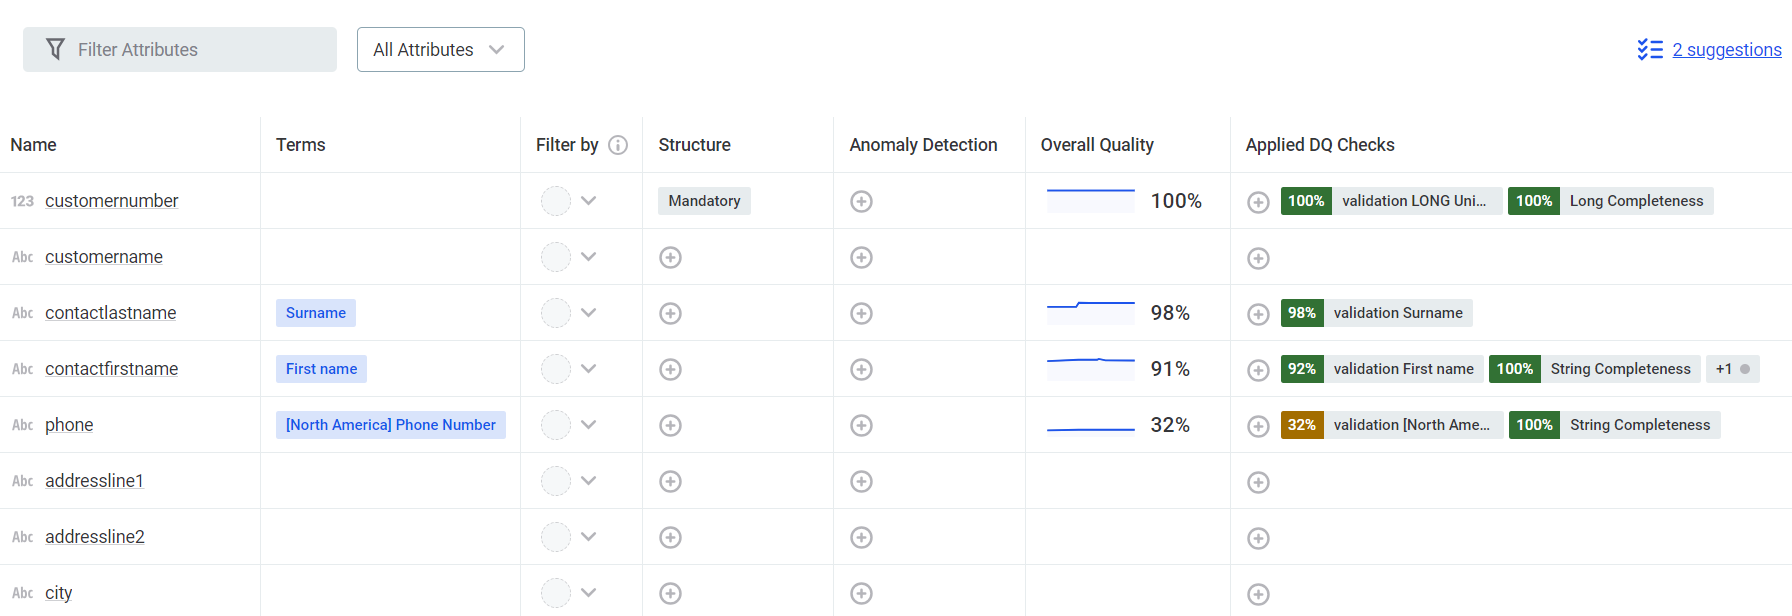
Apply structure checks, DQ checks, and anomaly detection
Once you have selected the required catalog items, you need to select each item individually to start adding checks. Select an item by clicking the item name.
Three types of checks can be applied:
-
DQ checks (data quality rules)
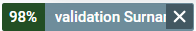
To remove wrongly applied checks:
-
Hover over the applied check in the table and delete using the X icon.
After both adding or removing checks, make sure to publish your changes.
After a monitoring project has been run, an overview of the results for structure checks, anomaly detection, and data quality checks are displayed on the Configuration & Results tab.
More detailed results can be found on the monitoring project Report tab. For more information, see Monitoring Project Results, Reports, and Notifications.
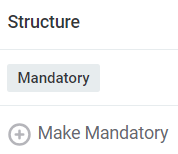
Structure checks
Structure checks alert you in the event of any missing columns in the data, or of a change in data type.
They are enabled on an attribute-by-attribute basis by selecting Make Mandatory for the required attributes.
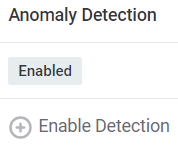
Anomaly detection
Anomaly detection is powered by AI and alerts you when potential anomalies that have been detected. For more information about how anomaly detection works in ONE, see Anomaly Detection: Behind the Scenes.
If you do not want to use the default settings and would like more information about how anomaly detection can be tweaked within your project, see Anomaly Detection in Monitoring Projects.
Anomaly detection is enabled on an attribute-by-attribute basis by selecting Enable Detection.
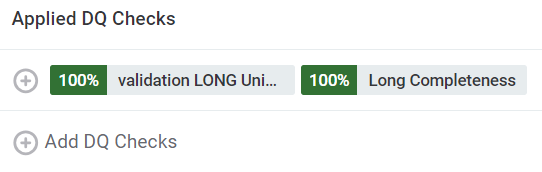
DQ checks
DQ checks are data quality evaluation rules defined in Data Quality > Rules (for more information, see Detection and DQ Evaluation Rules). You can manually assign DQ checks to attributes or use the rule suggestions.
Of all the DQ checks applied, the Overall Quality section takes into account only the results of rules of DQ dimensions which contribute to overall quality. Columns for the results of individual data quality dimensions are named according to the abbreviation provided during configuration (for example, VAL, COM, ACC). For more information about data quality dimensions in monitoring projects, see Additional Configuration Options.
To assign DQ checks, either:
-
Use the plus icon under Applied DQ Checks and select rules from the list provided.
-
Accept rule suggestions.
-
Click the rule suggestions icon.
-
A list of rules suggested for the catalog item is shown. Accept or reject suggestions one-by-one, using the relevant icon (tick for accept and cross for reject), or accept or reject in bulk using the dropdown.
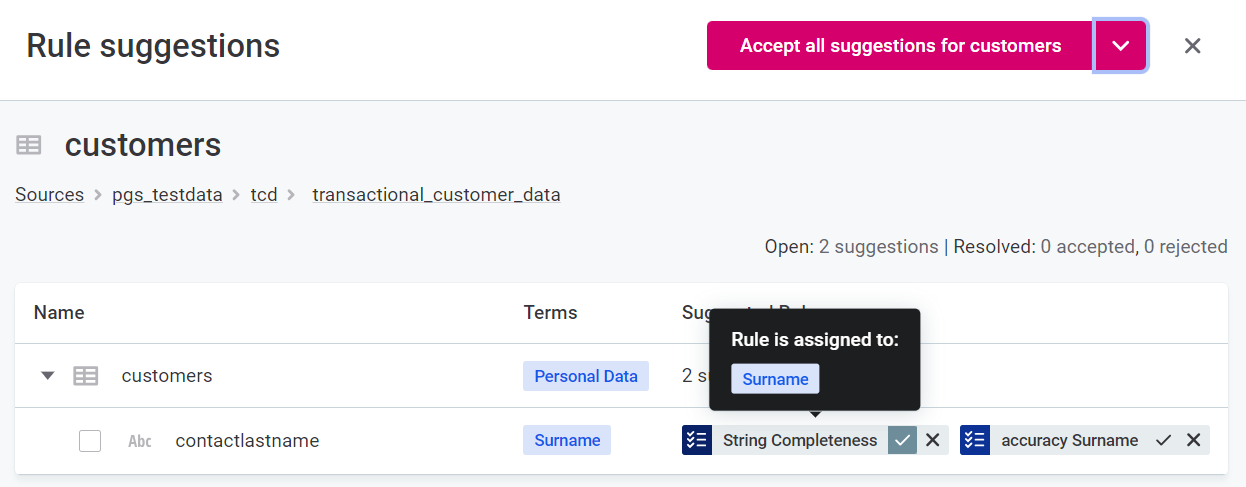
-
Currently, we recommend using rules of the DQ dimension Validity only, as results of other DQ dimensions are not reflected in the Overall validity calculations used in monitoring projects.
Update rule references
If your monitoring project contains mappings to rules that have since been edited, you are notified on the Configuration & Results screen.
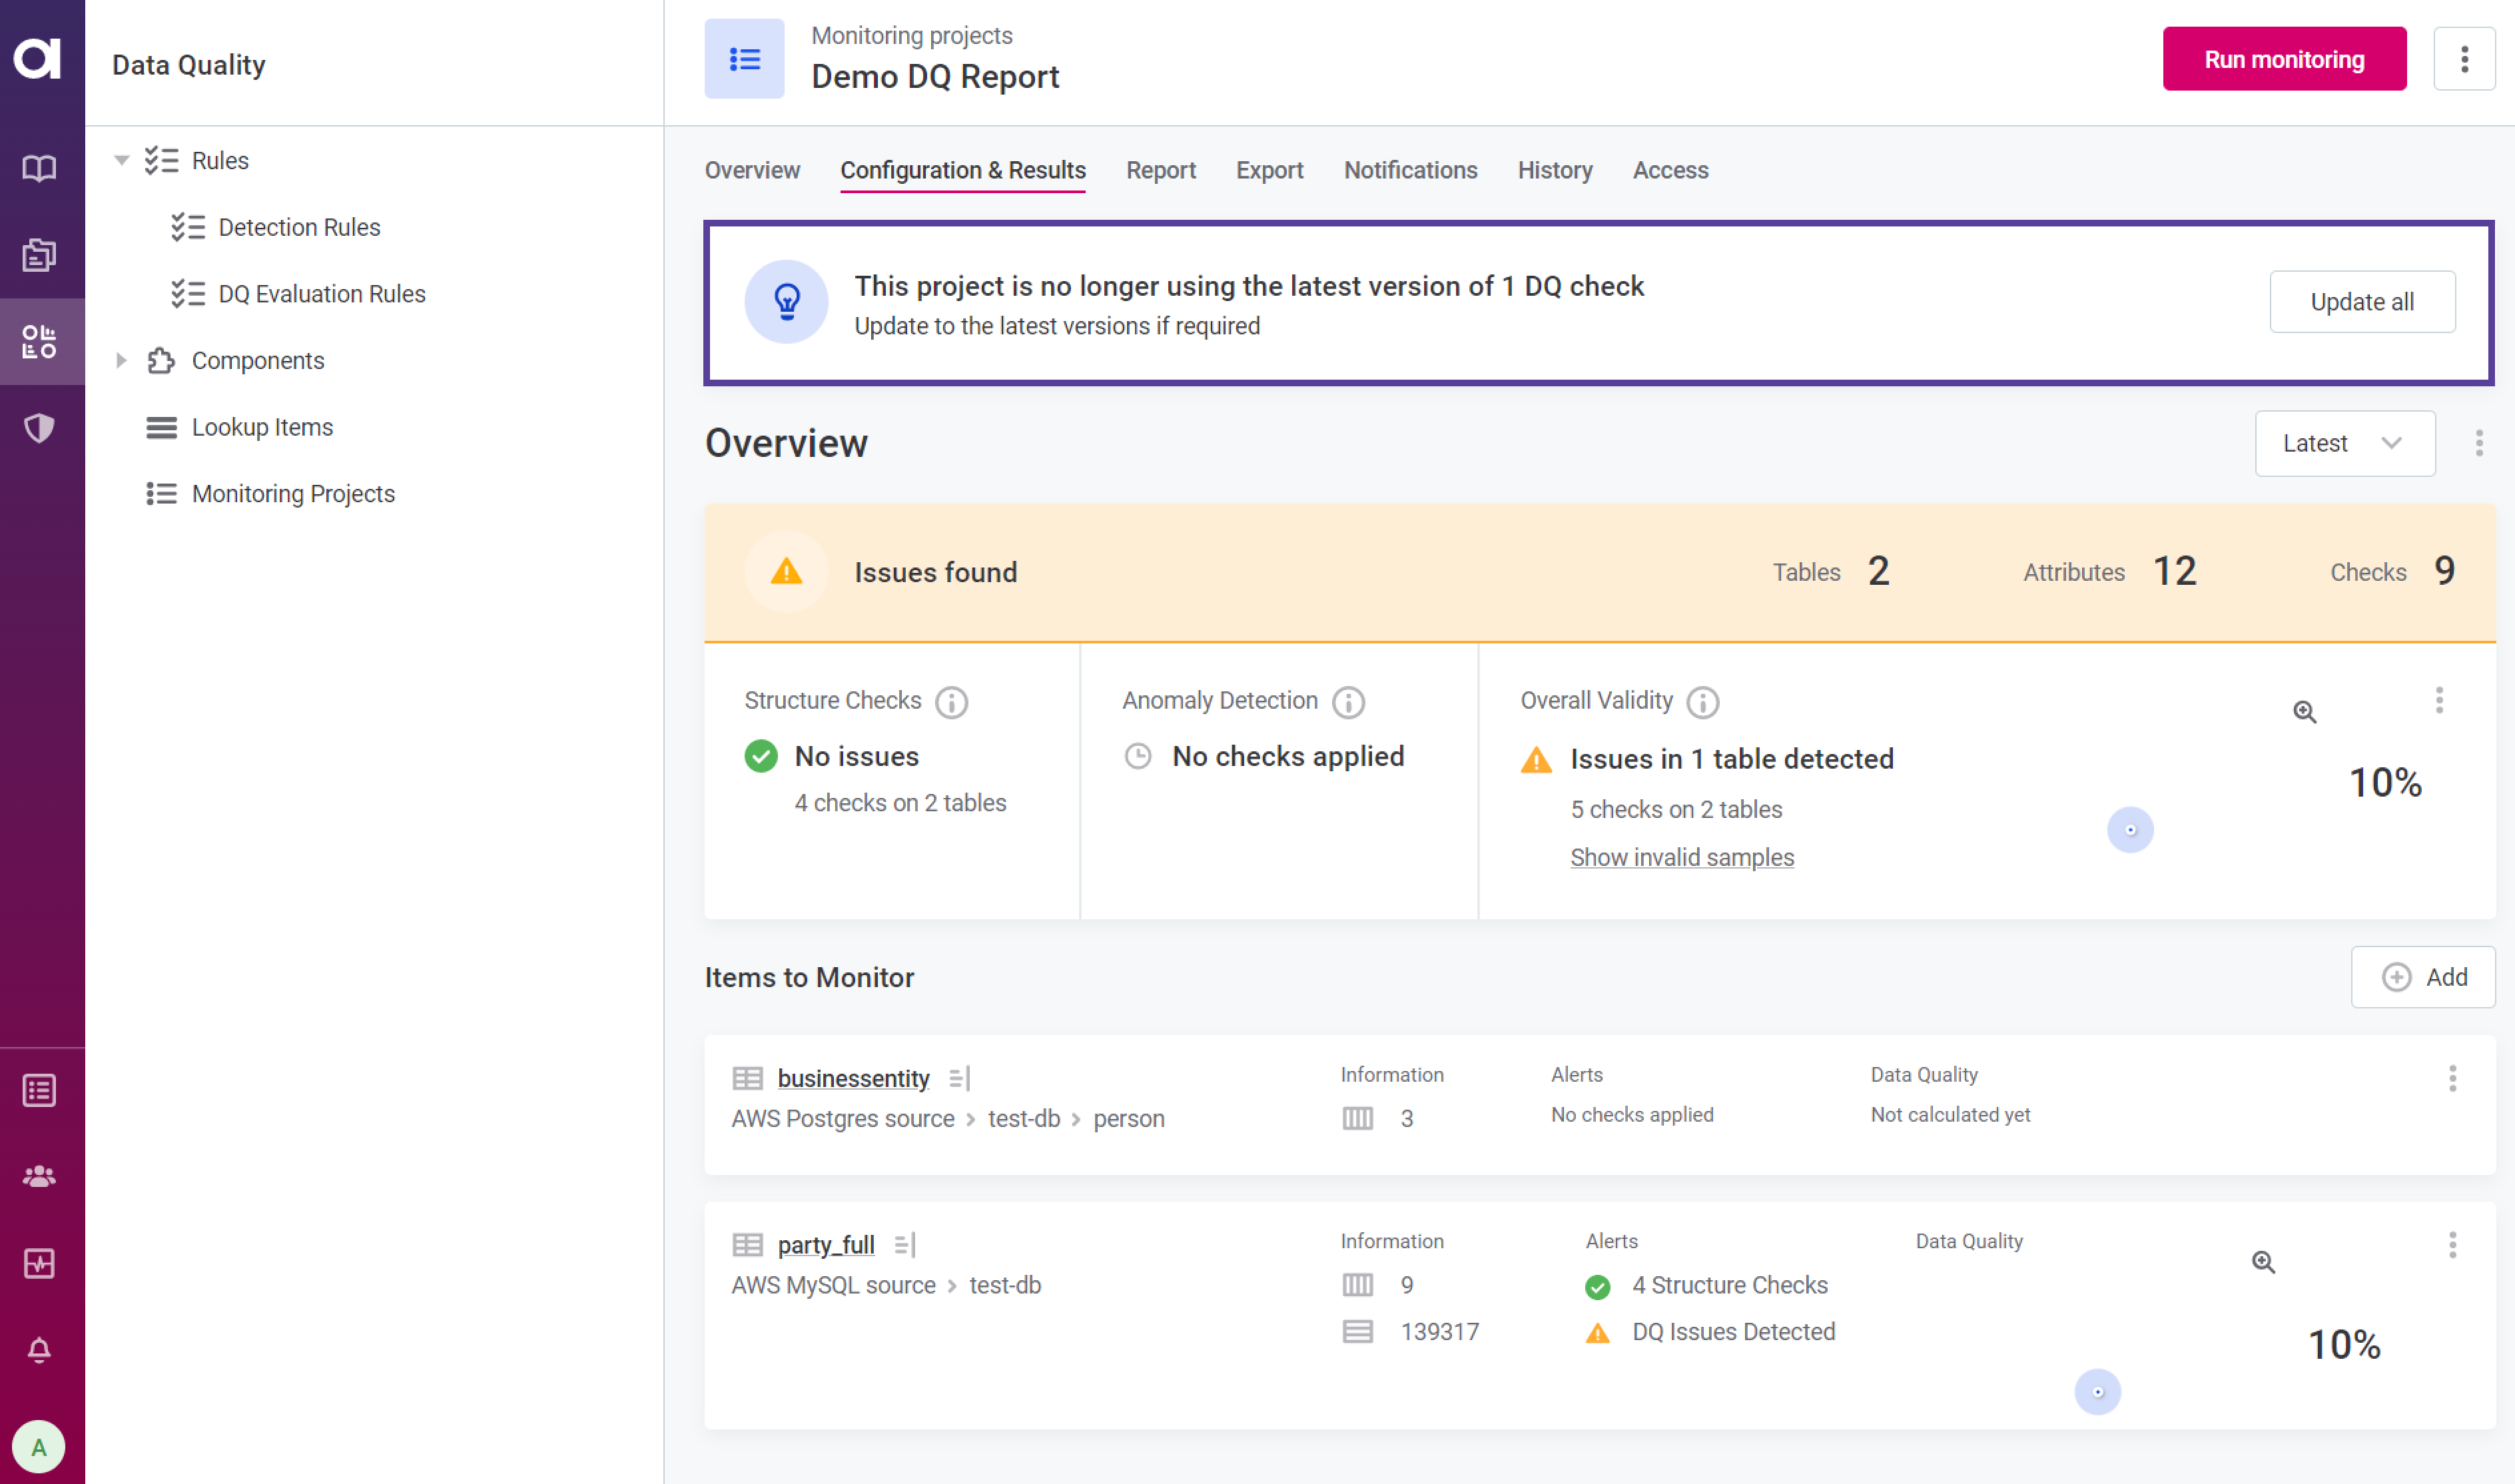
| This notification isn’t visible if you have view-only permissions for monitoring projects. |
If you want to update references, follow the instructions in Additional Configuration Options.
Application admins can turn these notifications on and off for all users through the core:reference trait.
If you change the trait after applying rules in the project, the trait doesn’t apply to those rules.
Make sure you define the required reference strategy before you configure your project. For more information, see Traits.
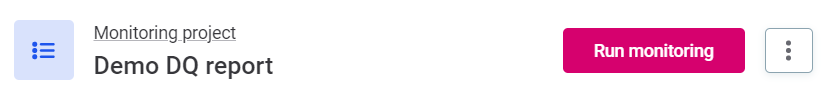
Run monitoring
| If you have made any changes or created a new project, you need to publish them before you can run monitoring. |
Select Run monitoring.
You are notified once monitoring finishes. Alternatively, schedule the project to be run at certain times by using the three dots menu and selecting Schedule.
| If monitoring fails, check out ONE Troubleshooting Guide for possible solutions. |
Run monitoring on partitioned tables
When partitioned tables are present in monitoring projects, you can identify them by the following icon:
Where partitioned tables are present, there are two options: Run monitoring and Run custom partition monitoring.
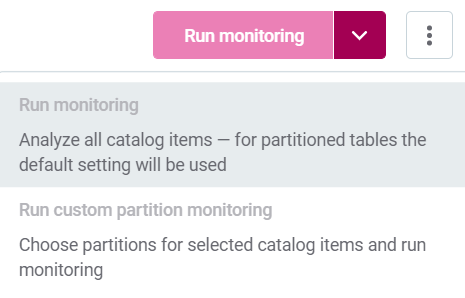
The Run monitoring option runs the project with default settings, that is, the default selected for the partitioned item, which can be either full analysis or last partition. For more information, see Set partition defaults.
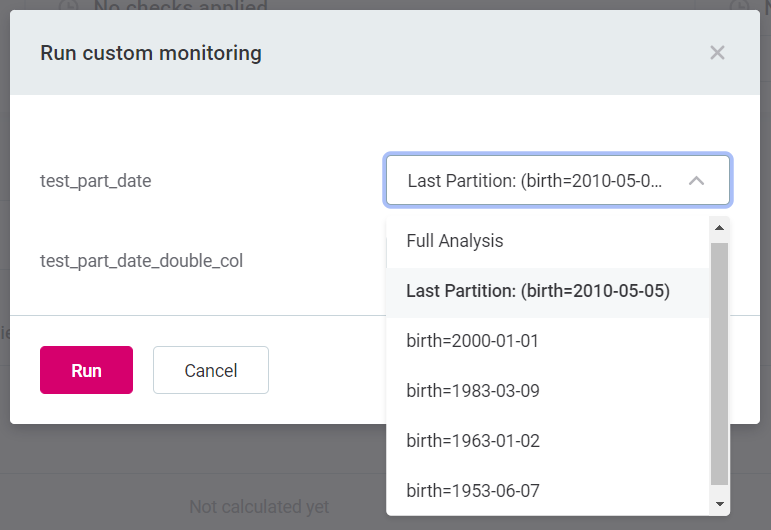
Selecting Run custom partition monitoring opens a new modal window. Select the partition you want from the list provided, and then select Run.
Set partition defaults
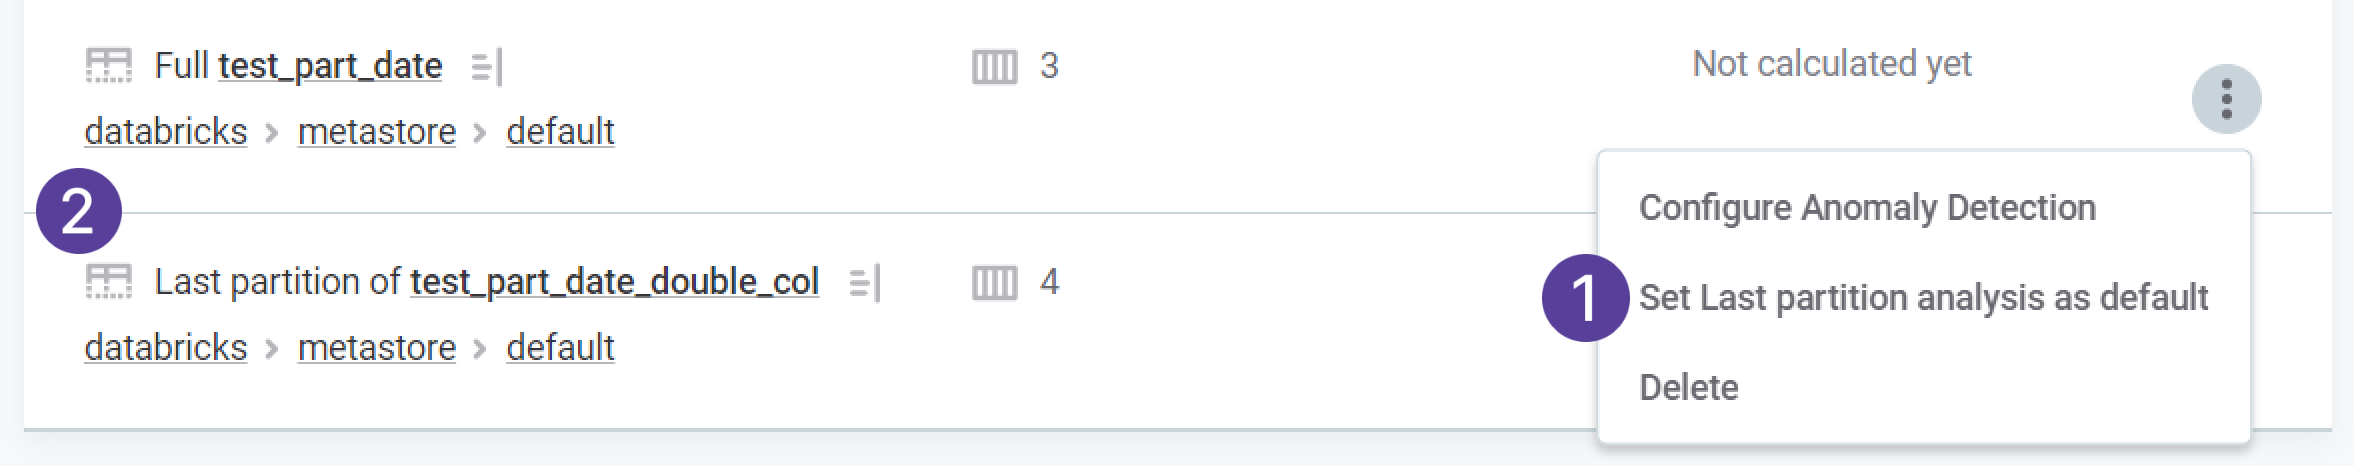
You can define how you would like to run monitoring on the partitioned table by using the three dots menu and selecting either Last partition analysis as default or Full analysis as default (1).
The chosen default is shown next to the catalog item name (2), and these settings are used on partitioned tables automatically if you select Run monitoring.
Was this page useful?