Data Quality Dimensions
Data quality dimensions, also known as DQ dimensions, are different logic types for data quality rules. When creating a data quality (DQ) rule, you must select to which dimension the rule should belong.
Once configured, DQ dimensions and their results can be used in data quality evaluation rules (see Detection and DQ Evaluation Rules).
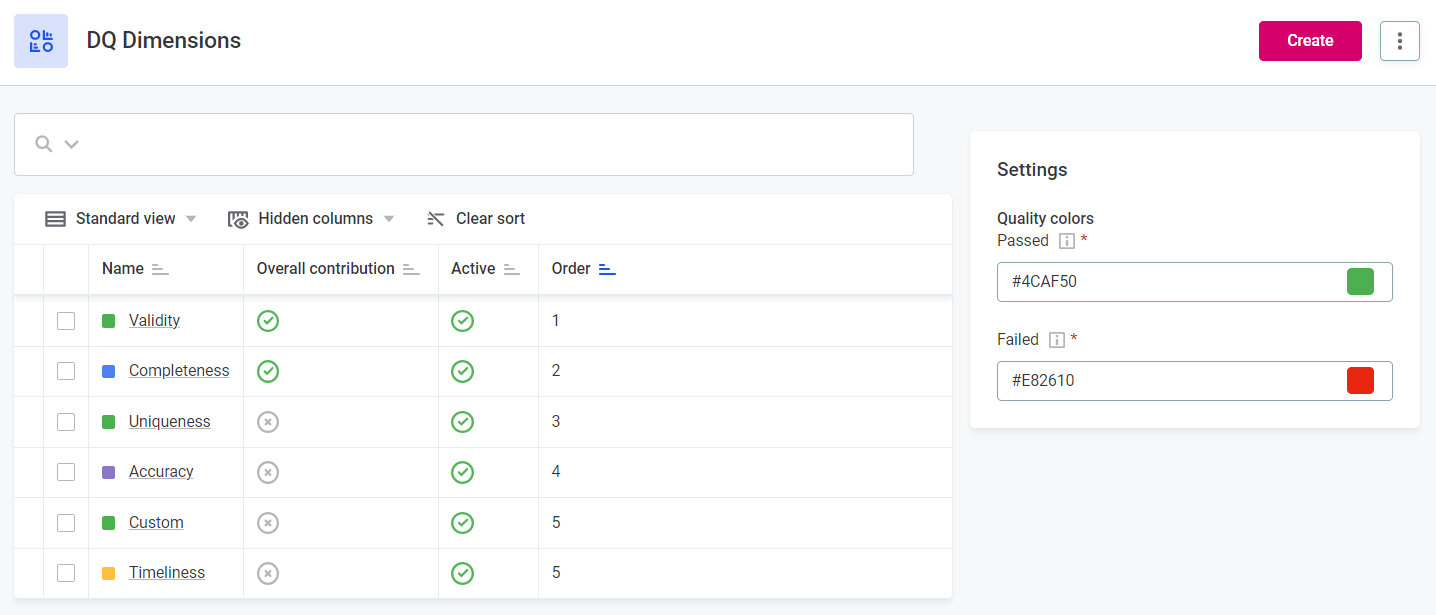
To access DQ Dimensions, select Data Quality in the navigation menu, and then under Rules select DQ Dimensions > DQ Dimensions Settings.
In the list view of configured DQ dimensions you can see:
-
Name: The name of the DQ dimension.
-
Overall contribution: Indicates whether results from this dimension are contributing to Overall Quality or not.
-
Active: Indicates whether this dimension can be selected or not during rule creation.
-
Order: The order in which the dimensions are checked during DQ evaluation.
To edit these and other settings, or for instructions on creating new dimensions, head to Dimension configuration.
|
If you upgraded from version 13.9.0 or older
Your application contains four default dimensions (Validity, Uniqueness, Accuracy, and Completeness). If you have any custom dimensions configured, it is possible to continue using these. However, without further configuration, only those of the Validity dimension contribute to Overall Quality to ensure continuity. If you want to leverage the new overall quality functionality on these dimensions, make sure to enable Overall contribution for all required dimensions. For new installations, you can set up dimensions and the Overall Quality configuration as you choose. |
DQ dimensions and overall quality
|
Previously, only Overall Validity was available, which was calculated from results of rules with the Validity dimension only. As a result, if you have upgraded from older versions, by default, only the results of validity rules contribute to overall quality. This is only to ensure continuity and you can change it at any time. |
Data quality dimension configuration directly impacts the Overall Quality metric found in DQ results, as it is necessary to define which dimensions contribute to this metric. Equally, to get the best understanding of your results, it is important to be aware of which dimensions are considered here.
Overall Quality is visible after DQ evaluation on catalog items, attributes, terms, in the Data Observability feature, and in monitoring projects. You can also see results only for selected dimensions.
Within monitoring projects and data observability it is also possible to override the global settings by defining contributing dimensions for that specific project or source.
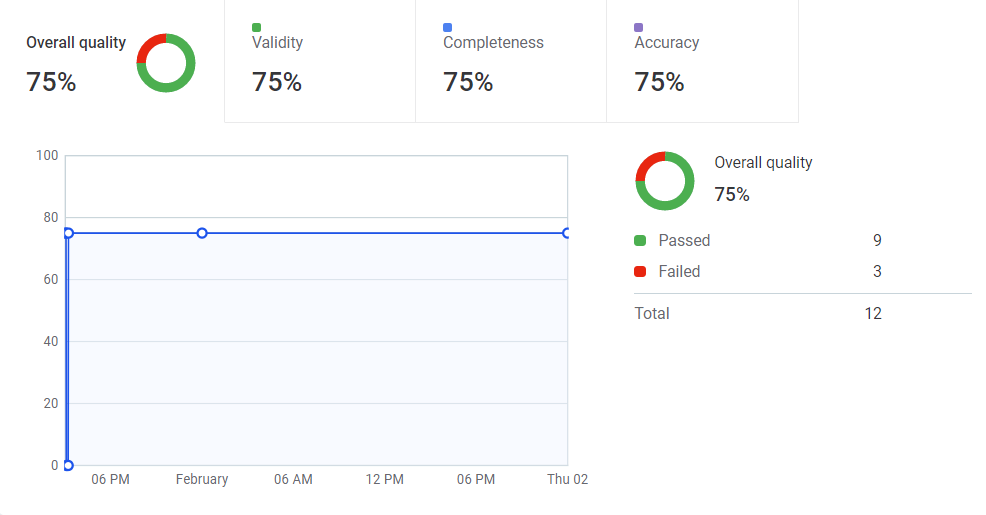
What does it mean if a dimension is contributing to overall quality?
If a dimension is contributing to Overall Quality, it means that results from rules with this dimension type count towards the overall quality percentage that can be seen in DQ results. If a dimension is not contributing to Overall Quality, it means that results from rules with this dimension type do not count towards the overall quality percentage.
This is defined in the settings for each dimension. Use the checkbox to enable overall quality contribution.
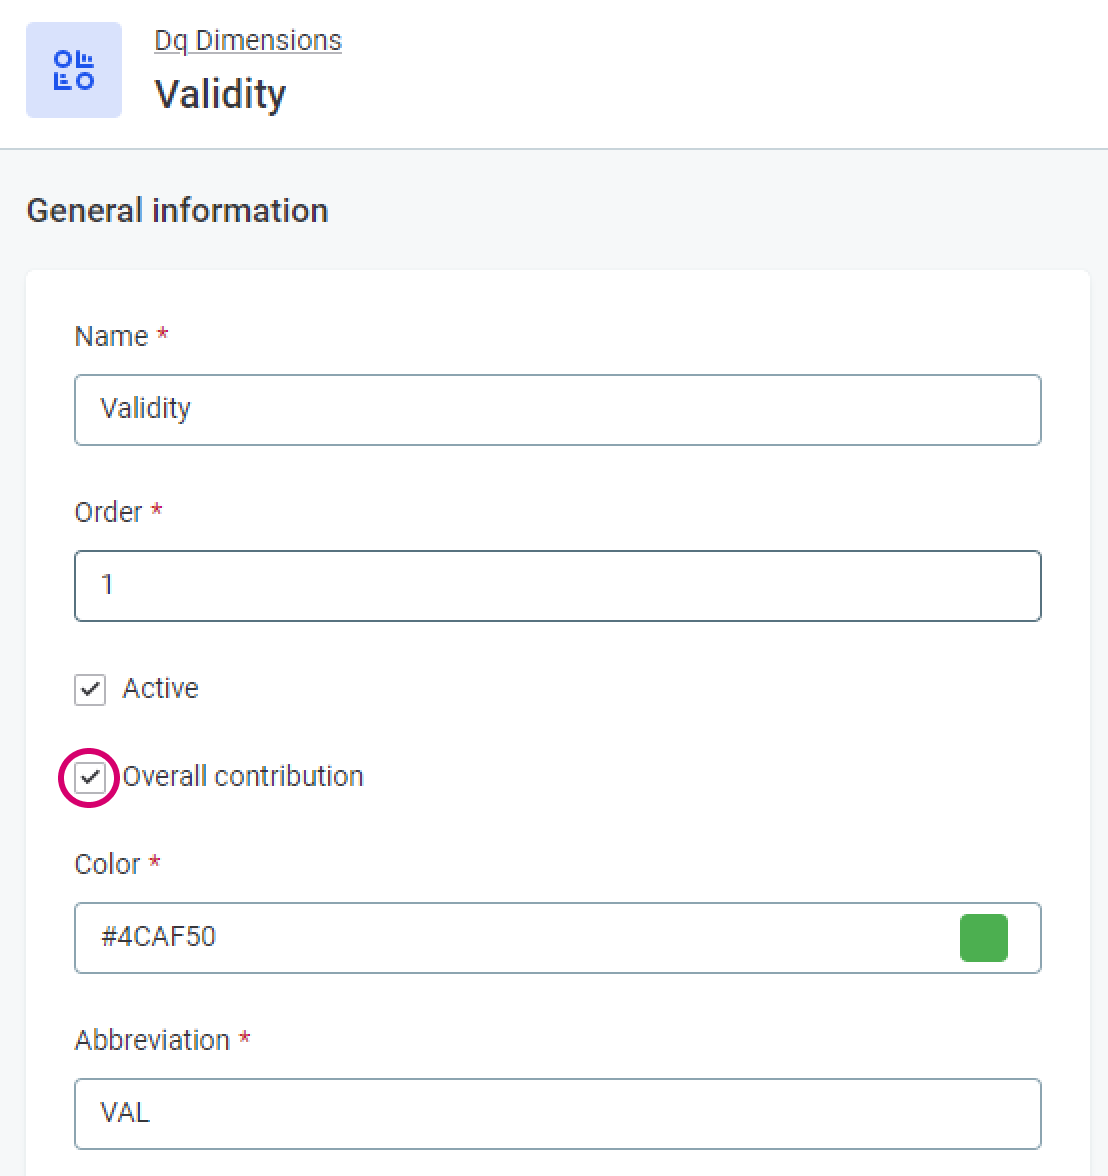
You can see which dimensions are currently contributing to the overall quality metric by selecting Data Quality > Rules > DQ Dimensions > DQ Dimensions Settings.
At least one dimension must contribute to overall quality at any given time. Otherwise, it is not possible to calculate Overall Quality.
How do the dimensions impact overall quality?
Each result added for a dimension type can impact the overall quality either positively or negatively (that is, increase or reduce the quality).
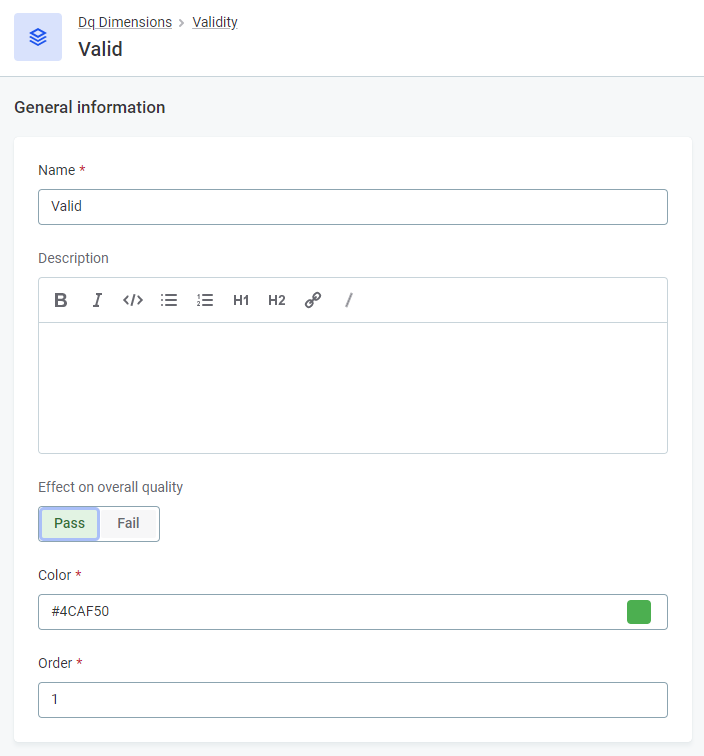
This depends on whether the result is tied to Pass or Fail: results which are tied to Pass increase data quality and results which are tied to Fail reduce data quality. This is defined in settings for each dimension result.
To have a result contribute positively to data quality, select Pass. Otherwise, select Fail.
|
The overall quality is not a simple average of the results for each dimension, as a record must pass all data quality rules applied to it. If a single result fails, the record fails. This means that the Overall Quality is always less than or equal to the lowest result present in the contributing dimensions. |
Quality colors
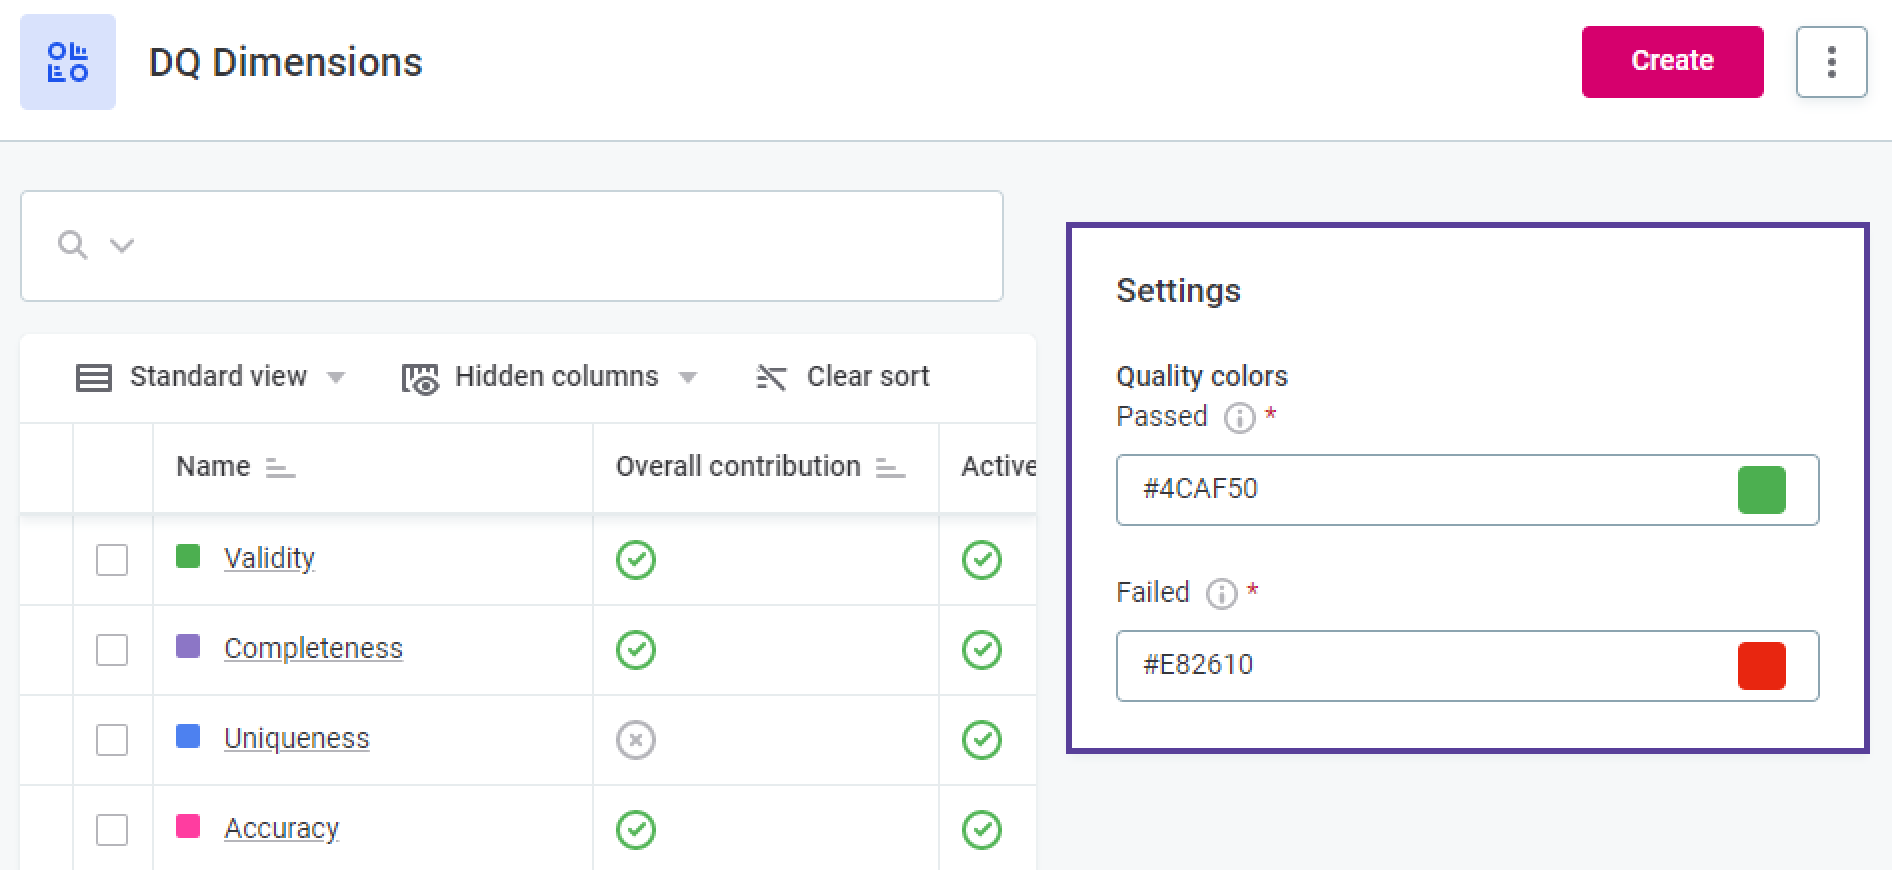
In addition to defining which dimensions contribute to Overall Quality, you also need to specify the quality colors:
-
Passed: The color that represents results that contribute positively to overall quality (that is, increase overall quality percentage).
-
Failed: The color that represents results that contribute negatively to overall quality (that is, reduce overall quality percentage).
Dimension configuration
| When creating new dimensions and their results, all names must be unique, or DQ evaluation fails. |
-
To add a new dimension, select Create. To edit an existing dimension, select the required dimension by clicking its name, and then select Edit.

-
Configure as required by providing the following information:
-
Name: Create a unique name for the dimension.
-
Order: Specify at which position the dimension should appear in the list of dimensions.
-
Active: Select to enable choosing this dimension during rule creation.
We recommend turning off this option when you do not want users to be able to select this dimension type during rule creation, as it is not possible to delete a dimension that is currently used in rules. -
Overall contribution: Select to define whether results from this dimension are contributing to Overall Quality.
At least one dimension should always be contributing at any given time. Otherwise, it is not possible to calculate Overall Quality. -
Color: Select the color you want to be associated with this dimension in monitoring projects and DQ reports.
-
Abbreviation: Provide an abbreviation for the dimension which will be used in results and in DQ reports.
-
Description: Provide a description for the dimension.
-
Default condition result: Select the result that should be used by default when a new condition is added (that is, the default result when new conditions are added for rules of this dimension). (1)
If you would like to add new results, or no results exist for this dimension yet, you need to add them first and return to this setting later. To add results, see Result configuration. -
Default fallback result: Select the result that should be used by default when the condition does not apply (that is, the default result when something does not meet the conditions defined for rules of this dimension). (2)
Like with the Default condition result, you might need to add results first (see Result configuration) and return to this setting later. 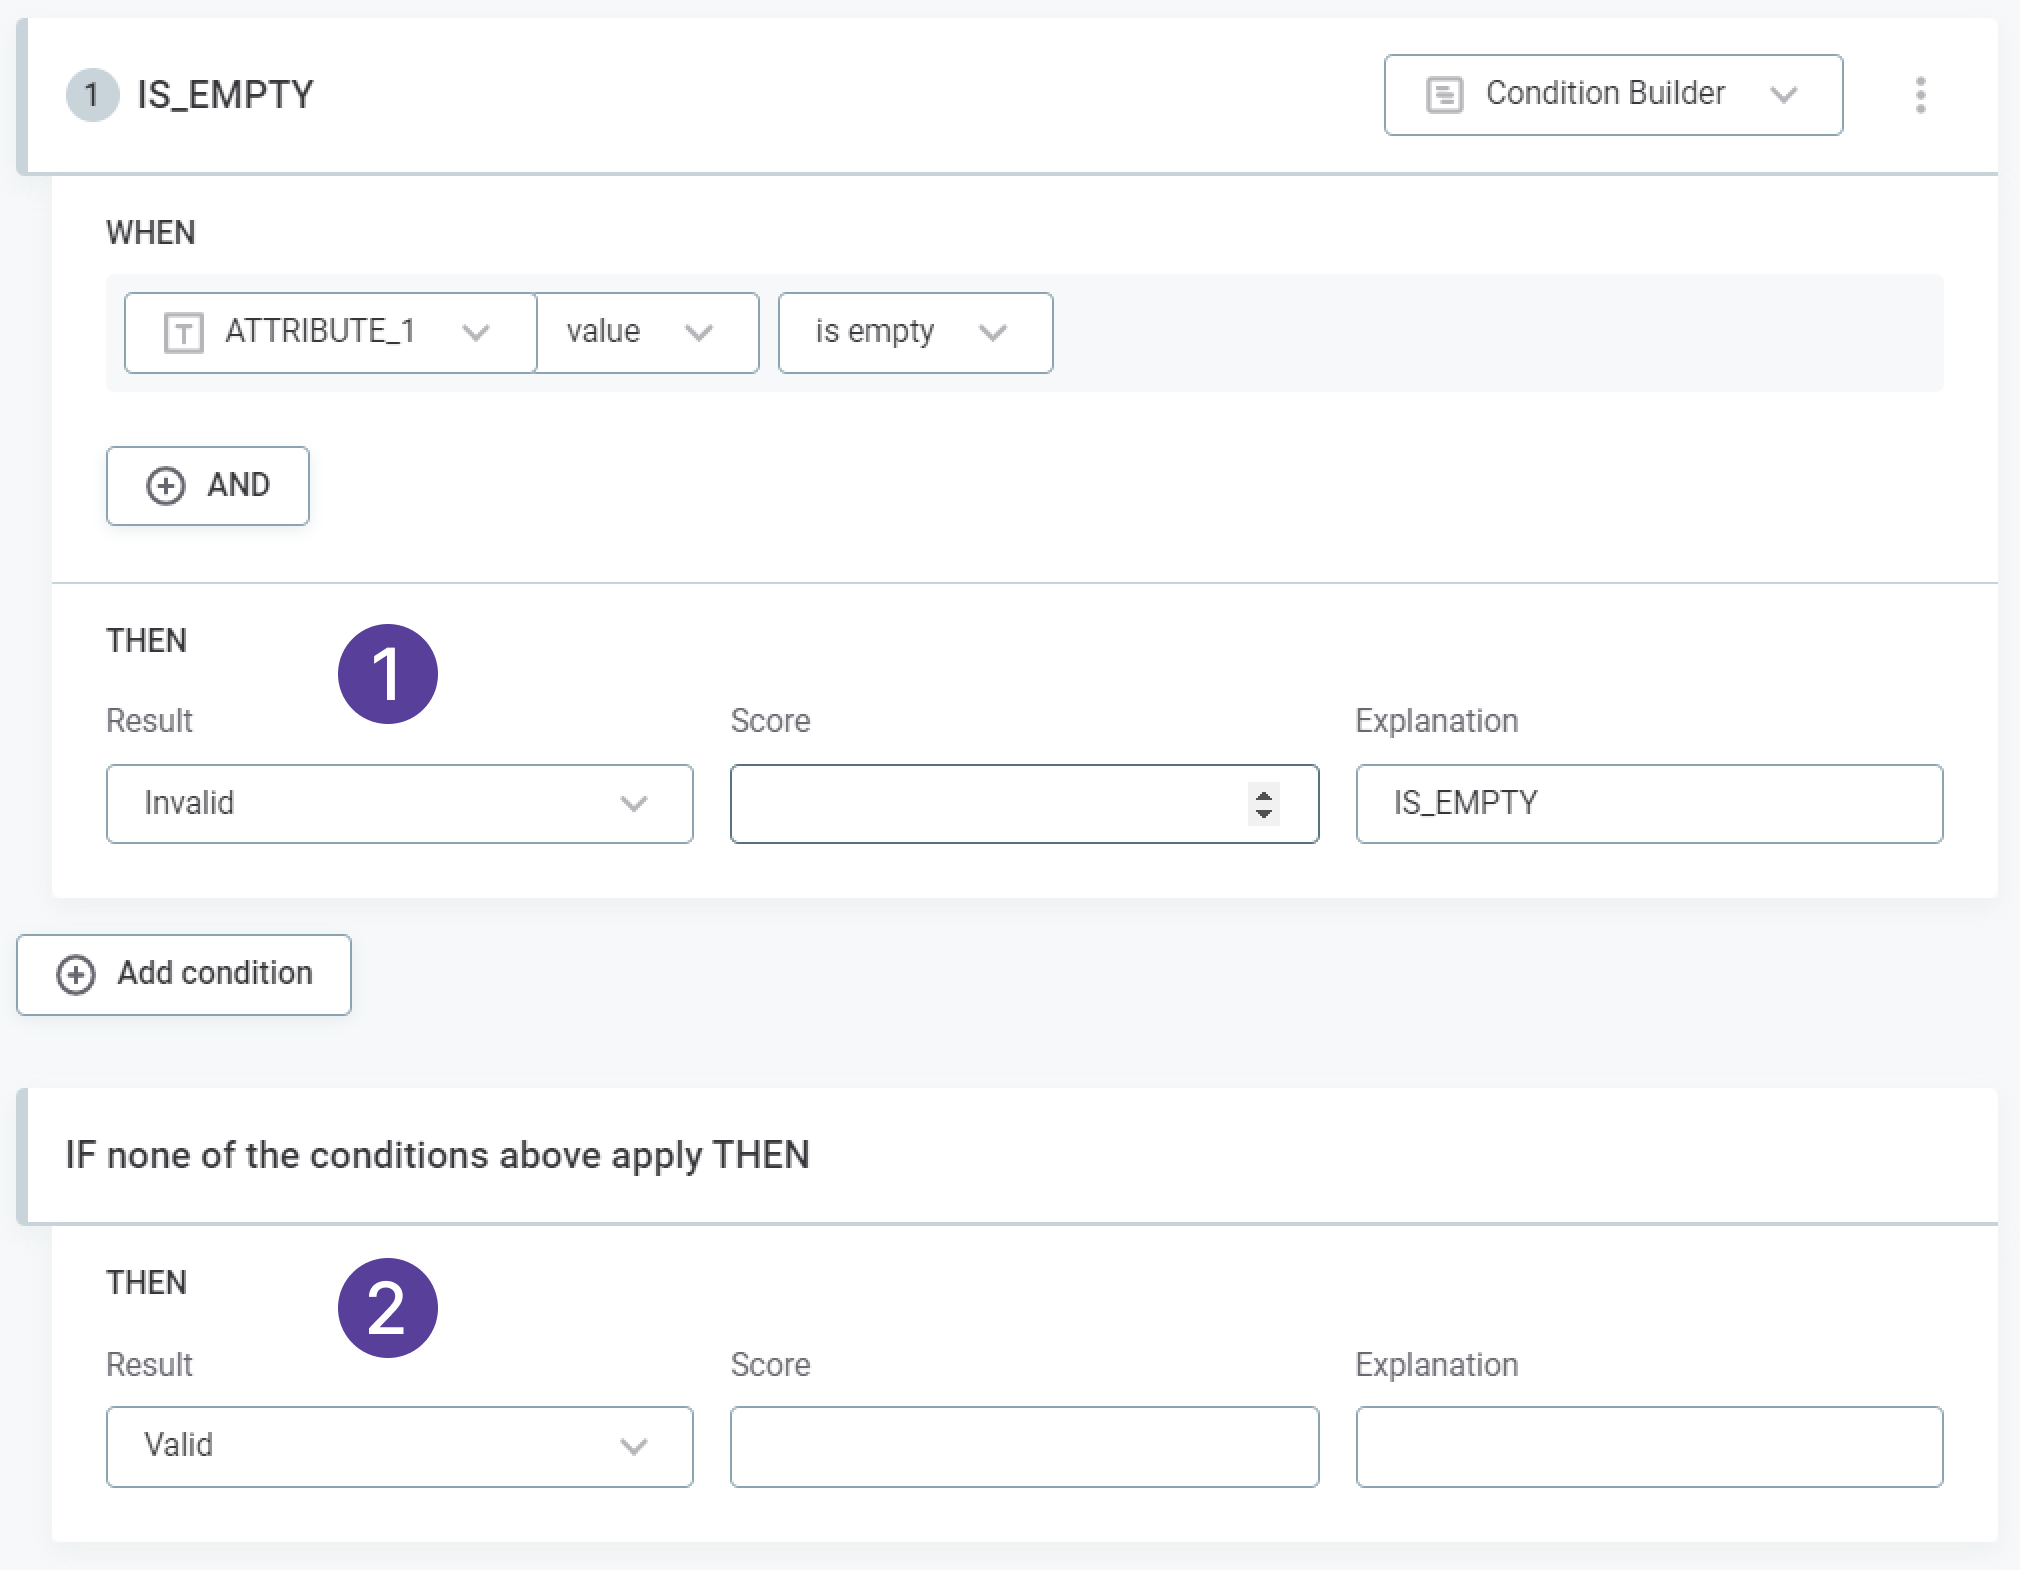
-
-
Select Save and review the changes.
-
Select Publish so the new settings are available to use.
Alternatively, Discard the changes.

Delete dimension
|
It is not possible to delete a dimension that is currently used in rules. Consider instead deactivating the dimension so that it cannot be used in the creation of new rules. To do this, navigate to the dimension configuration and clear the Active option. |
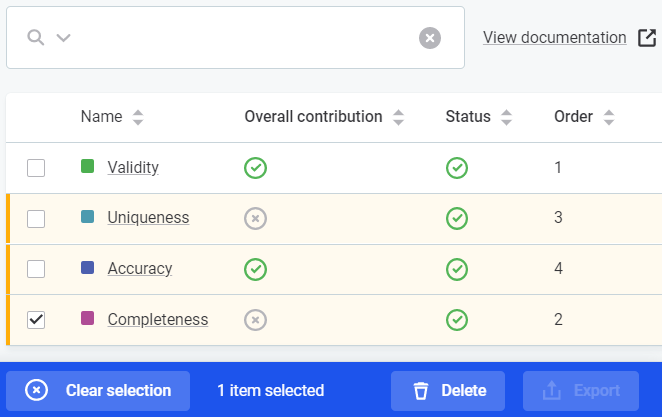
You can delete dimensions either from the list view or from the dimension page:
-
To delete a dimension from the list view, select the dimension and then Delete.
-
To delete a dimension from the dimension page, use the three dots menu and select Delete.

Result configuration
| When creating new dimensions and their results, all names must be unique or DQ evaluation fails. |
Add result
-
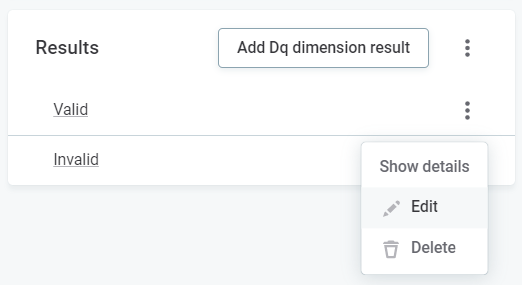
You can add results during the creation of a new dimension, or when editing existing dimensions. In both scenarios, select Add DQ dimension result.
To edit an existing dimension result, first open the required dimension and then for the required result select the three dots menu and Edit.

-
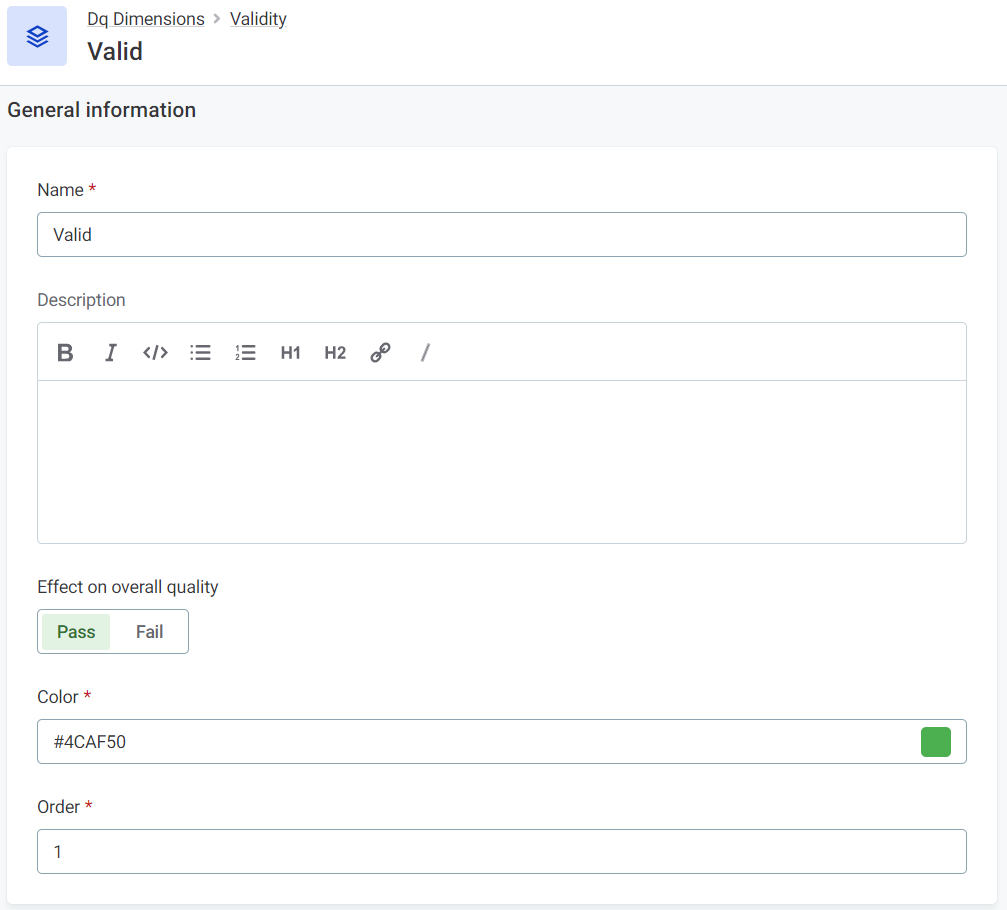
Configure as required by providing the following information:
-
Name: Create a unique name for the result.
-
Description: Provide a description for the dimension.
-
Effect on overall quality: Select whether a result impacts the Overall Quality positively or negatively (that is, increases or reduces the quality).
Results which are tied to Pass increase data quality and results which are tied to Fail reduce data quality.
-
Color: Select the color you want to be associated with this result. This will be visible here and on the rule instance level in DQ reports.
-
Order: Specify the order in which the result is shown in the list of possible results.
-
-
Select Save and review the changes.
-
Once you are happy with the changes, select Publish so the new settings are available to use.
Alternatively, Discard the changes.

Delete result
You can delete results either from the list on the dimension screen or from the result screen:
| You can’t delete a result that is currently used in rules. |
-
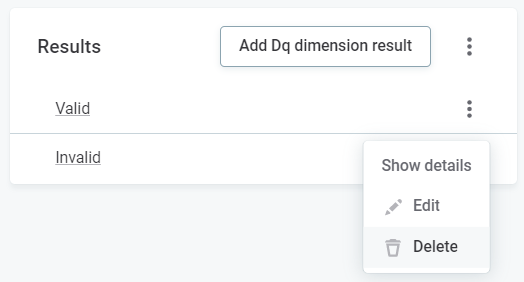
To delete a result from the list view, use the three dots menu and select Delete.
-
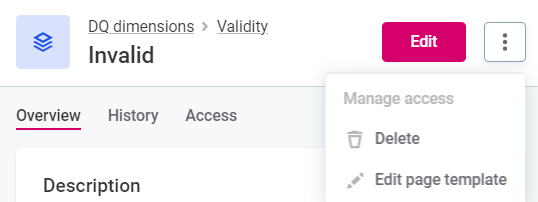
To delete a result from the result page, use the three dots menu and select Delete.
Default dimensions
Dimensions and their results are fully configurable but a number of predefined options exist:
-
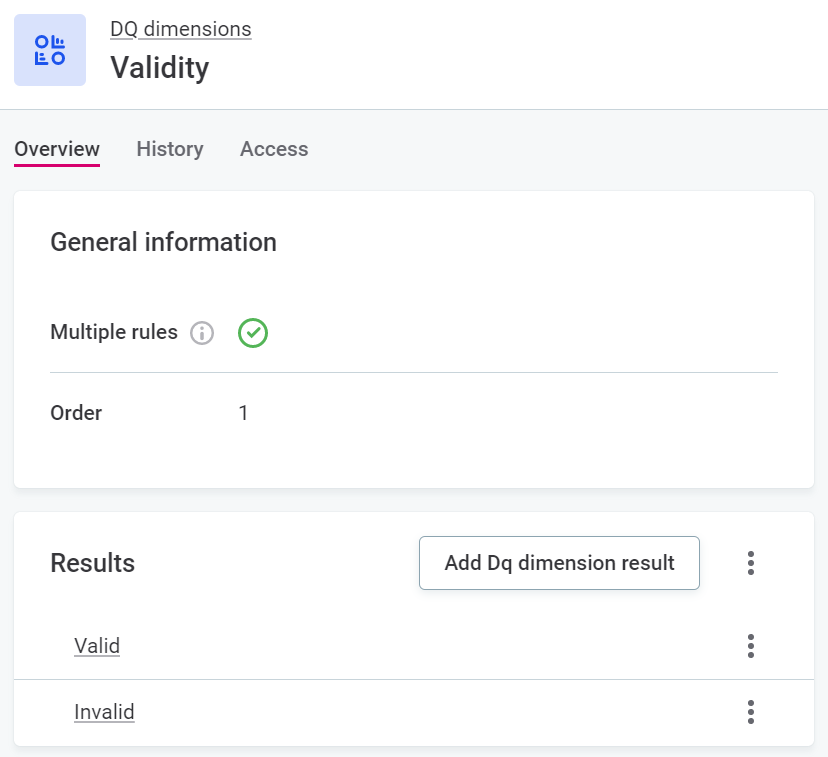
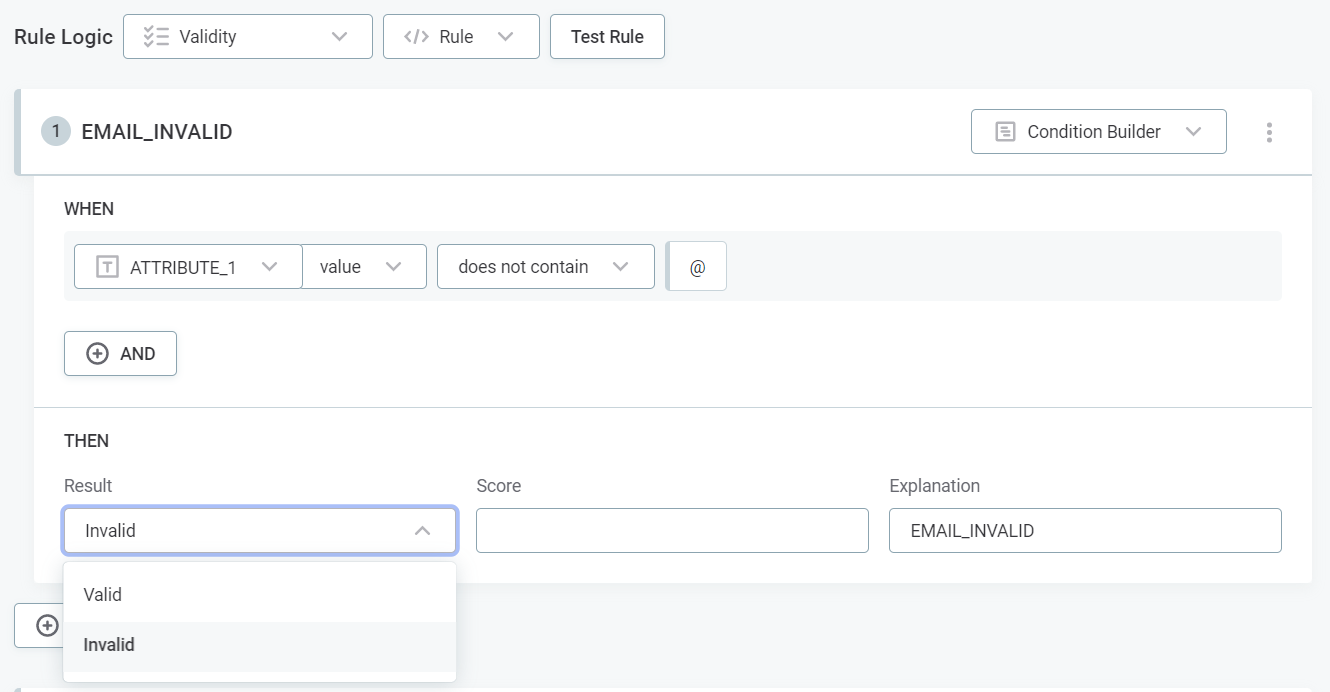
Validity: By default, the possible results are Valid and Invalid, that is, if the condition is met, the data is valid or invalid. You can use this dimension when creating rules to verify the usability of the data (for example, regarding data format, data content, or attribute relations).
-
Uniqueness: By default, the possible results are Unique, Not populated, and Not Unique. You can use this dimension when creating rules to verify that there are no duplicate values and only one instance appears in the dataset.
-
Completeness: By default, the possible results are Complete and Not complete. You can use this dimension when creating rules to verify that the value field is specified.
Be aware that if the value contains one of the following: NULL,Null,null,.,,,-,_,N/A,n/a, and similar, it isn’t recognized as Not complete. -
Accuracy: By default, the possible results are Accurate, No reference available, and Not accurate. You can use this dimension when creating rules to check whether values are accurate and reflect the true values, for example, based on reference data.
-
Timeliness: By default, the possible results are Timeliness ok, Minor delay, and Major delay. You can use this dimension when creating rules to verify whether data is available at the time it is needed.
Each of these dimensions also has a predefined set of results which can be selected during rule creation (if you add a new dimension, you also need to define the possible results). For example, if you select the dimension Validity when creating a new rule, in each rule condition you can select only the results configured for the Validity dimension.
Like the dimensions themselves, these can be edited, added or removed. To add or edit results, first select the relevant dimension and then follow the instructions found in Result configuration.
|
Keep in mind that logic types are designed to help provide clear preset results based on what you are trying to evaluate, but you are able to achieve the same functionality across logic types. For example, you can set a custom Usability dimension condition with the results Unique or Not Unique. It is the condition definition that is key. |
Aggregation example
As explained previously, data quality is calculated based on the DQ dimension configuration and reflects the results in an overall quality metric. The following example breaks down how the overall quality is derived if several dimensions contribute to that metric.
In this example, two rules are tied to dimension A: rule A1 and rule A2. There is one rule tied to dimension B: rule B1.
| Dimension | Dimension result | DQ result (pass or fail) |
|---|---|---|
Dimension A |
result 1 |
pass |
result 2 |
fail |
|
result 3 |
fail |
|
Dimension B |
result X |
pass |
result Y |
fail |
The results of four records are as follows:
| Record | Rule A1 | Rule A2 | Dimension contribution | Rule B1 | Dimension contribution |
|---|---|---|---|---|---|
Record 1 |
result 1 |
result 1 |
pass |
result x |
pass |
Record 2 |
result 1 |
result 2 |
fail |
result y |
fail |
Record 3 |
result 2 |
result 3 |
fail |
result y |
fail |
Record 4 |
result 2 |
result 2 |
fail |
result x |
pass |
In DQ reports, you can see a collation of the individual results on the rule level, and an aggregated result of the pass and fail rate for each dimensions.
Rule level result collation
The result collation at the rule level is:
-
A1 — 50% result 1, 50% result 2, 0% result 3.
-
A2 — 25% result 1, 50% result 2, 25% result 3.
-
B1 — 50% result x, 50% result Y.
Data quality aggregation
The data quality aggregation for these results is:
-
Dimension A (for example, Validity) — 25% pass, 75% fail.
-
Dimension B (for example, Completeness) — 50% pass, 50% fail.
If only these two dimensions are contributing to overall quality, the Overall Quality for these records is 25%.
Manage access
To manage access to the dimension:
-
Select the dimension name to open the Overview tab.
-
Select the three dots menu and then Manage access, or navigate to the Access tab directly.
-
Set access permissions. For more information, see Share Access to Assets.
Was this page useful?
