
Anomaly Detection in Monitoring Projects
Anomaly detection in monitoring projects can use either the time-independent (Isolation Forest) or time-dependent model. For more information, see Anomaly Detection: Behind the Scenes.
Enable anomaly detection
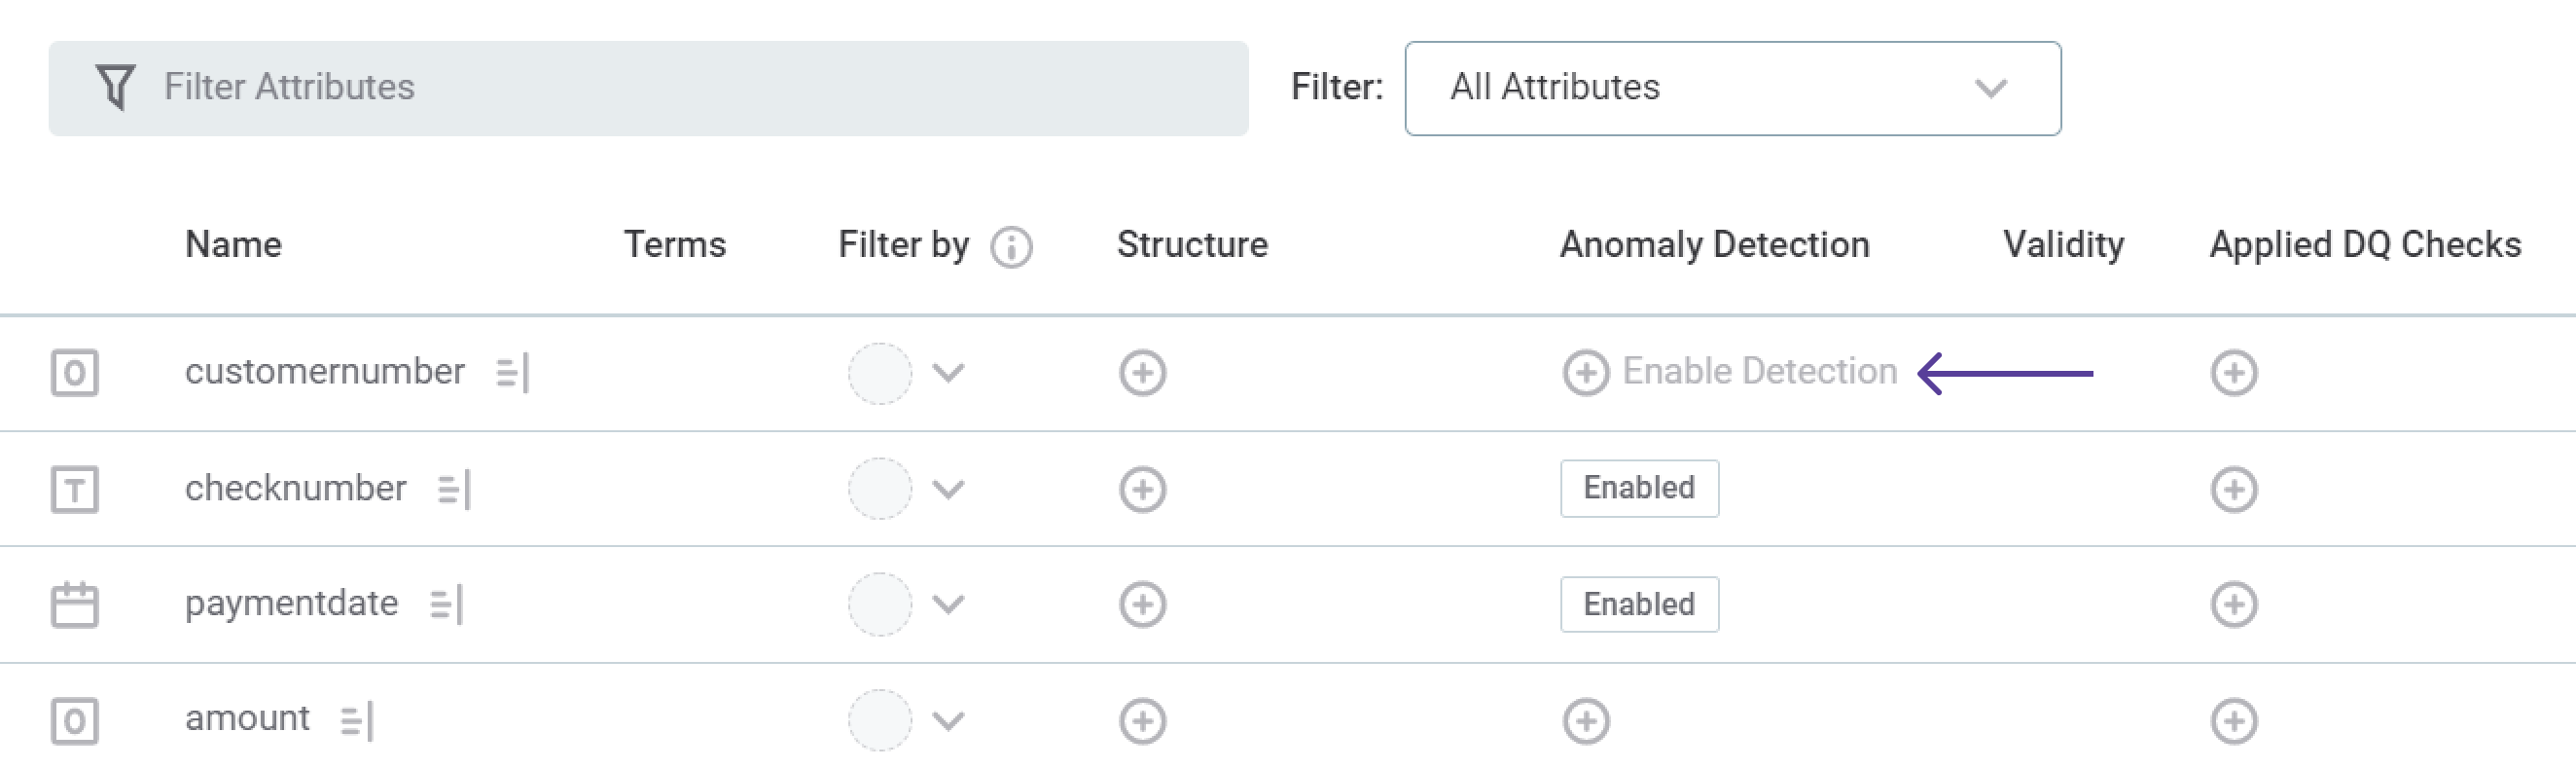
| Within monitoring projects, anomaly detection can be enabled on an attribute-by-attribute basis. |
To do this:
-
In the required monitoring project, select the Configuration & Results tab.
-
Select a catalog item by clicking the catalog item name.
-
Select Enable Detection.
-
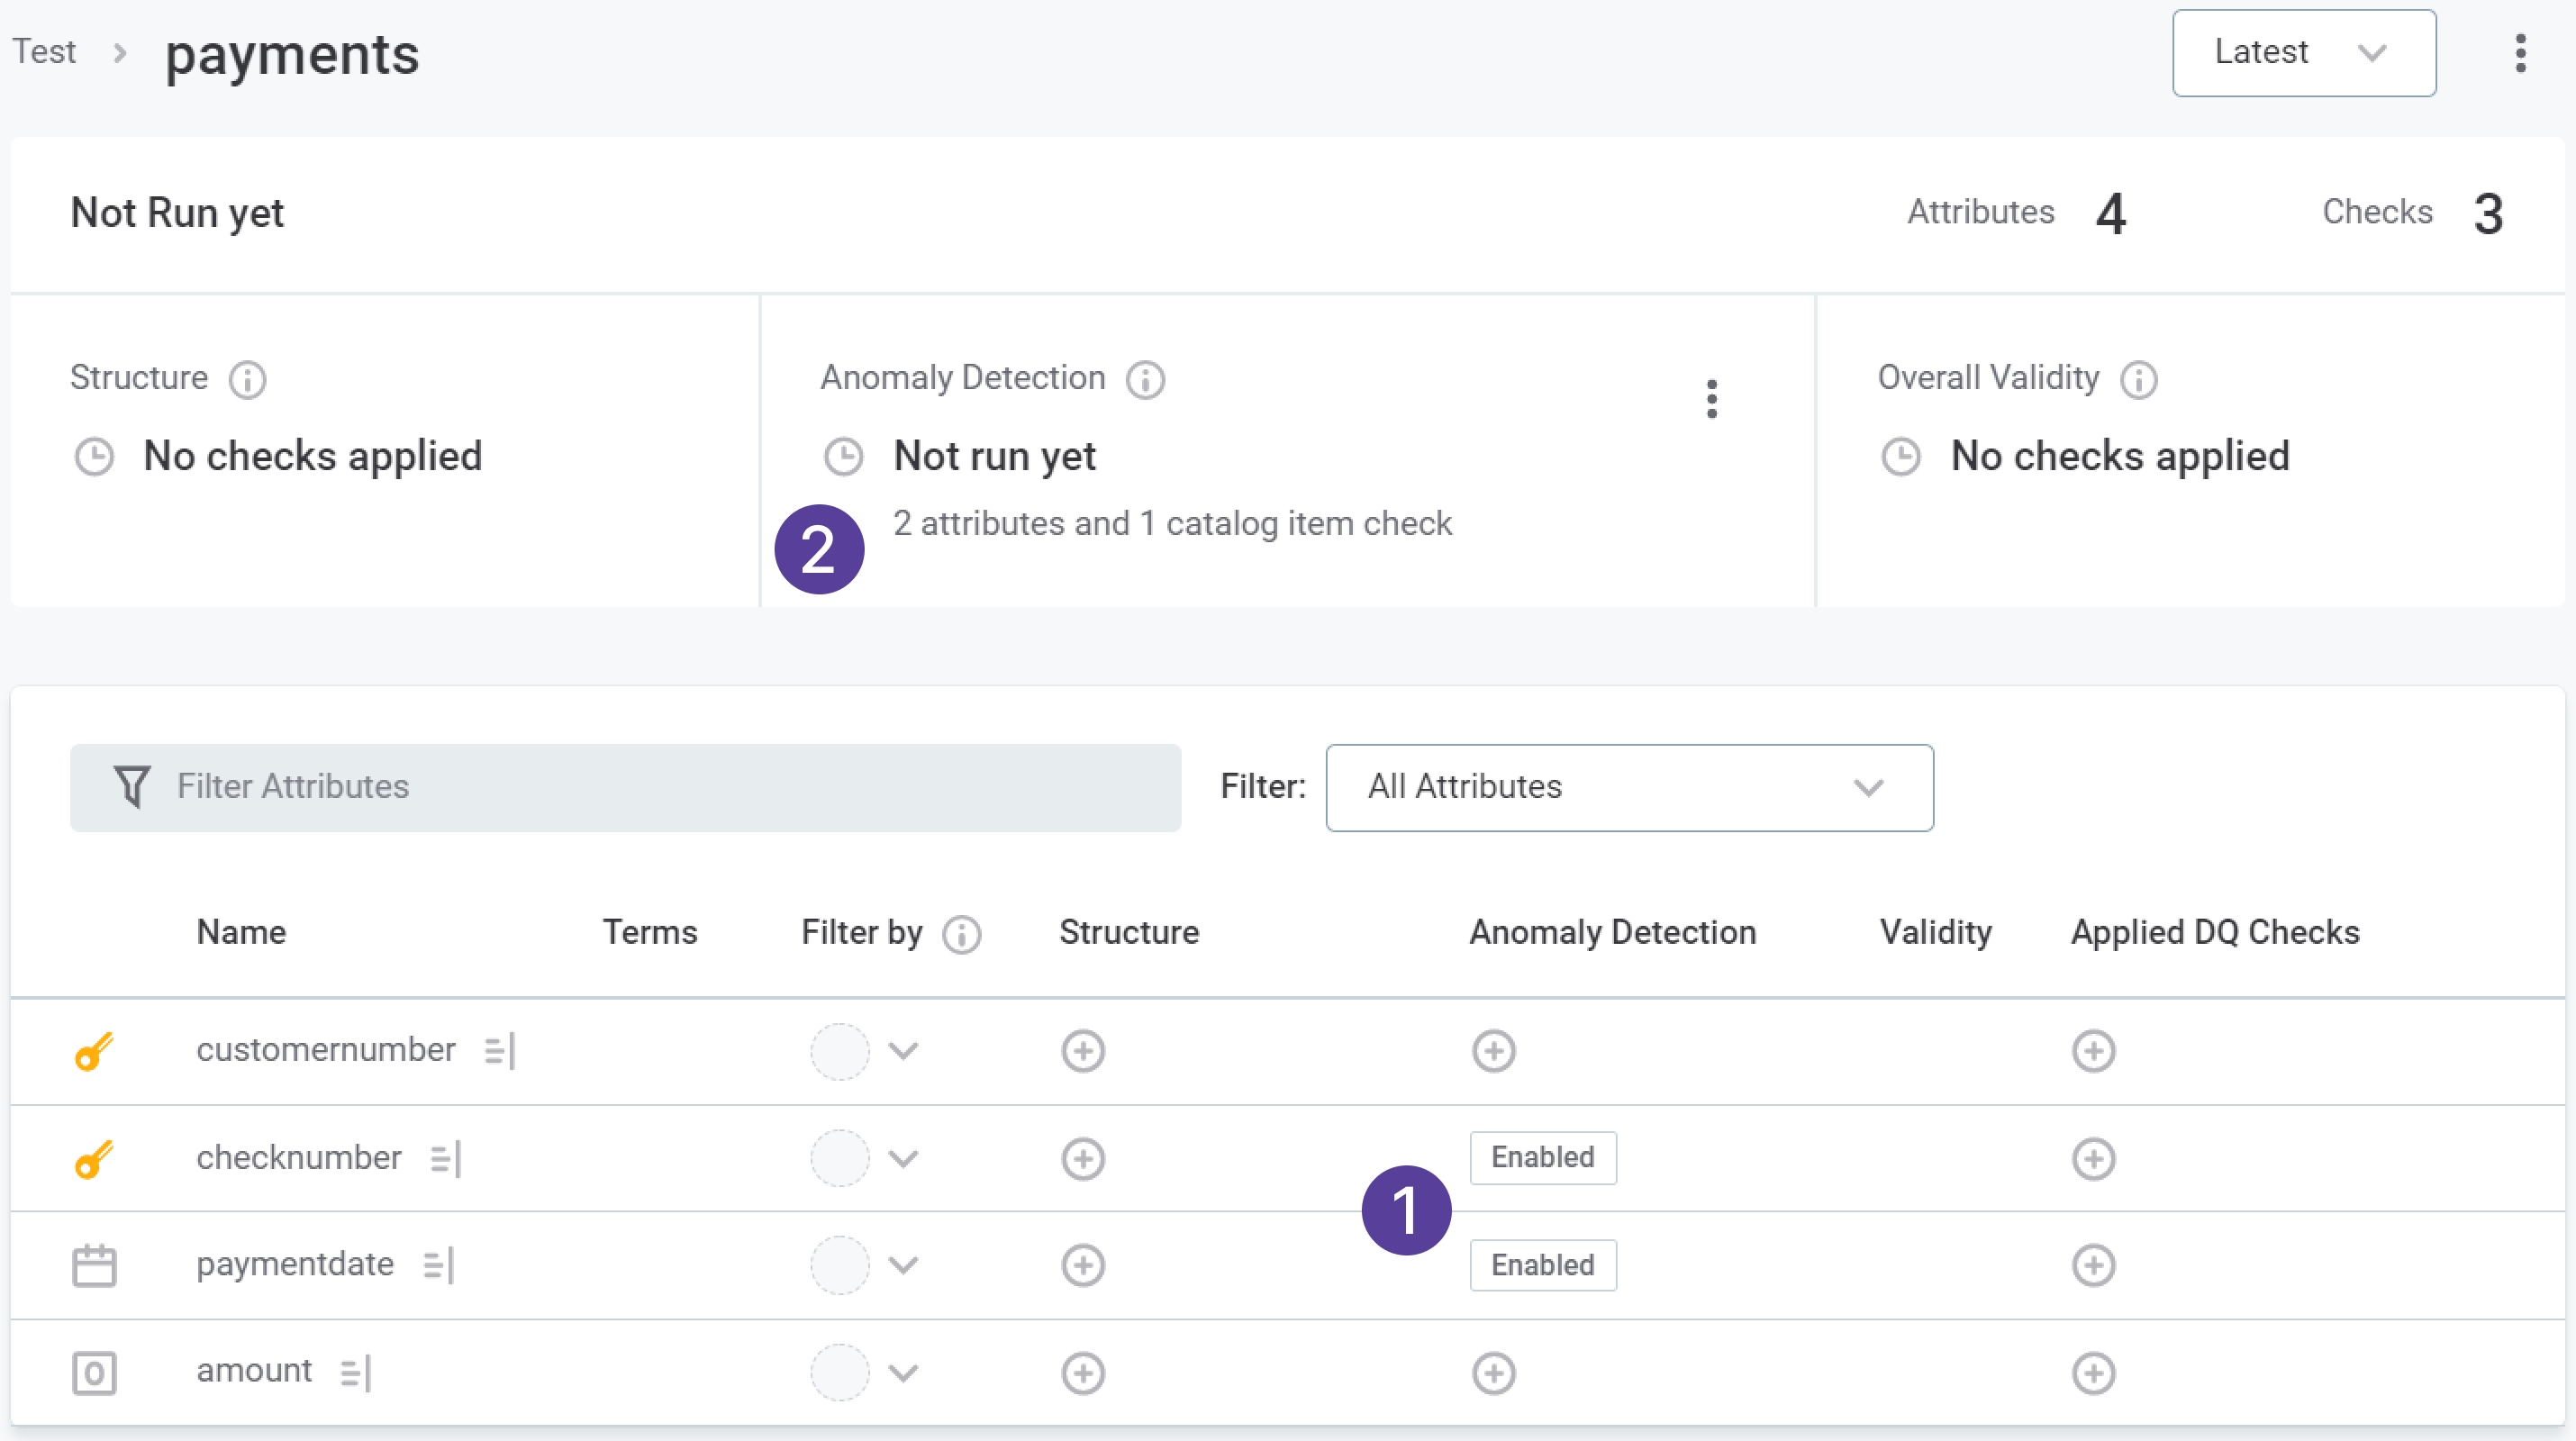
In the Anomaly Detection section, you can see how many anomaly detection checks are enabled in the catalog item or monitoring project.
-
-
Publish the changes to the project.
-
For attributes with anomaly detection enabled, anomaly detection is run in the course of the monitoring project.
Configure anomaly detection
Configuration of anomaly detection in monitoring projects allows you to define which anomaly detection model should be used, time-dependent or time-independent.
To configure anomaly detection:
-
Go to the monitoring project Configuration & Results.
-
For the items that should have time-dependent anomaly detection applied, use the three dots menu and select Set periodicity

-
In the modal:
-
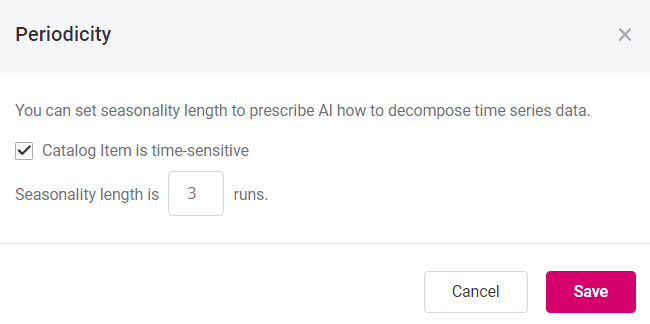
Check the Catalog item is time-sensitive option.
-
In Seasonality length, set the value for periodicity. For more information about this setting, see Periodicity.
Time-independent anomaly detection detects anomalies in catalog items and attributes according to metrics such as number of records, minimum and maximum values, and duplicates. The full list can be found in Anomaly Detection: Behind the Scenes.
Time-dependent anomaly detection detects anomalies according to whether the metadata deviates from an established pattern or trend over time.
By default, time-independent anomaly detection is used. If you want to use time-dependent anomaly detection to be used in selected catalog items you must select Set periodicity.
-
-
Publish the changes to the project.
Periodicity
Periodicity describes how often a pattern is repeated in the data in regular, fixed intervals, for example:
-
7: The data pattern is repeated every seven profile versions and suggests that we are dealing with daily profiling.
-
12: The data pattern is repeated every 12 profile versions. This suggests that the data is profiled on a monthly basis.
-
24: There is a repeating pattern in the data every 24 data points or profiles. In other words, it indicates we have hourly data as the data is profiled every hour.
When using time-dependent anomaly detection, the data history must be sufficiently long, or an error is returned.
The number of data points must be more than two times the periodicity value, as well as greater than five.
For example:
-
If the periodicity is seven, there needs to be at least 15 profile versions.
-
If the periodicity is set to two, you need at least six profile versions.
Detected anomalies
|
It is important to note that anomalies displayed in monitoring projects are derived from all available data on catalog items included in the monitoring project. This means that if you have profiled the catalog item manually within the catalog, as part of data observability, or as part of a documentation flow, this information is reflected in the monitoring project results in addition to the information from the project runs. |
If anomalies are detected, you can view these in detail by selecting See more information. Alternatively, click the warning icon where anomalies are present.
Anomaly inspector
Once you have opened the anomaly inspector, you can select whether you would like to view only anomalous items and metrics, or all, by using the Display only anomalous items and Display only anomalous metrics, respectively.
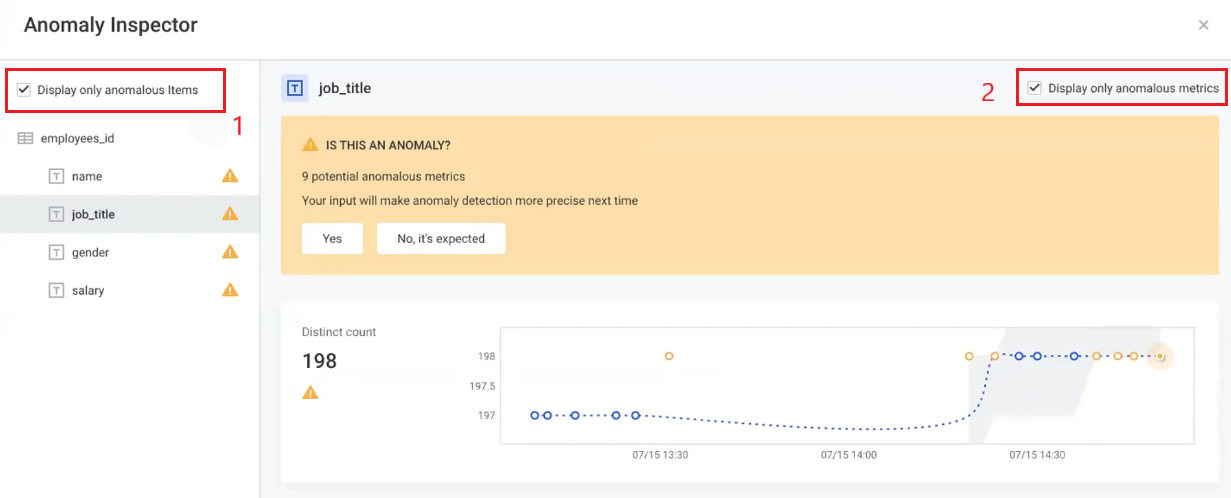
Before confirming or dismissing the anomaly, you can view the metrics in detail.
Catalog item metrics
-
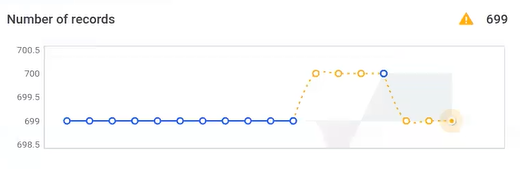
Number of records: the number of records in the catalog item is checked with every profiling.
The gray background in the chart indicates the expected range of the values. Hover over the data points on the chart to see more details.
Attribute metrics
The anomalous results for a particular metric are shown over time with the highlighted outliers. Hover over the points on the chart to see more details such as values, profiling versions, and time.
-
Number of records
-
Mean
-
Minimum
-
Standard deviation
-
Numeric sum
-
Variance
-
Distinct count
-
Duplicate count
-
Non-unique count
-
Null count
-
Maximum
-
Unique count
-
Frequency, masks, and patterns
Confirm or dismiss anomalies
Once anomalies have been detected, you can either confirm them or dismiss them. The anomaly detection model is constantly improved based on this user feedback.

To do this:
-
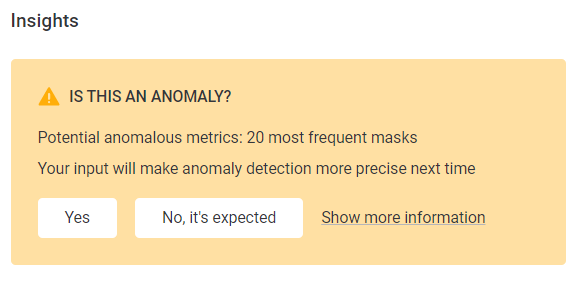
In Is this an anomaly, select Yes to confirm the anomaly, or No, it’s expected to dismiss the anomaly.
Unconfirmed anomalies
If detected anomalies are not confirmed, the system does not know to exclude them from the expected range. After some time (depending on the length of profiling history), the unsolved anomalies are considered the 'new normal', and a return to the expected values can subsequently be identified as anomalous.
Was this page useful?