
August 2026
This release adds freshness SLAs and alerting, lets you reorganize domain and business process hierarchies, rebuilds data quality dashboards around your DQ results, and adds two connectors: the Generic connector for databases without native support and a dedicated Palantir Foundry connector. It also rebuilds the AI Agent and introduces data quality automation via the API.
Freshness SLAs and alerting
Set a freshness SLA on the catalog items you care about, and ONE raises a finding and an alert when the last data write is older than the SLA allows, so you know as soon as a table goes stale.
You can:
-
Detect data writes by scanning supported sources directly, from monitored pipeline jobs, or both.
-
Set the SLA in hours or days on a catalog item’s primary monitor.
-
Route freshness alerts to Slack or Microsoft Teams, or escalate to a ticket in ServiceNow or Jira.
For details, see Freshness Monitoring.
Reorganize domain and business process hierarchies
Move a domain or business process under a different parent, or promote it to the top level.
Previously, a subdomain or a nested business process stayed under the parent you first created it under. Now you can restructure a hierarchy as your organization changes.
For details, see Reorganize Domain and Business Process Hierarchies.
Connect to any JDBC database with the Generic connector
Bring your own JDBC driver for edge processing.
Use the new Generic connector to catalog and process data from databases that have no native connector in Ataccama ONE:
-
Package the JDBC driver and its configuration as an OCI artifact.
-
Publish it to a container registry your edge instance can reach.
-
Deploy the driver directly from the connection settings, then work with the source like any other JDBC database.
Available on connections processed by an edge instance (version 2026.08.04.0 or later). For details, see Generic Connector.
Connect to Palantir Foundry
Catalog and process data from Palantir Foundry with a new native connector.
Because Palantir’s licensing terms don’t allow Ataccama to redistribute the Foundry JDBC driver, you supply the driver yourself, using the same OCI-artifact deployment as the Generic connector. Authentication uses your Foundry OAuth 2.0 client credentials.
Available on connections processed by an edge instance (version 2026.08.12.0 or later). For details, see Palantir Foundry Connection.
Driver bundles must come from a trusted registry
An edge instance now accepts a driver bundle only from a trusted location: by default, dedicated repository prefixes in the Amazon ECR of the edge instance’s own AWS account and region. Drivers already deployed to an edge instance keep working; the change applies the next time you deploy one.
If you published a driver bundle elsewhere, for example, under the edge-drivers prefix shown in earlier documentation, republish it under the allowed prefix and update the connection’s Artifact URL, or make your prefix the allowed one.
For details, including the default prefixes and how to configure them, see Publish under the allowed repository prefix and Customize the driver registry prefixes.
Rebuilt data quality dashboards
A data quality dashboard aggregates the results of several DQ monitors into one overview.
Dashboards now read your data quality results directly from the platform instead of keeping a separate copy of them. Results in a dashboard now always match what you see on the catalog item, and a dashboard always reflects your current permissions.
Alongside that, the rebuilt dashboard brings:
-
Sorting and filtering on both result tables, including by quality ratio, trend, and failed records.
-
A single Quality over time by dimension chart that plots overall quality alongside each dimension, with one point per day, individual lines you can show and hide, and a toggle between percentages and record counts.
-
One Time range filter that applies to the whole dashboard rather than to individual charts.
-
The catalog item shown in the Applied rules table, so you can tell apart rules applied across several catalog items.
-
Results that respect your retention settings. Previously, results could still appear in a dashboard after they were deleted.
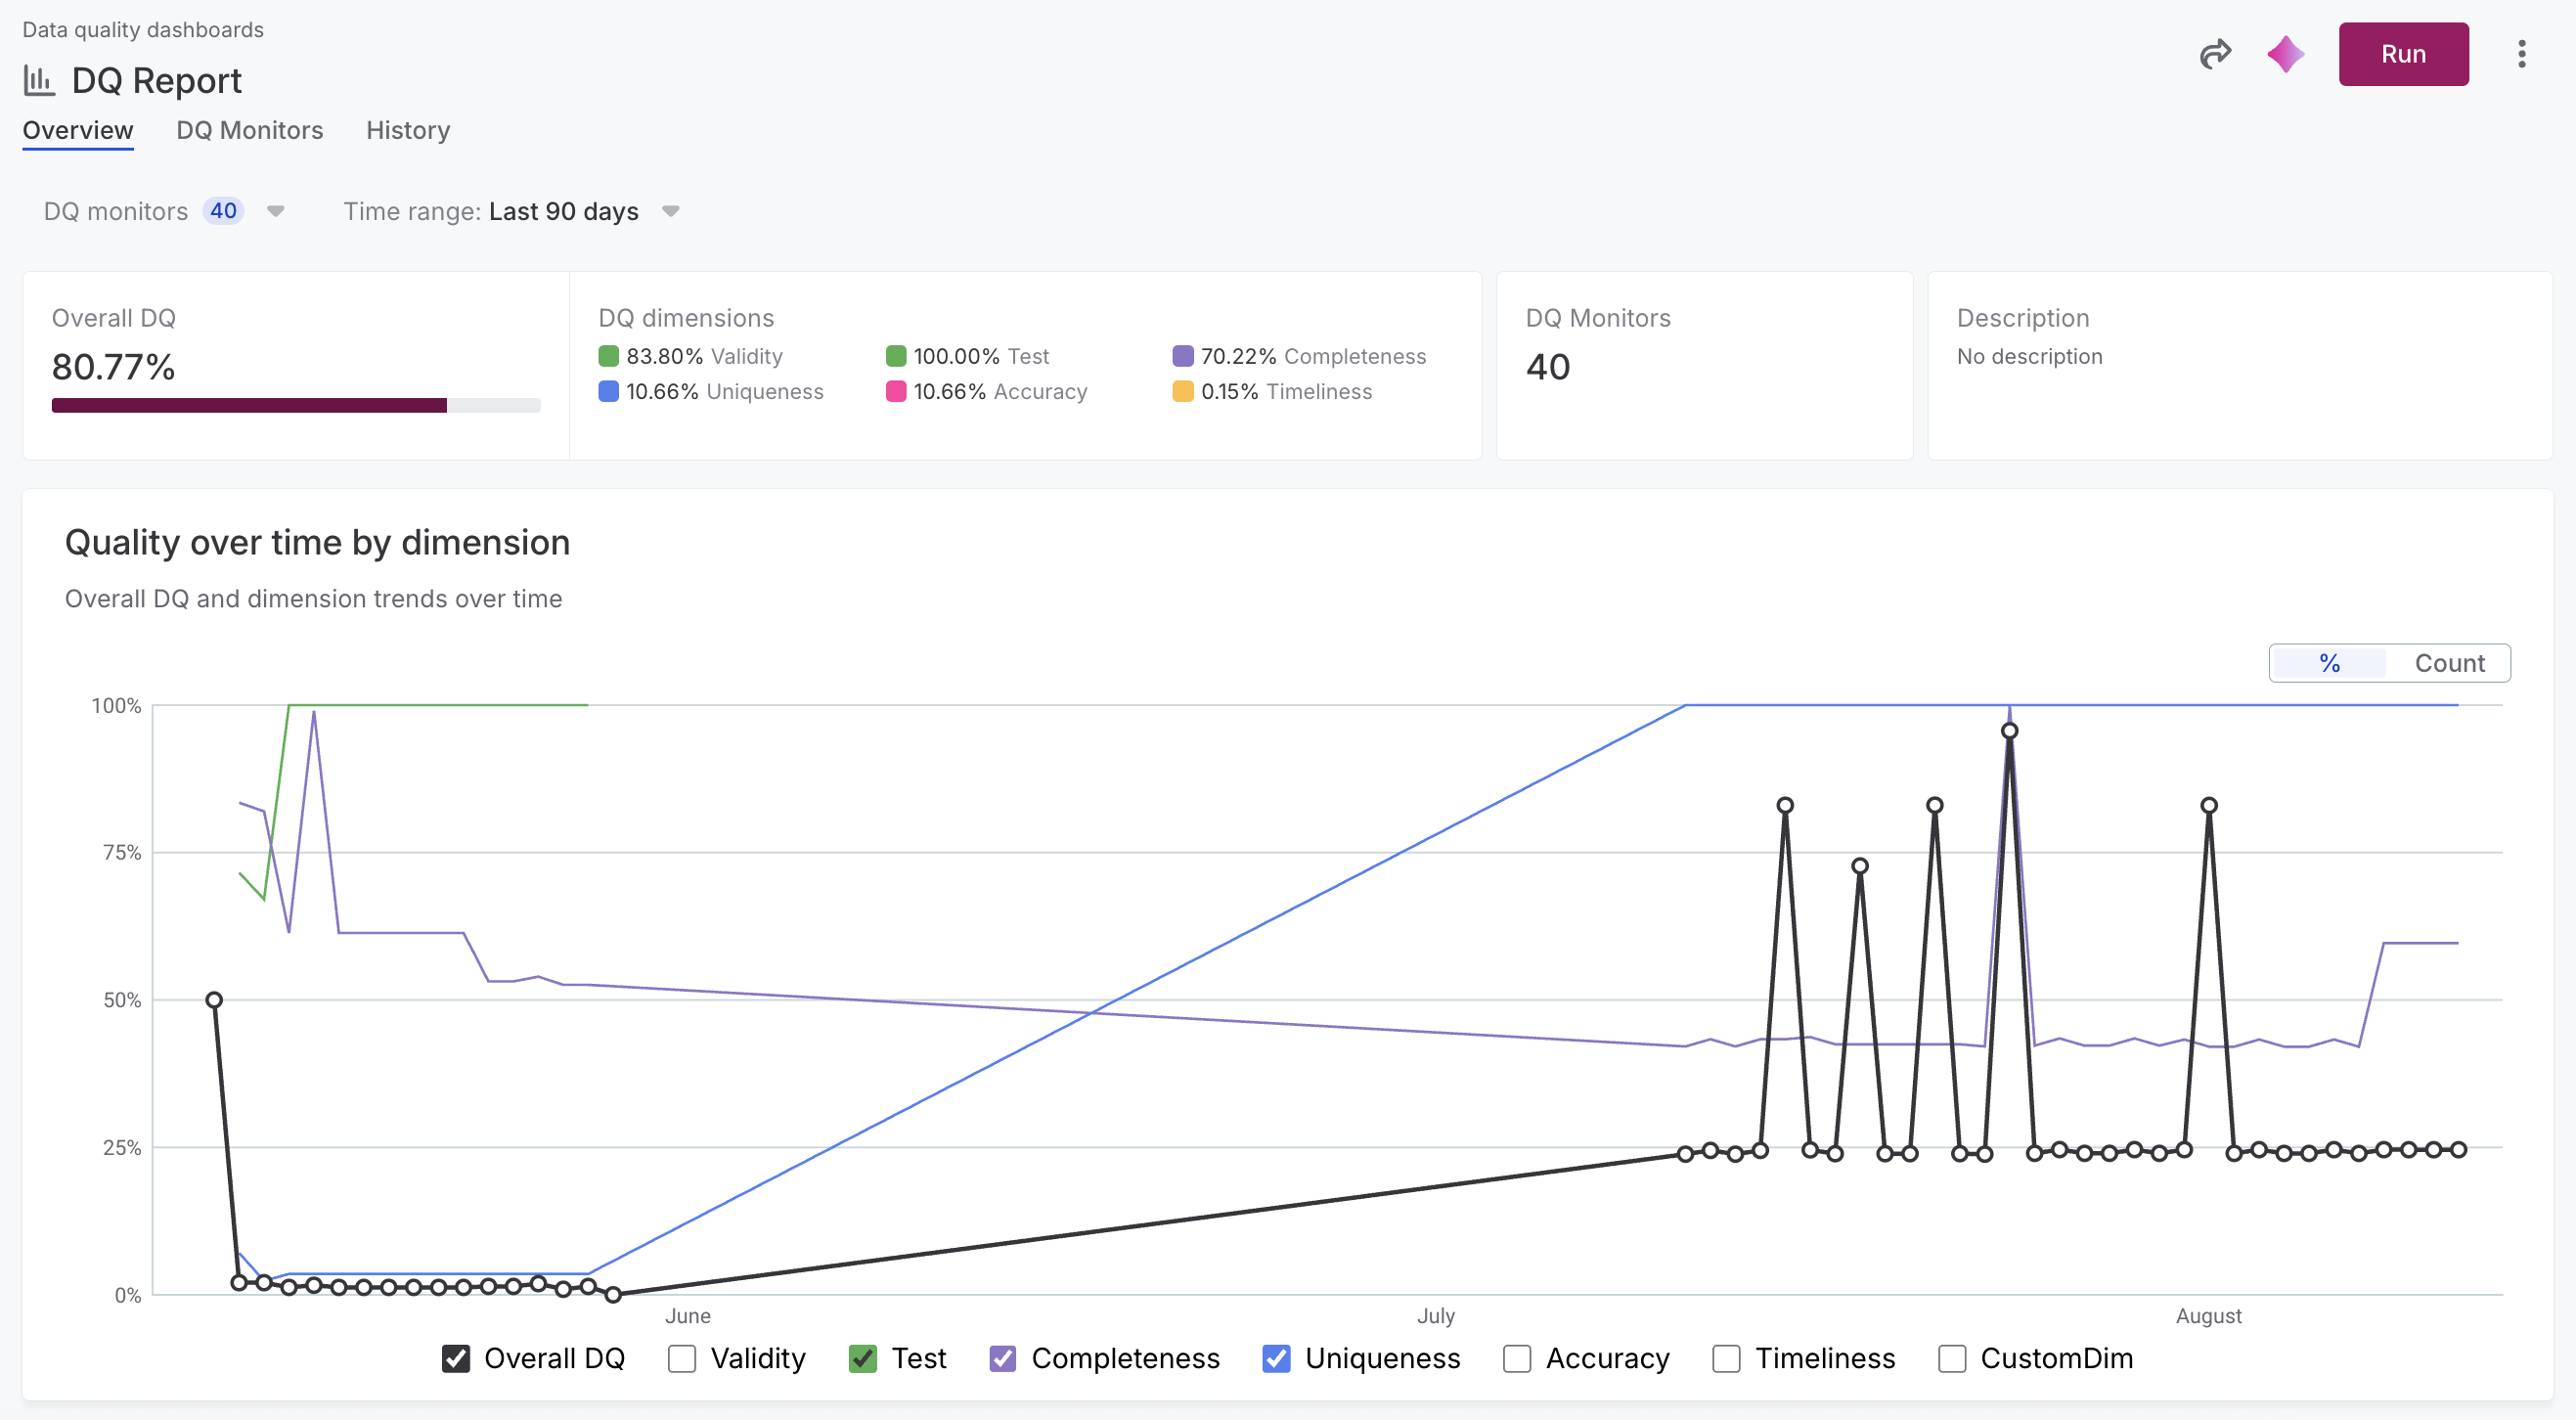
If you used data quality dashboards before this release, your existing report stays selected, so nothing changes until you decide to switch. An administrator can choose which report your dashboards show at Global settings > DQ settings > DQ Dashboards. Choosing Both keeps your existing report on the Overview tab and adds the new one on an Aggregated monitors tab, so you can compare them before switching.
For details, see Data Quality Dashboards.
Automate data quality via the API
Configure and run data quality entirely from code. The public Data Quality API previously only let you read DQ results; now it covers the full lifecycle of DQ rules and monitors, so you can build quality checks directly into your pipelines.
You can use the API to:
-
Create, update, publish, and delete DQ rules and monitors programmatically, including assigning rules to monitors, setting thresholds, and scheduling processing runs.
-
Create rules and monitors in batches of up to 100 per request, for example, when onboarding a new data source or importing rule definitions from external tools.
-
Run DQ evaluation from orchestration tools such as Airflow or dbt Cloud, poll for completion, and use the results to stop the pipeline when quality thresholds are breached.
-
Move rules and monitors between environments, such as from development to production, by combining the endpoints in your own tooling.
Processing runs started by the Data Quality API are tracked through the Processing API (see the API documentation). Use it to poll a workflow, list runs across your environment, cancel a running workflow, and diagnose failed ones.
| The API is in Early Access Preview. The API specification and endpoints might change before being marked as stable. |
To get started, see:
-
Set up DQ Rules and Monitors via API: Create and publish rules, configure a monitor, and run the first evaluation on a newly connected data source.
-
Run DQ Evaluation from Pipelines: Run DQ evaluation from your pipeline, poll for completion, and decide whether to stop or proceed based on the results.
-
Move DQ Rules and Monitors Between Environments: Migrate configuration to another environment and propagate later changes.
For details about individual endpoints, see the API documentation, and use URN Reference to understand the identifiers the API works with.
Rebuilt AI Agent
The AI Agent has been rebuilt on a graph-based agentic framework designed for long-running, auditable work.
It now plans more reliably on multi-step tasks. Given a goal, it builds a plan, works through it step by step, and adjusts the plan when a step doesn’t produce what it expected, instead of failing outright.
It also draws on skills: focused packages of instructions and tools for a specific kind of task, loaded only once the AI Agent selects one for the job, which keeps its attention on the task in front of it.
You stay in control of what it changes:
-
Expand the AI Agent’s decision and action tree to follow what it decided at each step and which tool it called, and work through the steps in any order.
-
Approve actions that modify your data or metadata before they run.
-
Review everything the AI Agent did in Review changes, and revert individual changes you don’t want to keep.
-
Rate any response with thumbs up or thumbs down.
The AI Agent works across more of the platform than before:
-
Run profiling and DQ evaluation on demand, then carry the results straight into rule suggestions.
-
Create business glossary terms, compare them, and link them to the data they describe.
-
Flag critical data elements, with a category and rationale for each.
-
Create transformation rules and transformation catalog items, and explain what existing rules and plans do.
-
Find, create, compare, and edit reference data tables, records, and schemas, and publish pending changes.
-
Search by assigned business term, by owner, or by how well an asset fits a stated purpose.
-
Look up data protection classifications and trace where a catalog item’s data comes from.
This means you can now hand over a full governance pass on a catalog item in one request, from assigning a steward through to reading the resulting Data Trust Index.
For details, see AI Agent, and AI Agent Handbook for use cases and example prompts.
Was this page useful?