
Pipeline Monitoring
Pipeline monitoring gives you visibility into the execution of your data pipelines directly within Ataccama ONE. By connecting your orchestration tools, you can track job runs, detect failures, and investigate alerts without leaving the platform.
What pipeline monitoring provides
When you connect an orchestrator, Ataccama ONE receives execution metadata for every pipeline run. This enables you to:
-
Track job executions: See which jobs are running, completed, or failed across your data ecosystem.
-
Detect failures early: Identify failed or aborted jobs as soon as they occur.
-
Investigate alerts and findings in context: View job history, run durations, and failure patterns alongside your data assets.
-
Trigger alerts: Automatically create alerts when jobs fail, and notify the right people through your preferred channels.
How pipeline monitoring works
Pipeline monitoring uses the OpenLineage standard to collect execution metadata from your orchestration tools.
When you configure an orchestrator connection:
-
Your orchestration tool sends OpenLineage events to ONE.
-
Events are processed and associated with the connection you created.
-
Job executions appear in the Pipeline monitoring module, where you can monitor status and investigate issues.
-
If configured, alerts are triggered for job failures and sent to the appropriate audiences.
Supported orchestrators
Pipeline monitoring currently supports:
-
Apache Airflow with OpenLineage
-
dbt Core with OpenLineage
-
Dagster with OpenLineage
-
AWS Glue with OpenLineage
-
Azure Data Factory with OpenLineage
-
GCP Cloud Data Fusion with OpenLineage
Prerequisites
Before you can monitor pipelines, you need:
- Administrative access to your orchestrator
-
You must be able to configure OpenLineage settings in your orchestrator environment, including setting endpoint URLs and API keys.
- A supported orchestration tool
-
See Supported orchestrators for the list of currently supported tools.
- Appropriate permissions
-
You need sufficient permissions in ONE to create orchestrator connections and view pipeline monitoring data. For details, see Manage Data Observability Permissions.
Get started
Setting up pipeline monitoring involves three steps: creating a connection in ONE, configuring your orchestrator to send events, and optionally setting up alerts for job failures.
Step 1: Create an orchestrator connection
Create a connection in ONE to receive events from your orchestration tool.
-
Navigate to Data Observability > Pipeline monitoring.
-
Select Add connection.
-
Provide a display name and select your connection type.
-
Generate an API key and copy the OpenLineage endpoint URL.
For detailed instructions, see Connect to an Orchestrator.
Step 2: Configure your orchestrator
Use the API key and endpoint URL from the previous step to configure your orchestration tool.
-
For Apache Airflow, install the OpenLineage provider and configure the transport. See Configure Apache Airflow with OpenLineage.
-
For dbt Core, install the
openlineage-dbtpackage and set the required environment variables. See Configure dbt Core with OpenLineage. -
For Dagster, configure the OpenLineage integration in your Dagster project. See Configure Dagster with OpenLineage.
-
For AWS Glue, configure the OpenLineage transport in your Glue job. See Configure AWS Glue with OpenLineage.
-
For Azure Data Factory, configure the OpenLineage integration using the provided package. See Configure Azure Data Factory with OpenLineage.
-
For GCP Cloud Data Fusion, configure the OpenLineage integration using the provided package. See Configure Cloud Data Fusion with OpenLineage.
Once configured, your orchestrator begins sending execution events to ONE.
Step 3: Set up alerts for job failures (recommended)
To be notified when jobs fail, configure alert notifications that match pipeline monitoring findings.
-
Navigate to Alerts from the quick access menu.
-
Select the Notifications tab.
-
Create a notification policy with:
-
Finding type: Select Job failure, Job aborted, or both under Pipeline monitoring.
-
Severity: Choose which severity levels should trigger notifications.
-
Audiences: Select who should receive notifications.
-
For detailed instructions, see Get Notifications for Alerts.
| Start by creating a single notification policy for all critical pipeline failures. You can refine your notification strategy as you learn which alerts are most valuable to your team. |
Monitor your pipelines
Once your orchestrator is connected and sending events, you can monitor pipeline executions in two places.
Pipeline monitoring
Navigate to Data Observability > Pipeline monitoring to see all your orchestrator connections and their job executions.
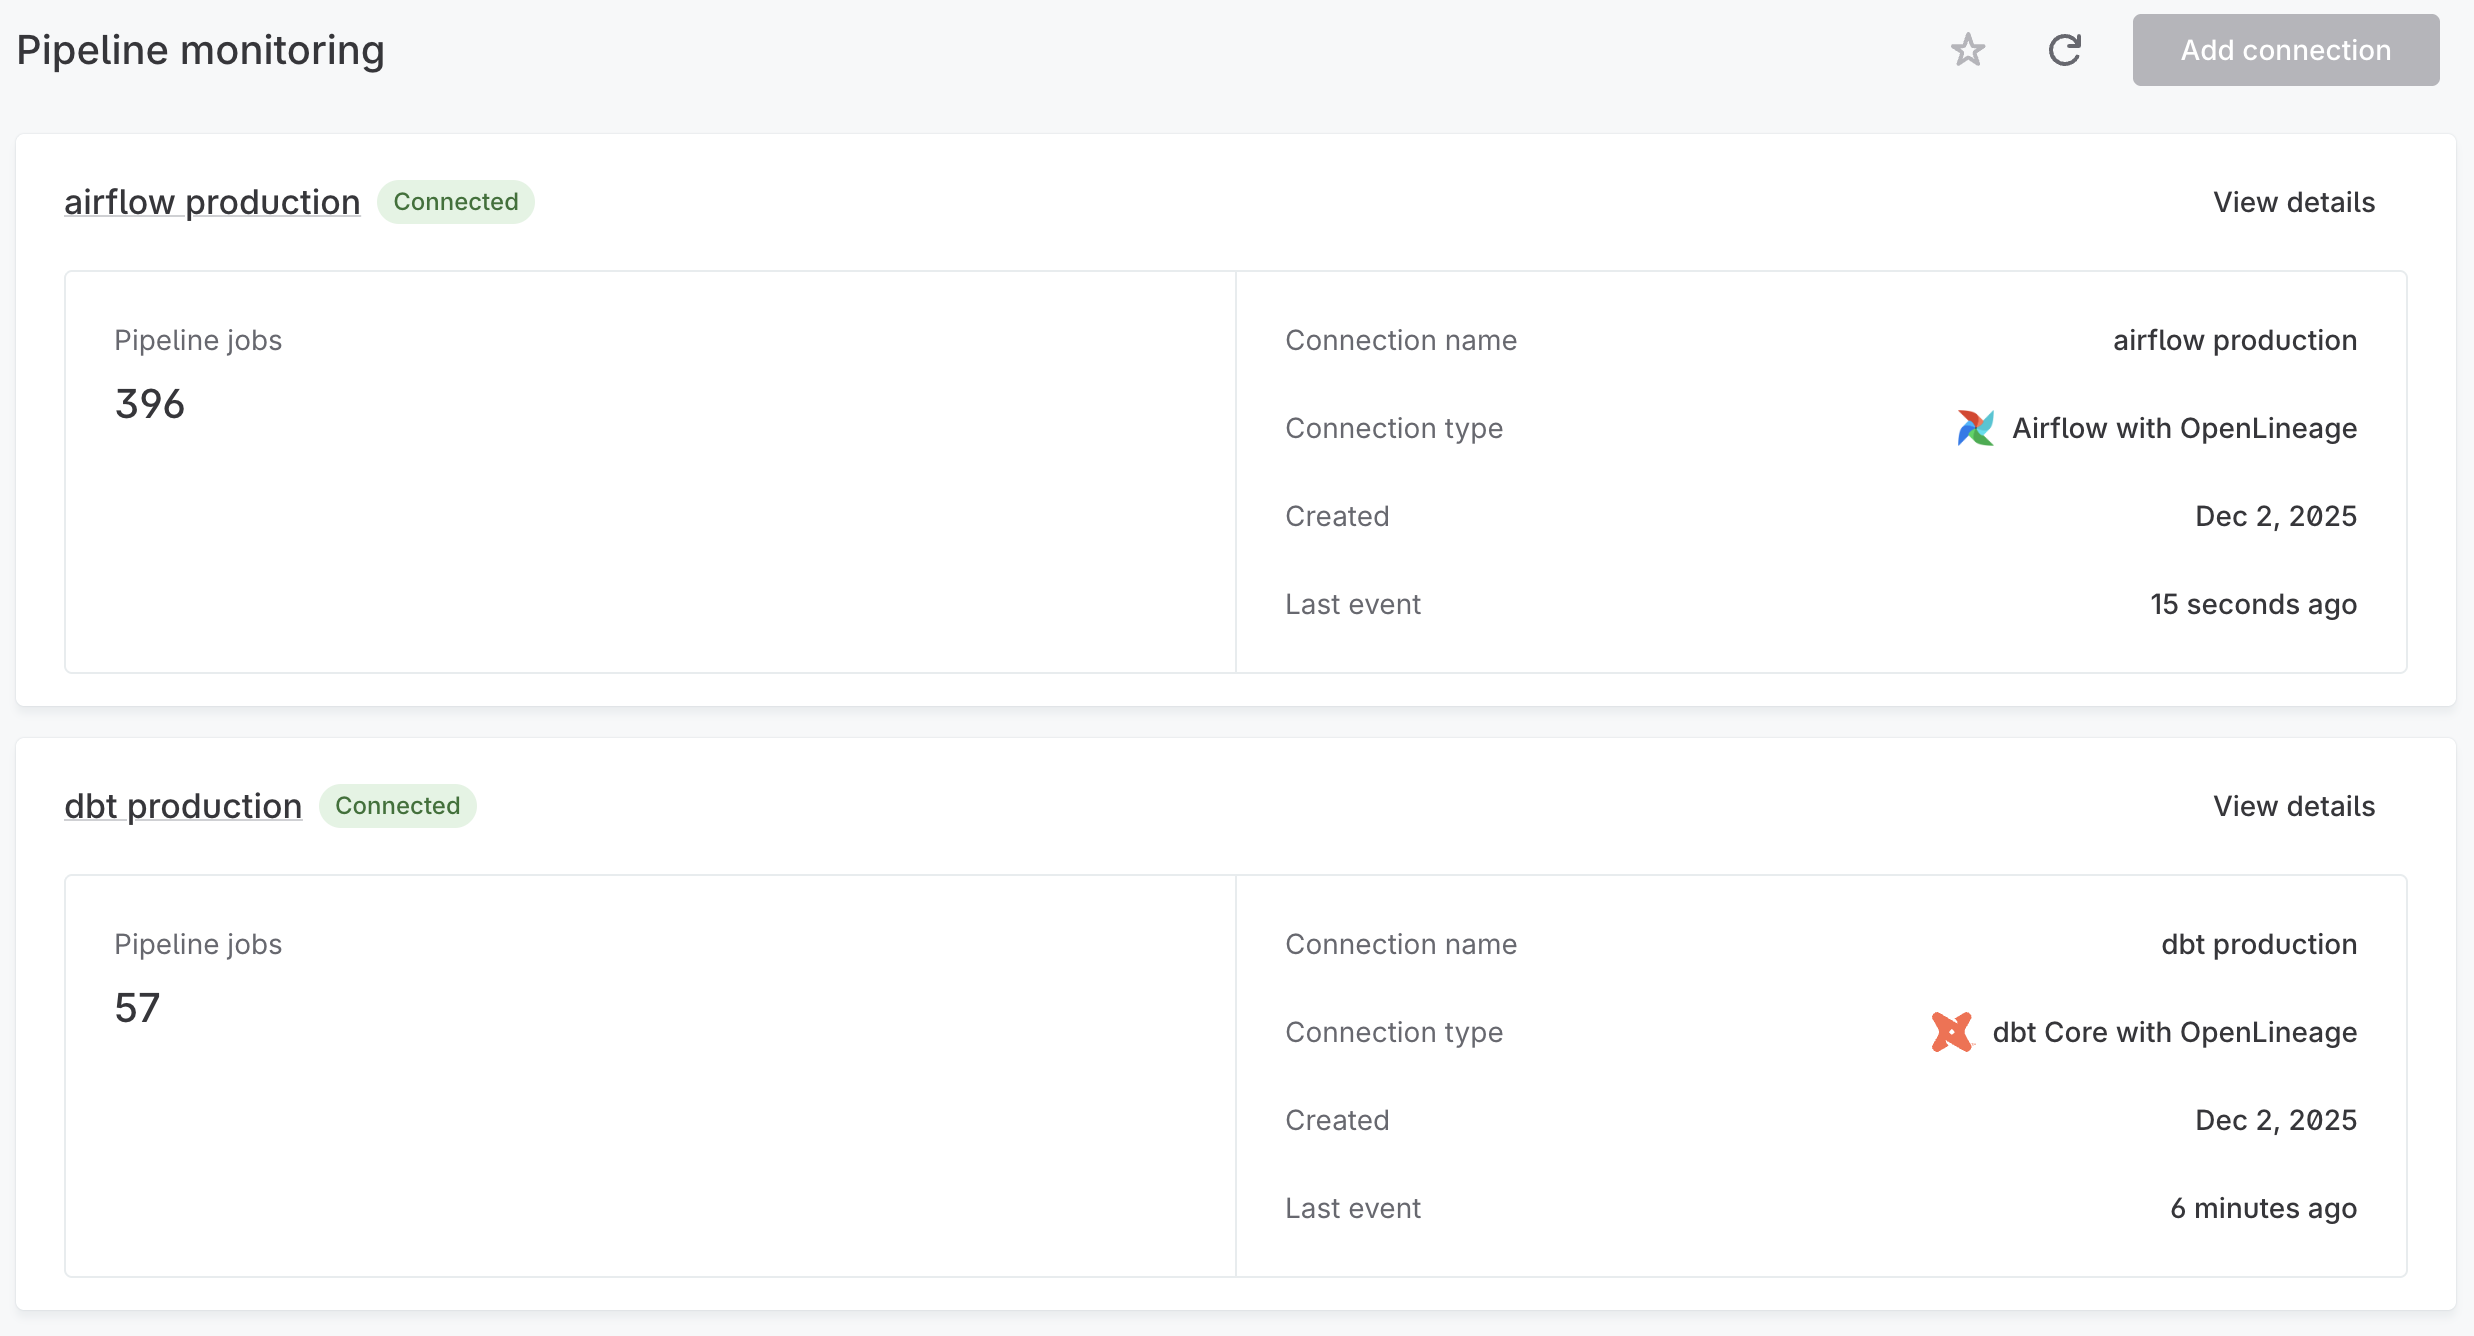
Each connection card displays the number of pipeline jobs tracked, the connection type, when it was created, and how recently the last event was received. Select View details to open the connection detail page.
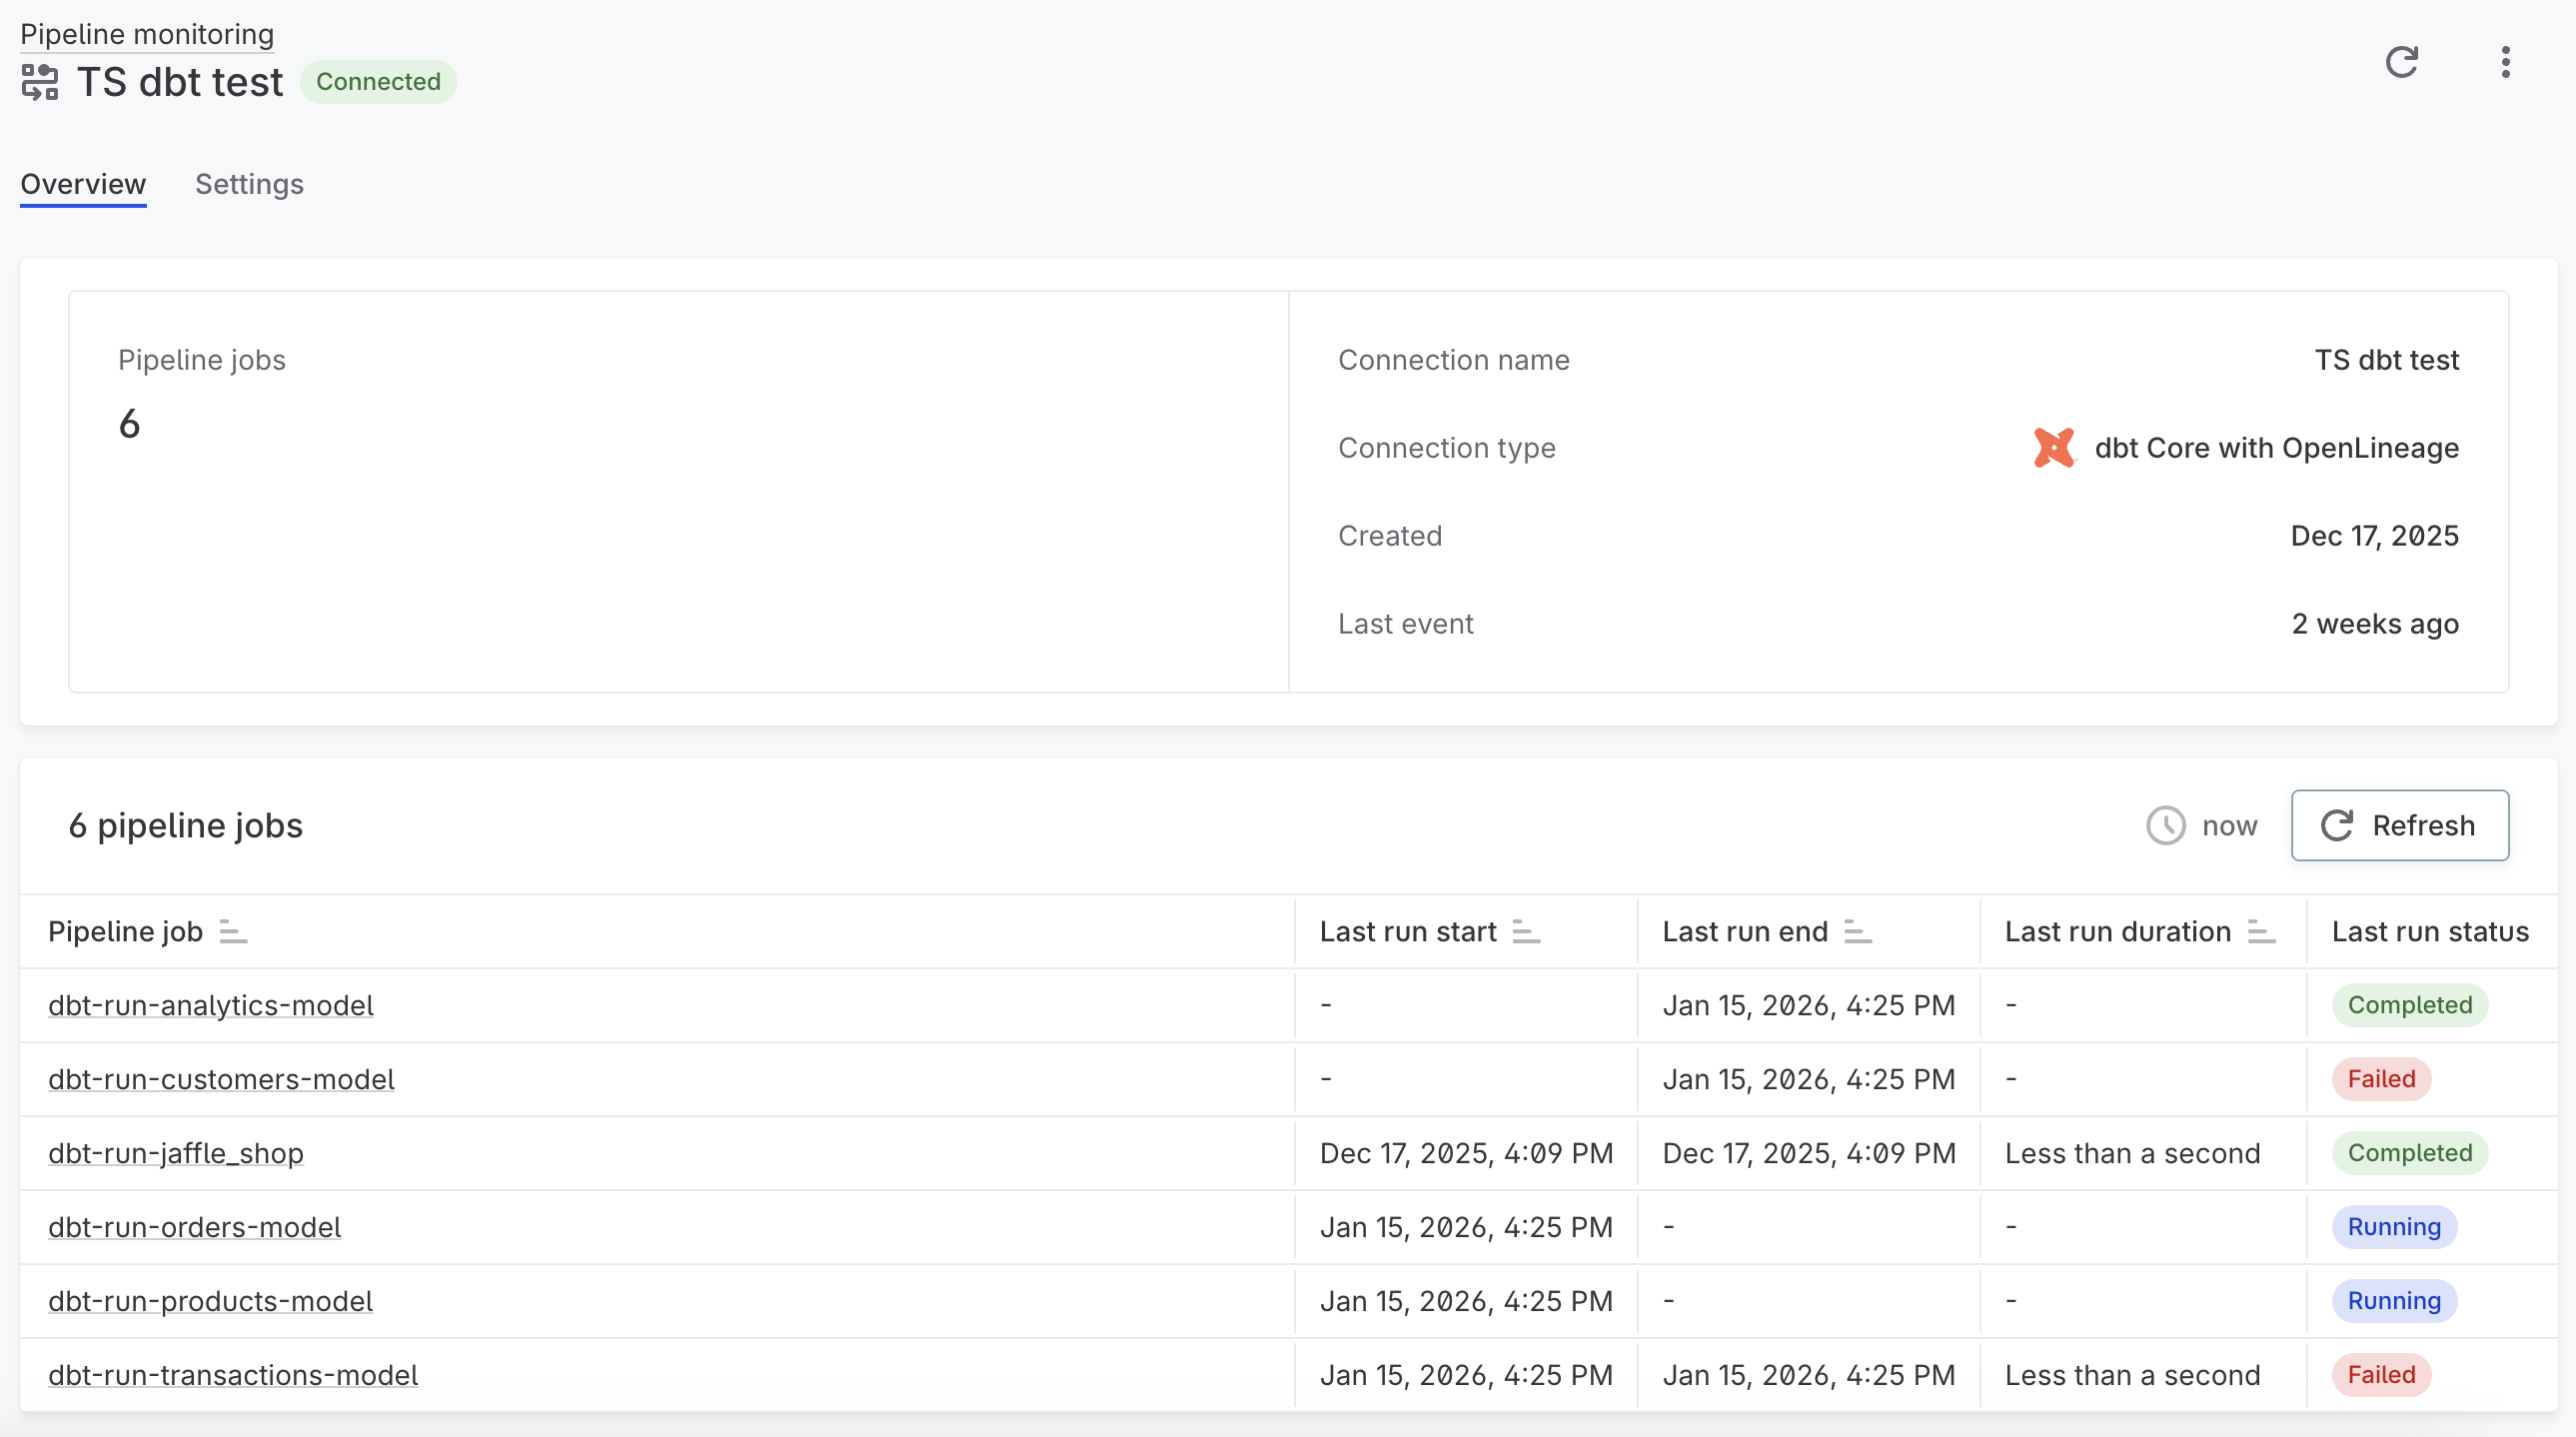
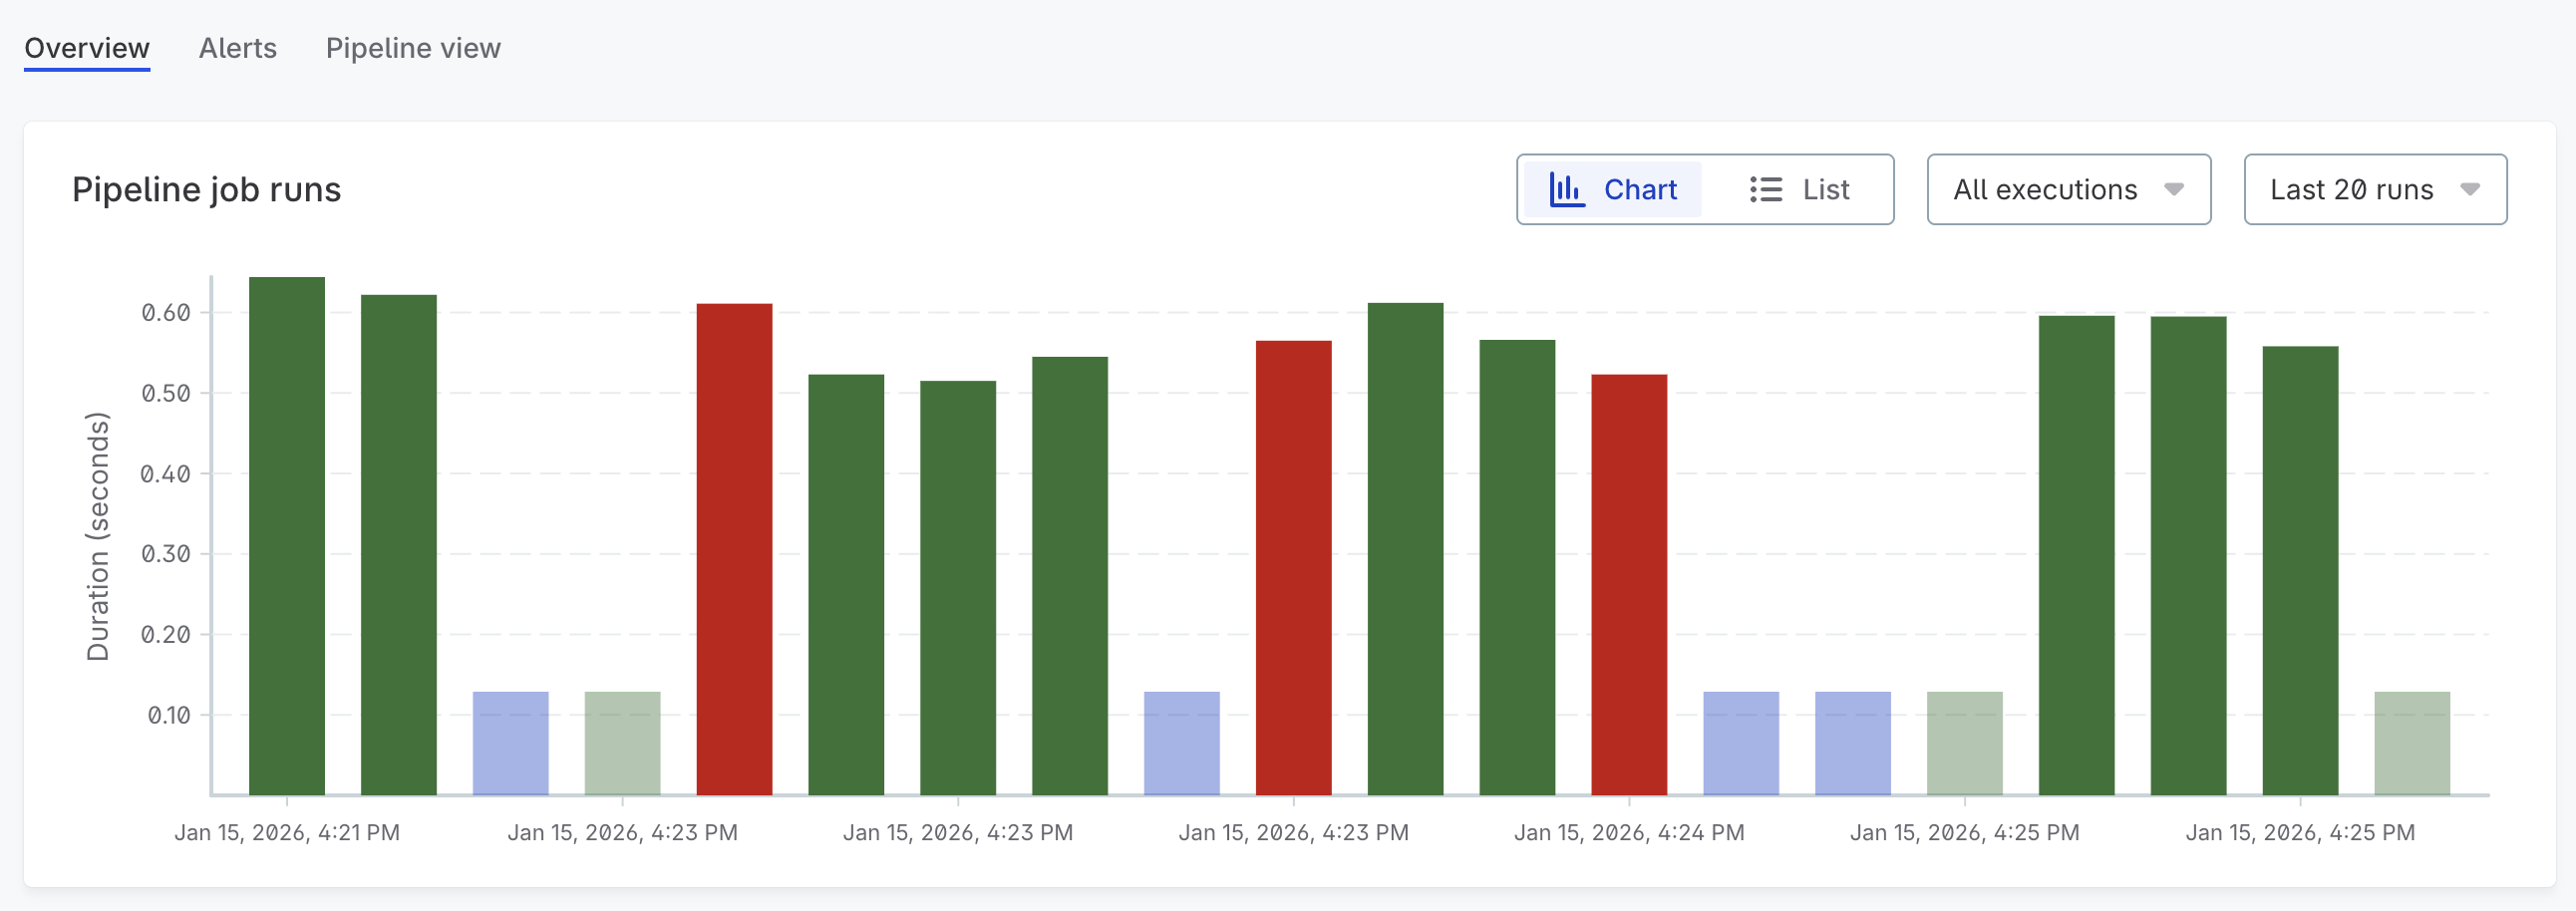
The detail page shows connection information and a table of all pipeline jobs tracked by this connection. For each job, you can see the last run start and end times, duration, and status (Completed, Failed, or Running). Select a job to view its full run history and related alerts.
Alerts feed
Navigate to Alerts to see pipeline-related alerts alongside other findings. Filter by finding type (Job failure, Job aborted) to focus on pipeline issues.
Each alert provides:
-
Details about the failed job and when it occurred
-
A pipeline view showing affected assets and downstream impact
-
Resolution tracking to document how issues were addressed
For more information about working with alerts, see Investigate Alerts.
Next steps
-
Connect to an Orchestrator — Create and manage orchestrator connections.
-
Alerts and Notifications — Learn how alerts and notifications work.
-
Get Notifications for Alerts — Route pipeline alerts to the right people.
Was this page useful?