
Investigate Alerts
The alerts feed provides a centralized view of all alerts in your environment. Use it to review the health of your data pipelines, investigate issues, and track resolution progress.
Access the alerts feed
Select Alerts from the quick access menu in the main navigation. The Alerts page opens with the Alerts feed tab selected by default.
Filter alerts
By default, the alerts feed shows all active alerts. Use filters to focus on specific alerts:
-
Search: Find alerts by name or description.
-
Status: Filter by Active, Inactive, or Stale alerts.
-
Resolution: Filter by resolution state (Not set, Expected, False positive, Open, or Resolved).
-
Severity: Filter by severity level (Critical, High, Medium, or Low).
-
Alert started: Filter by when the alert was first detected.
-
Finding type: Filter by the type of finding that triggered the alert, such as job failures, DQ threshold breaches, or profiling anomalies.
To filter alerts for specific assets, select Add catalog items or Add jobs.
Understand alert cards
Each alert in the feed displays:
-
Title: A description of the alert, including the affected asset.
-
Status: Whether the alert is Active, Inactive, or Stale.
-
Time: How long ago the alert was first detected.
-
Finding summary: A count or breakdown of the findings in this alert.
-
Severity: The highest severity level among the alert’s findings.
-
Resolution: The current resolution state, or "Not set" if no resolution has been selected.
View alert details
Select an alert to open its detail page. The detail page has two tabs:
Overview
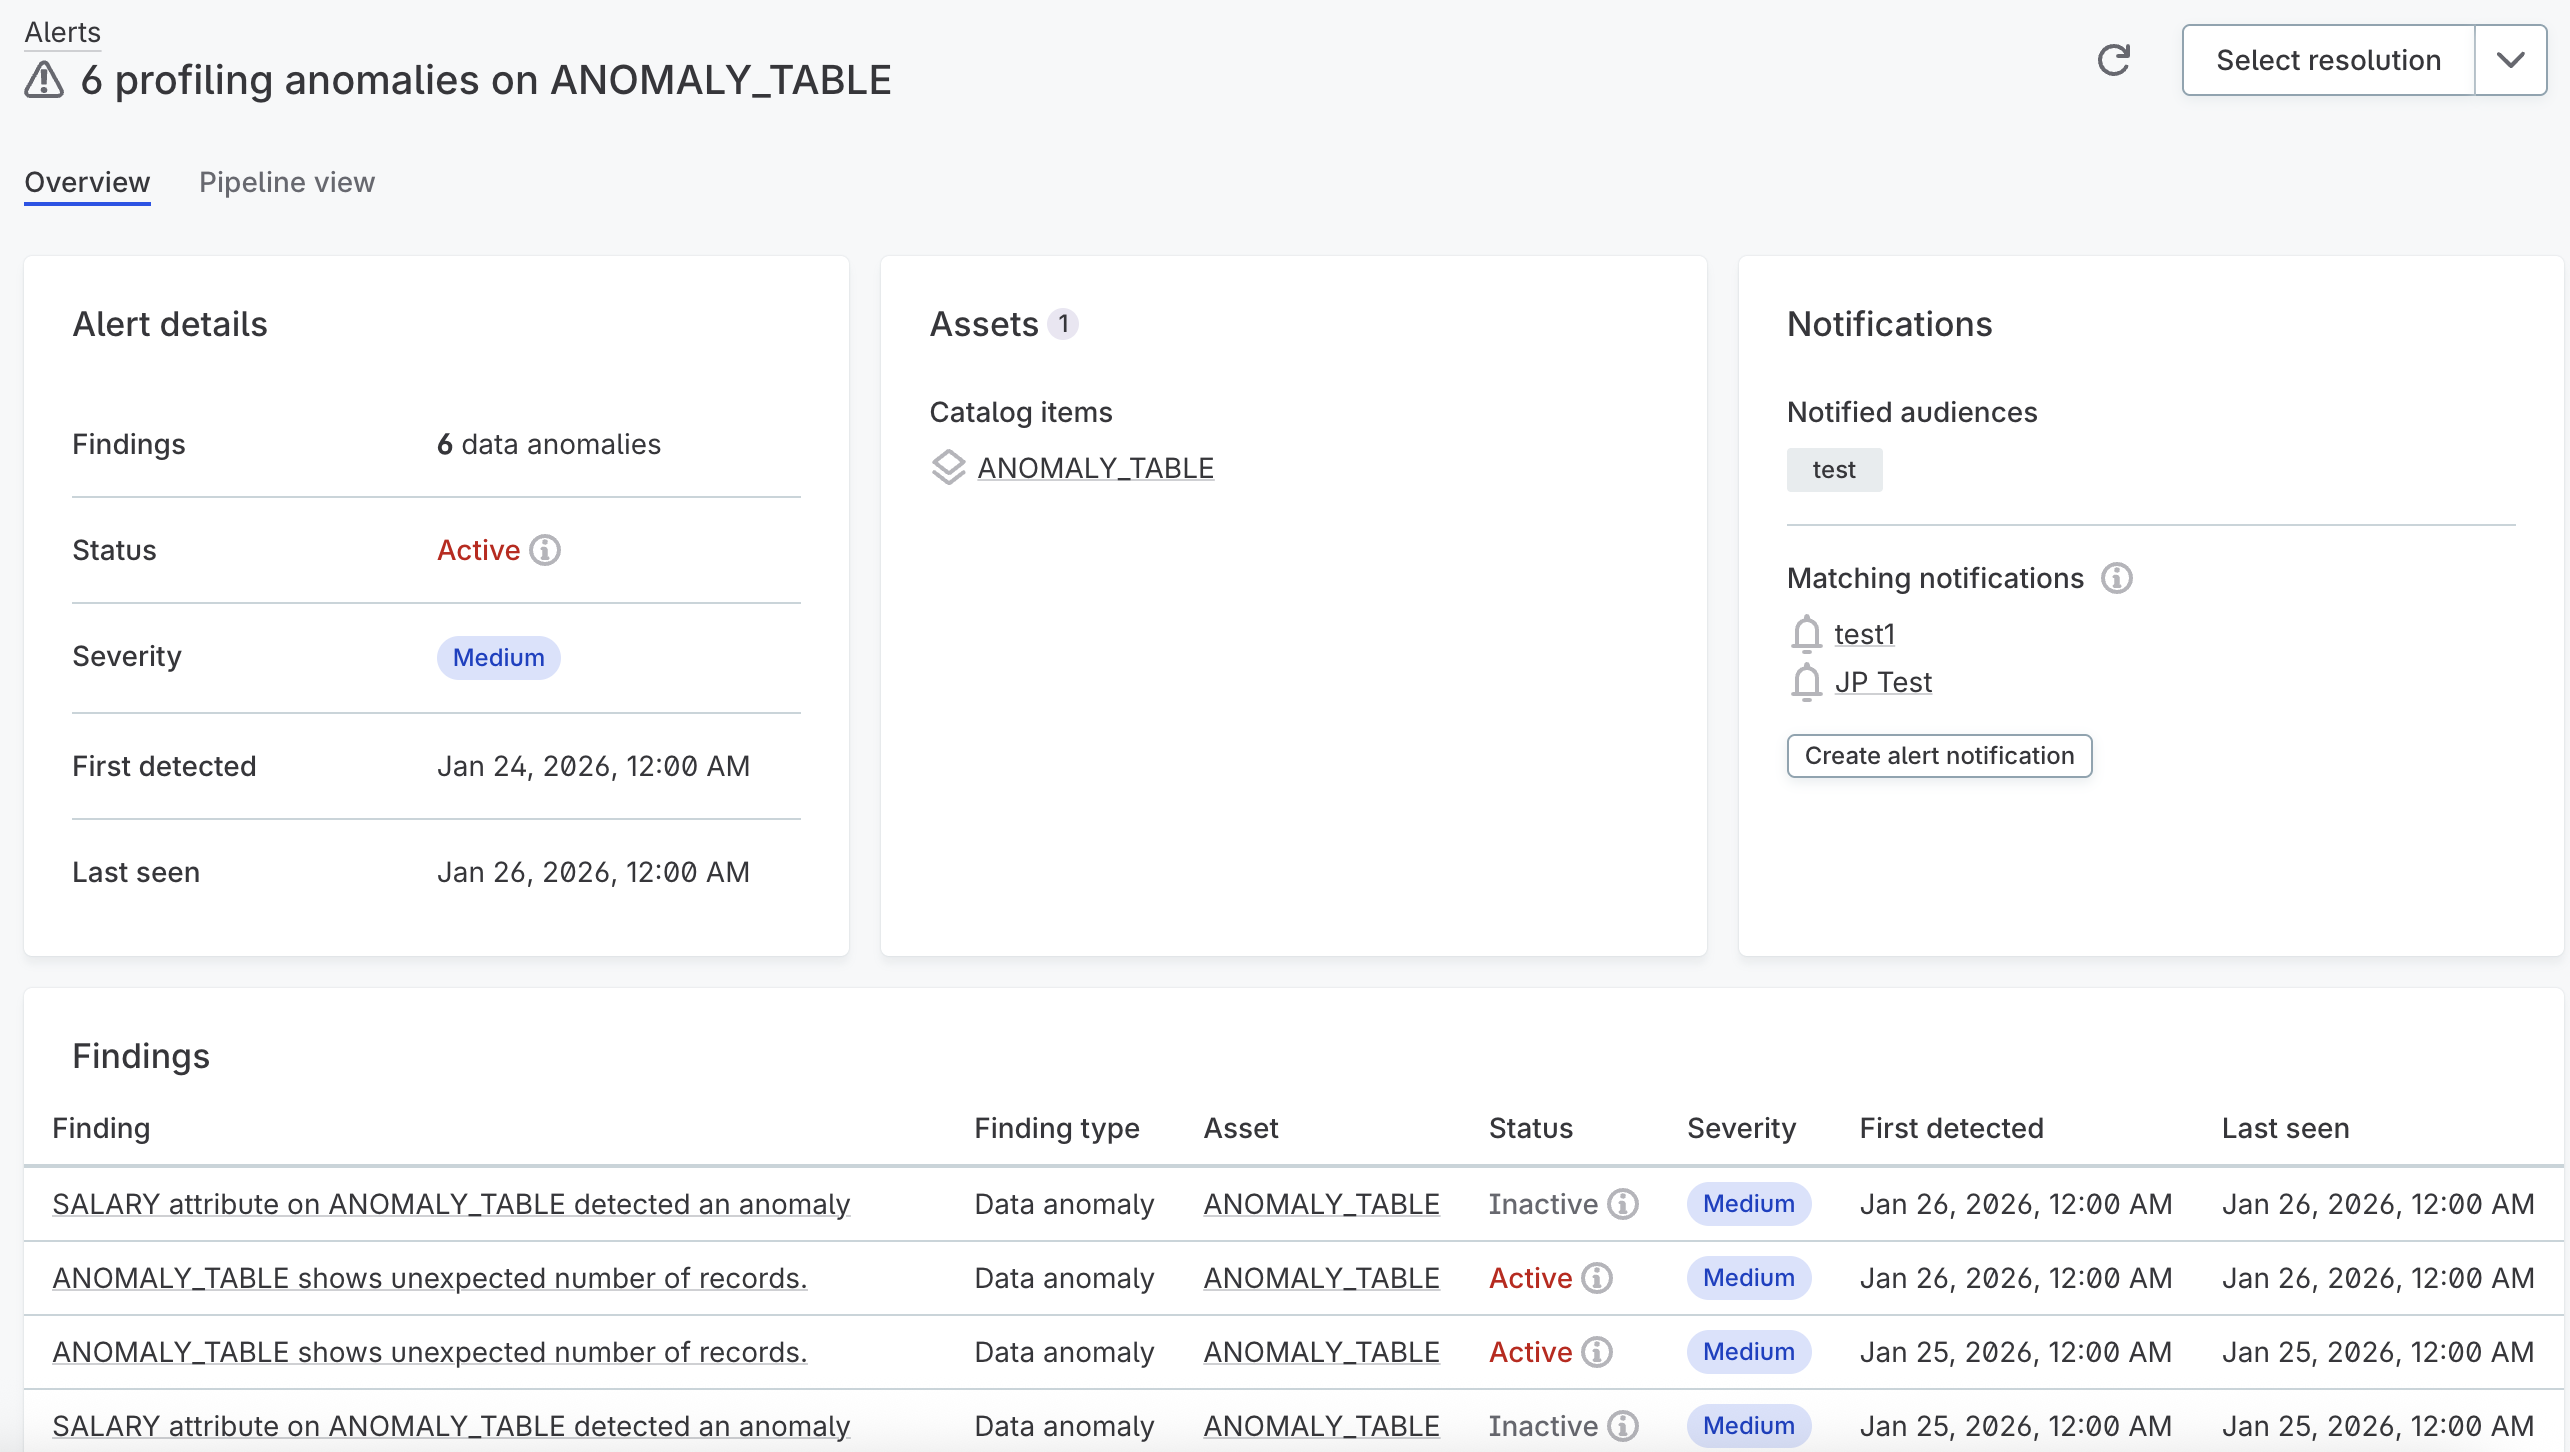
The Overview tab displays:
- Alert details
-
Summary information including finding count, status, severity, when the alert was first detected, and when it was last seen.
While an alert is Active, the Last seen field shows the most recent timestamp from the source system indicating a finding was active. Once an alert becomes Inactive, this field changes to Ended and displays when the alert concluded.
- Assets
-
A list of catalog items, pipeline jobs, or non-catalog assets affected by this alert. Select any asset to navigate directly to its detail page.
Assets appear in the following order: pipeline jobs, catalog items, then non-catalog assets. If all three types are present, non-catalog assets are hidden by default and can be revealed by selecting Show non-catalog assets.
- Notifications
-
Shows which notification policies matched this alert and which audiences were notified.
Notified audiences shows the audiences who received notifications about this alert. If no one was notified, this section indicates that no audiences were notified.
Matching notifications lists notification policies whose criteria match this alert. These policies will trigger notifications for future similar alerts.
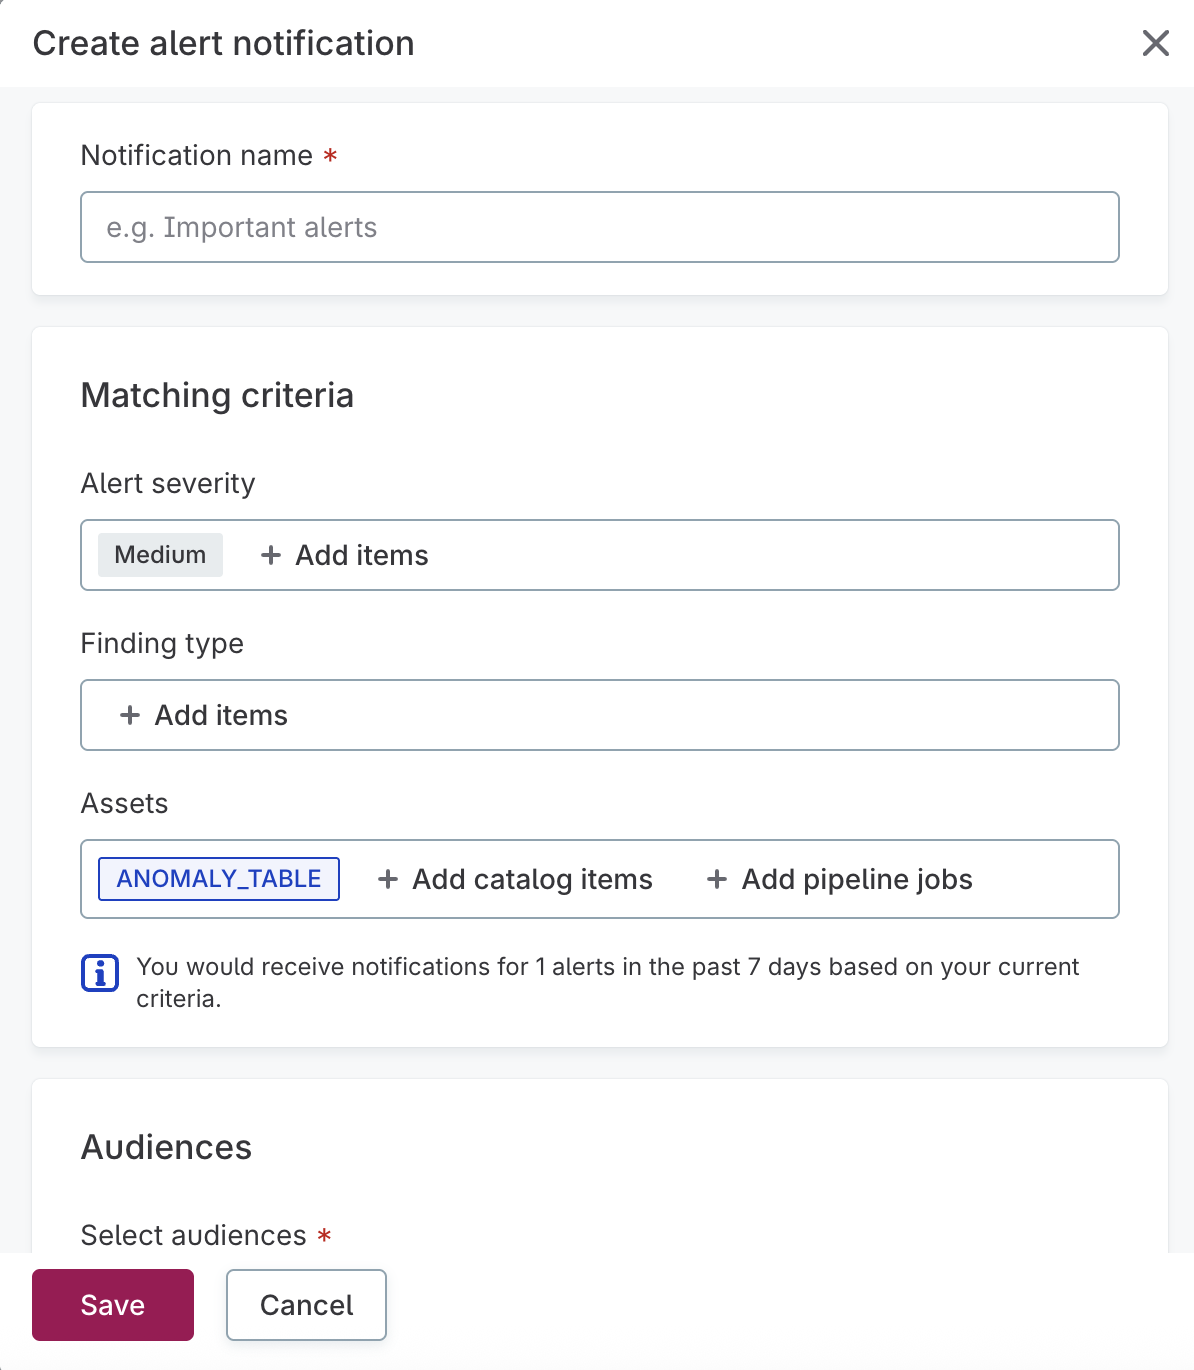
Select Create alert notification to create a new notification policy with criteria prefilled to match the current alert, including severity, finding type, and affected assets. This makes it easy to ensure you’re notified about similar alerts in the future.
- Findings table
-
A detailed list of all findings in this alert, showing each finding’s description, finding type, affected asset, status, severity, first detected time, and last seen time.
Select a finding to view its detail page with additional information such as threshold details, pass/fail record counts, and a history of finding updates.
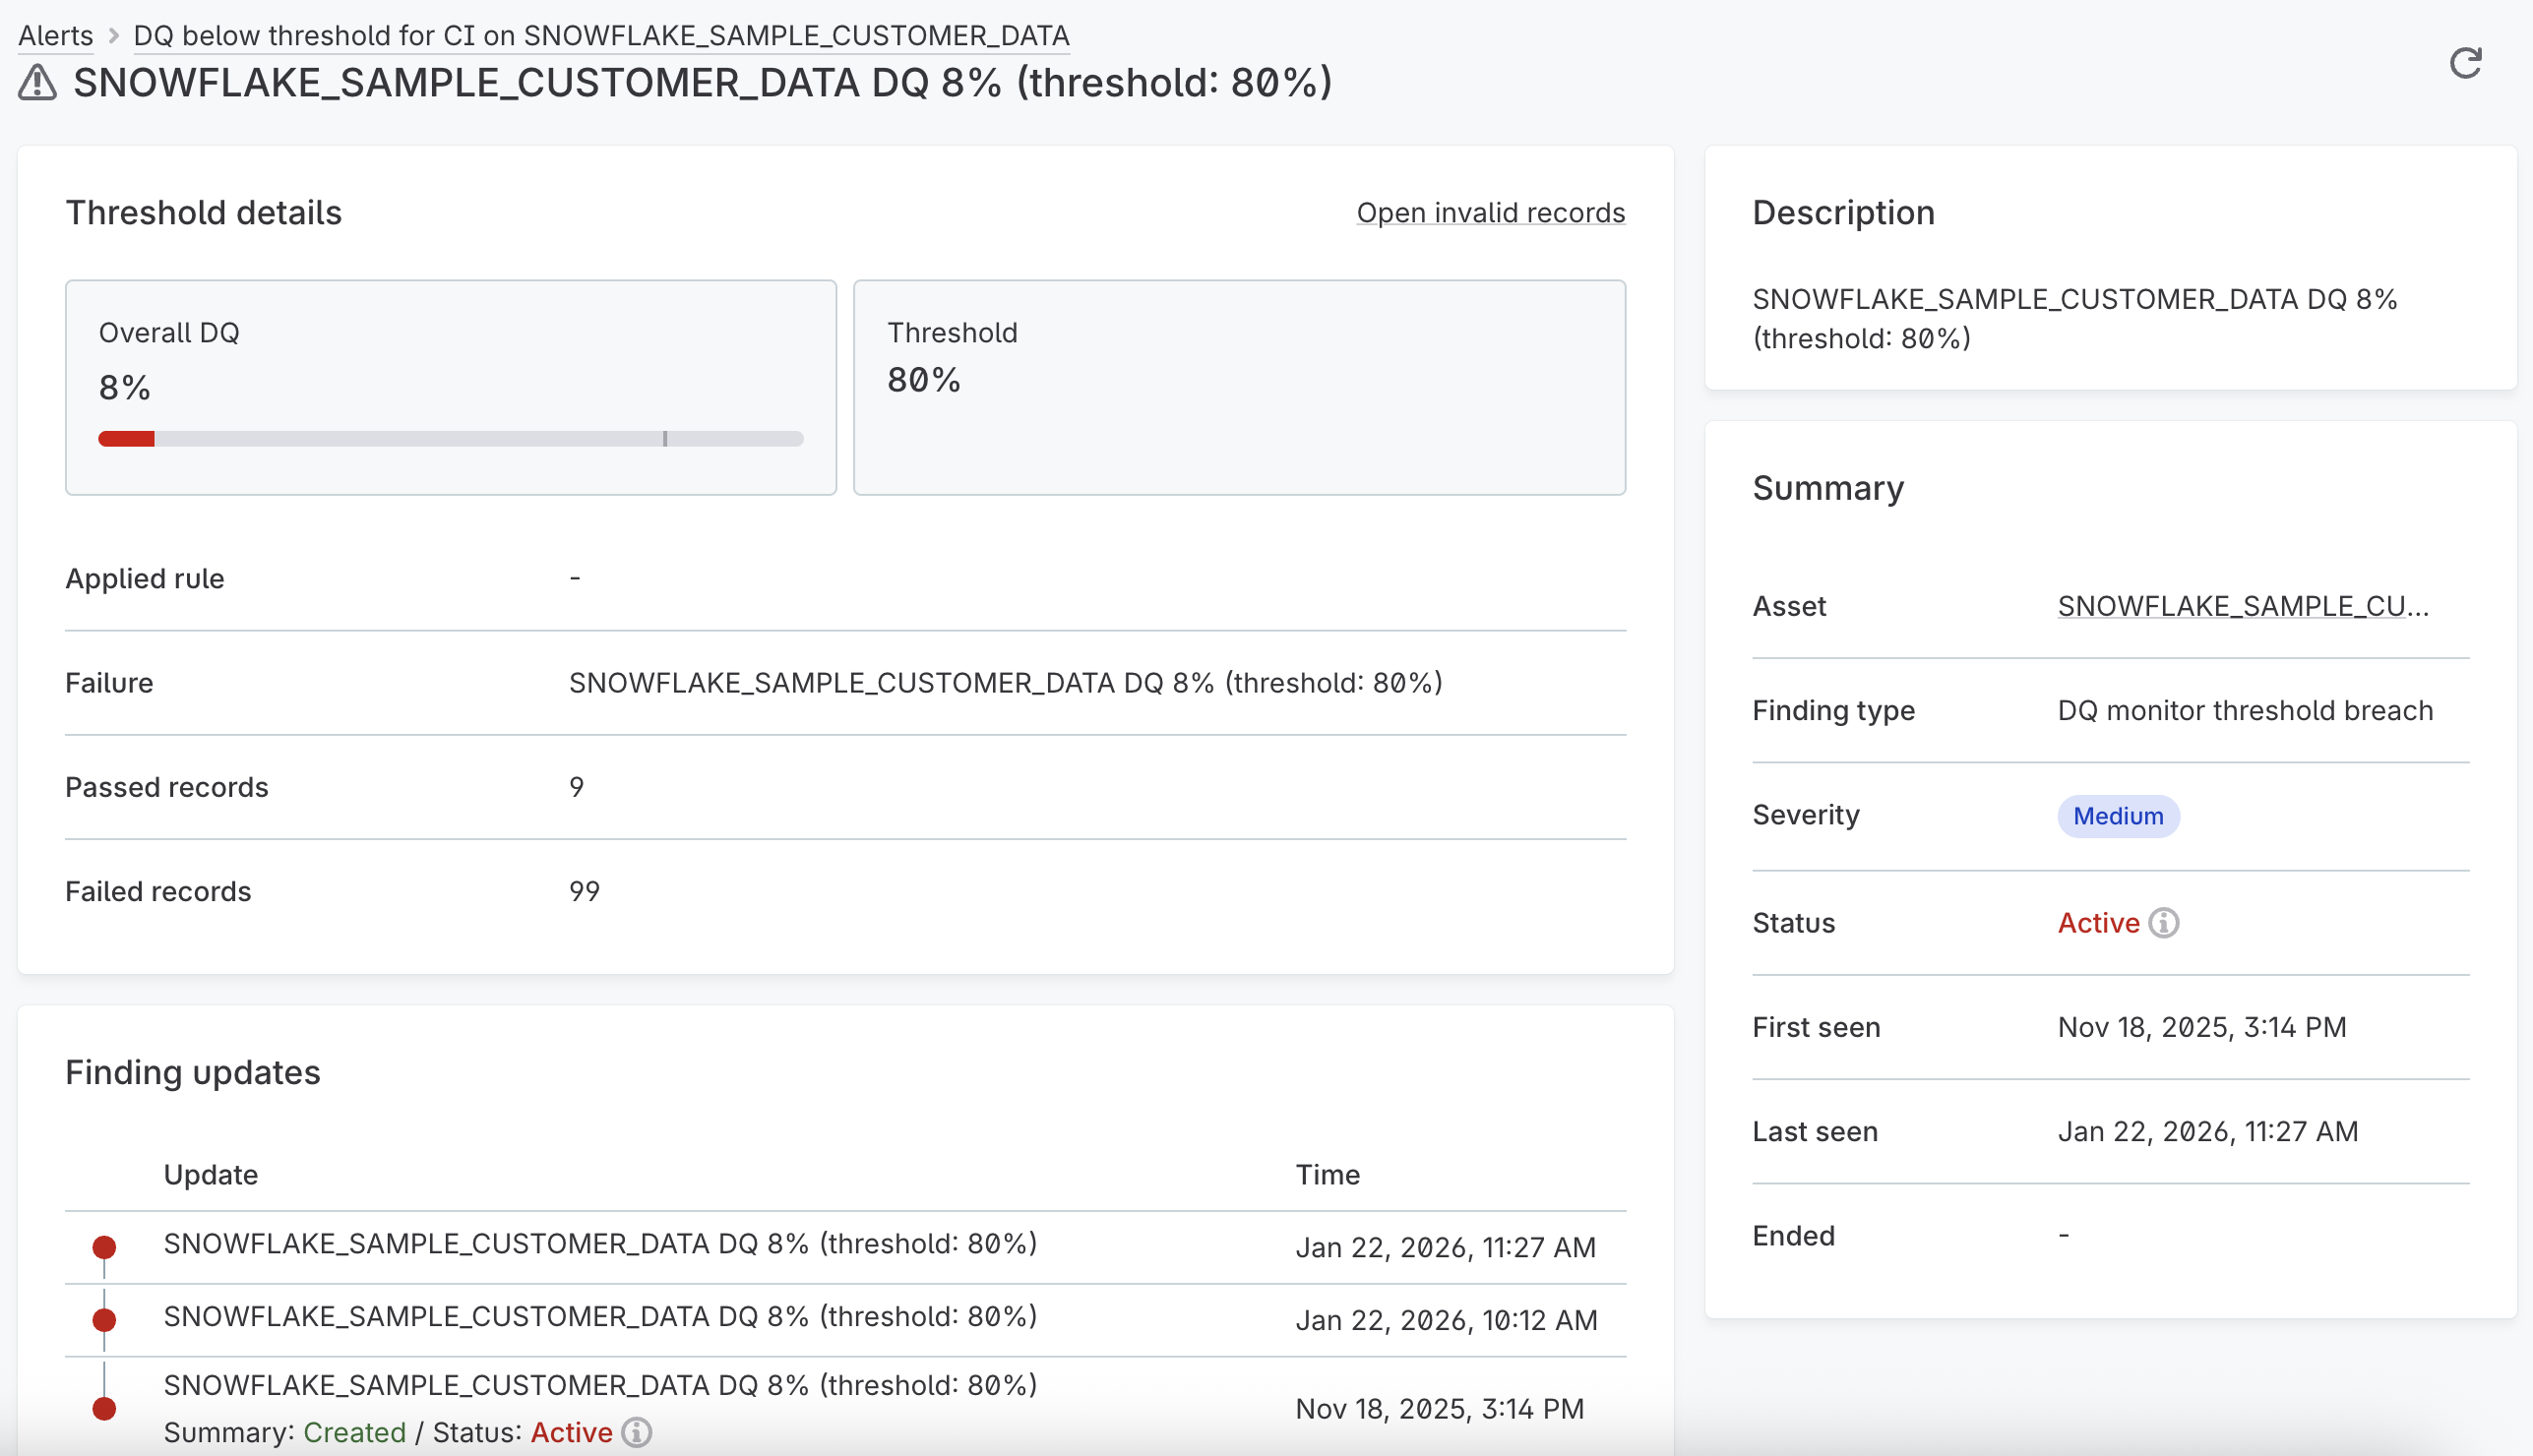
Individual findings can have different severity levels. The alert’s overall severity reflects the highest severity among its findings.
- Activity
-
A chronological log of changes to the alert, including when the alert was created, resolution updates, and who made changes. The activity log also displays time-to-resolution metrics when applicable.
AI assessment
Generate an AI assessment to get a quick summary of what happened, how the issue developed, and what it might mean for your data.
Select Generate in the AI assessment section. image::investigate-alerts-ai-assessment.png[AI assessment section showing a generated assessment with sections for what happened, how it evolved, and downstream assets]
Once generated, the assessment can include:
-
What happened: What triggered the alert.
-
How it evolved or Timeline: How the issue developed over time.
-
Where in the pipeline: The job or step where the issue originated.
-
Downstream assets: Assets that might be affected.
-
What this means: The potential business impact.
If findings have changed since the assessment was generated, the indicator shows Out of date. Select Re-generate to bring it up to date.
Use the thumbs up or thumbs down to let us know how useful the assessment was.
Pipeline view
For alerts related to pipeline jobs, the Pipeline view tab displays a visual representation of the affected assets and their relationships. This view helps you understand the context and potential downstream impact of an issue.
The canvas shows:
-
Asset nodes with alert indicators for affected items
-
Finding count badges showing how many findings are associated with each asset
Use the controls in the lower-right corner to zoom, fit the view to the screen, or lock the canvas.
Alert status lifecycle
Alerts have three possible statuses that reflect the current state of their underlying findings:
| Status | Meaning |
|---|---|
Active |
One or more findings in this alert are still active. The conditions that triggered the alert are ongoing. |
Inactive |
All findings in this alert are inactive. The conditions that created the findings are no longer present, and the alert has ended. |
Stale |
This alert includes one or more stale findings based on outdated data that cannot be verified. |
| At the finding level, Active means recent updates still support the finding, Inactive means the conditions are no longer present, and Stale means the finding is based on outdated data. |
Finding types
Alerts can be triggered by various types of findings across your data pipelines and assets:
- Pipeline job findings
-
-
Pipeline job updated
-
Pipeline job failed
-
Pipeline job aborted
-
- Data quality findings
-
-
DQ monitor below threshold
-
Rule instance below threshold
-
- Data anomalies
-
-
Attribute anomaly
-
Number of records anomaly
-
- Schema changes
-
-
Asset-level schema change
-
Attribute-level schema change
-
Resolve alerts
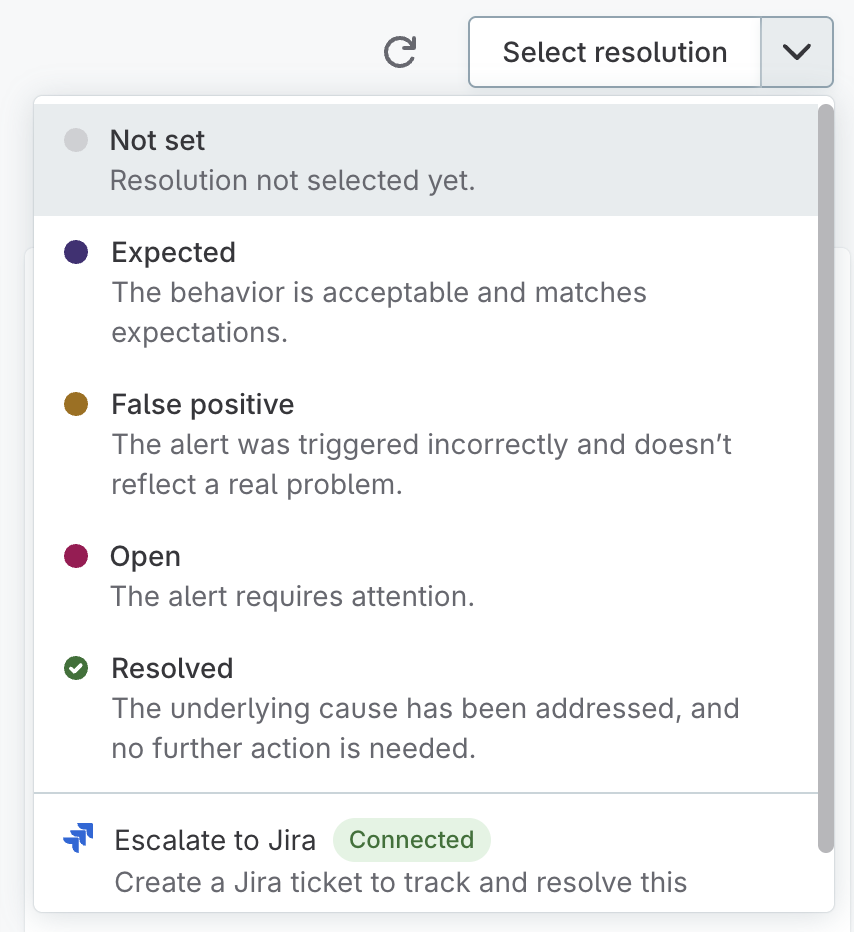
Use the Select resolution dropdown in the upper-right corner of the alert detail page to set a resolution or escalate the alert to Jira.
| Resolution | When to use |
|---|---|
Not set |
Resolution has not been decided yet. |
Expected |
The behavior is acceptable and aligns with expectations. |
False positive |
The alert was triggered incorrectly and doesn’t reflect a real problem. |
Open |
The alert requires attention. |
Resolved |
The underlying cause has been addressed, and no further action is needed. |
Resolution is separate from status. An alert can be Active (the issue is ongoing) while having a resolution of Open (acknowledged and being worked on).
Escalate alerts
For alerts that require tracking in an external system, you can escalate them to Jira to create a ticket. See Escalate Alerts for instructions. Once you escalate an alert, the ticket reference appears in the upper-right corner of the alert page with an Escalated badge and a link to the ticket.
Next steps
-
Escalate Alerts — Escalate alerts to Jira for tracking in your issue management workflow.
-
Get Notifications for Alerts — Set up notifications to alert the right people.
Permissions
Access to alerts is controlled through the Data Observability permissions model. For details, see Manage Alert Permissions.
Was this page useful?