
Data Quality Monitoring and Observability
Ataccama ONE provides integrated capabilities for monitoring the quality of your data and the health of your data pipelines. By combining data quality evaluation, pipeline monitoring, and a unified alerting system, you can detect issues early, investigate root causes, and ensure reliable data for downstream consumption.
Why monitor data quality and pipelines
Data quality issues and pipeline failures can go undetected until they affect downstream systems — broken dashboards, incorrect reports, or failed integrations. Continuous monitoring provides early detection and a clear path to resolution.
With data quality and pipeline monitoring, you can:
-
Detect issues when they occur — failed pipeline jobs, DQ rule violations, anomalies in data profiles — rather than when downstream consumers report problems.
-
Identify root causes by correlating data quality drops with pipeline failures or source system changes.
-
Track resolution through a unified alerting system that records when issues were detected, who was notified, and how they were resolved.
-
Measure quality over time to establish baselines and identify trends.
What you can monitor
Ataccama ONE monitors your data ecosystem across two dimensions:
- Data quality
-
Evaluate data against business rules, detect anomalies in data profiles and record volumes, and identify schema changes. Data quality monitoring answers the question: Is my data accurate, complete, and trustworthy?
- Pipeline health
-
Track the execution of jobs in your orchestration tools (Airflow, dbt, Dagster) and detect failures as they occur. Pipeline monitoring answers the question: Are my data pipelines running successfully?
Both dimensions feed into a unified alerting system that groups related findings, routes notifications to the right people, and helps you track resolution.
Get started
Most teams follow a progression: start by monitoring the quality of your most critical data, then add visibility into the pipelines that produce it, then configure alerts to notify the right people when issues occur.
1. Set up data quality monitoring
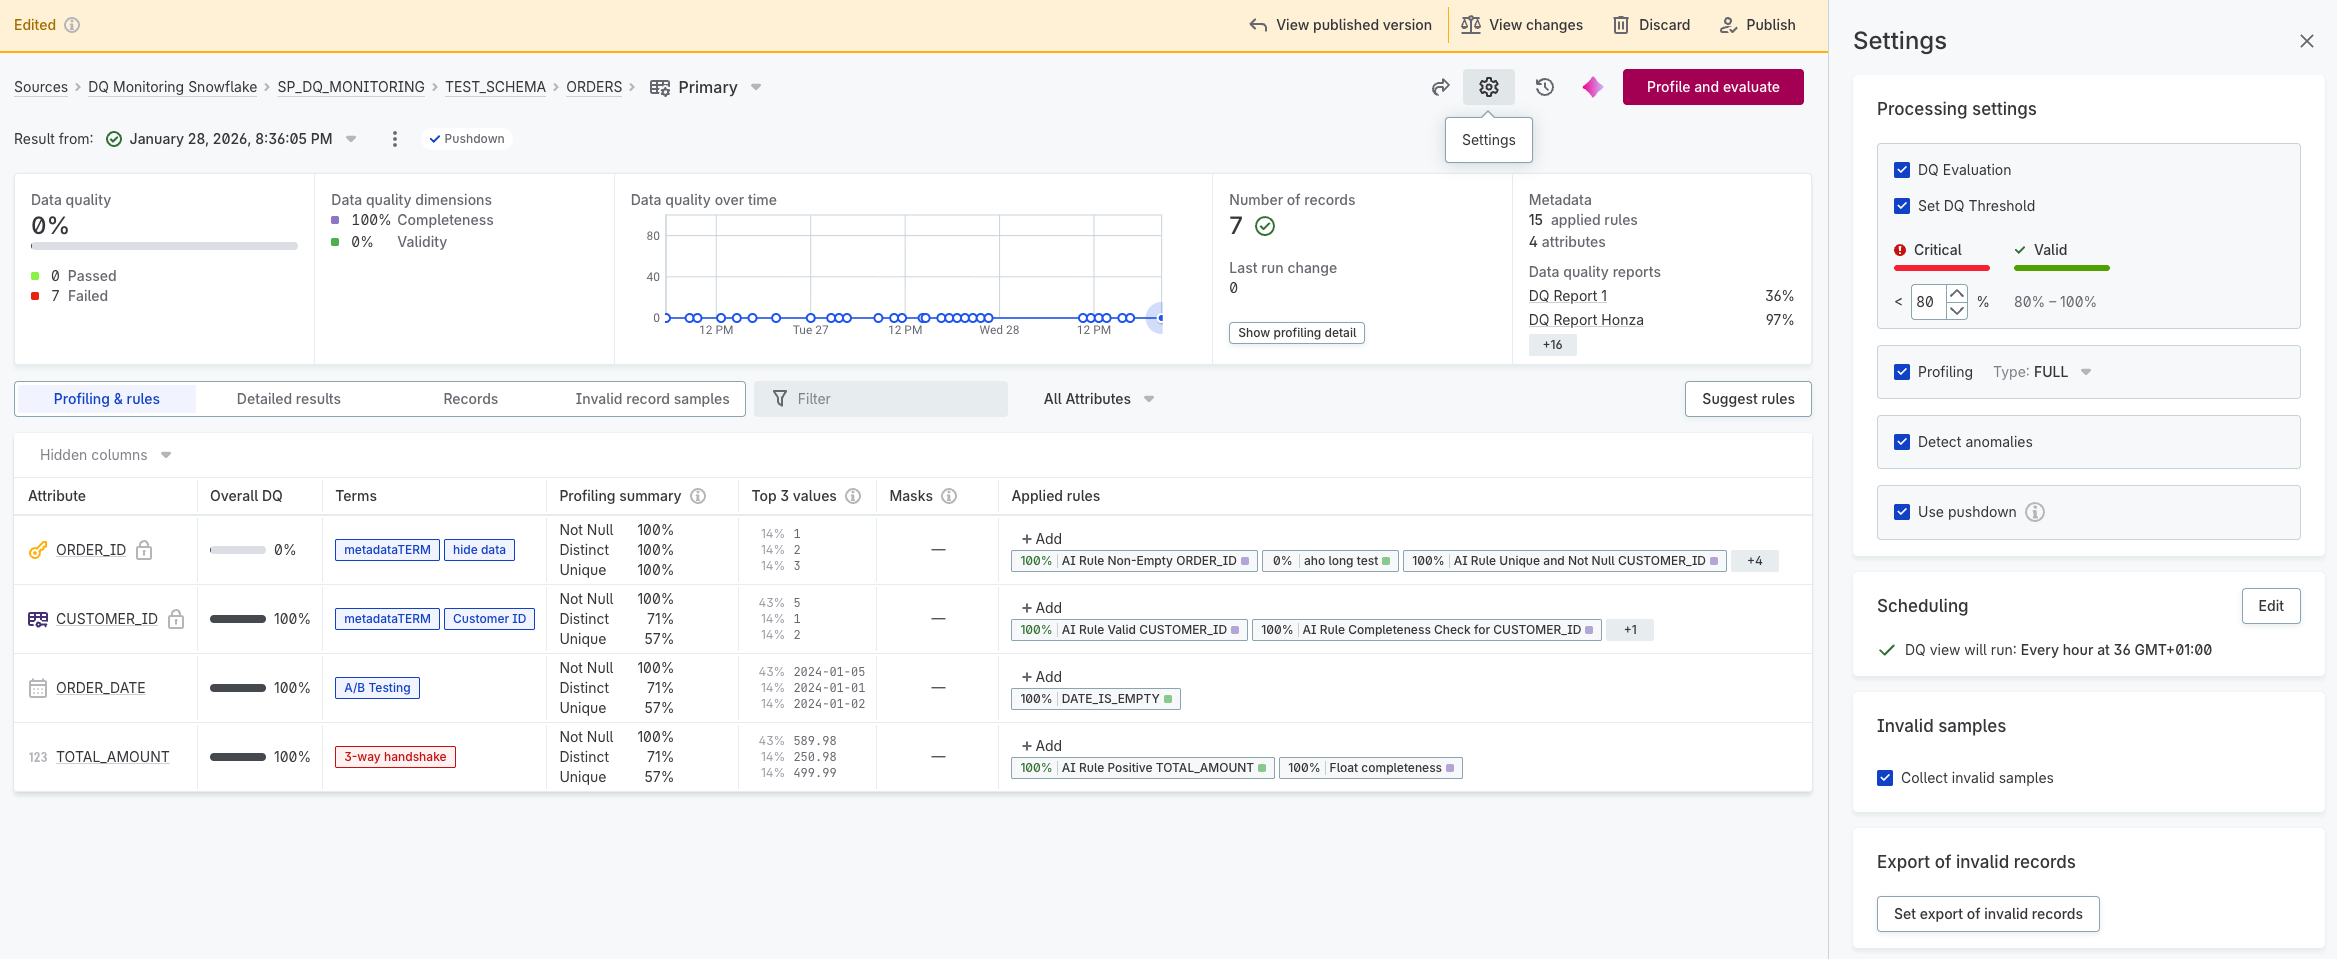
Data quality monitoring in Ataccama ONE is built around DQ monitors — configurable processes that evaluate catalog items against your business rules.
Every catalog item has a primary DQ monitor that you can configure directly from the catalog item’s Overview tab. The primary monitor provides a baseline configuration for profiling and DQ evaluation. You can also create additional monitors for the same catalog item when you need different configurations — for example, different rule sets, schedules, or threshold settings.
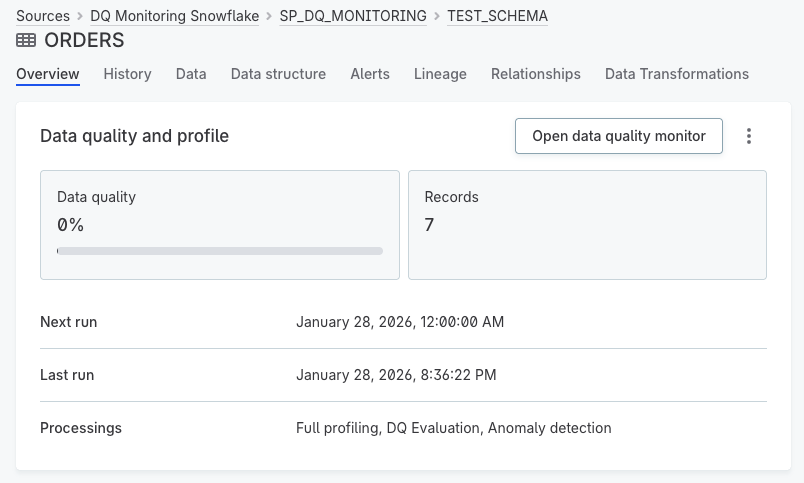
A DQ monitor supports several processes:
- Profiling
-
Analyzes your data’s structure, content, and patterns. Profiling calculates statistics like value distributions, null counts, and frequency patterns — helping you understand what’s in your data before defining rules.
- DQ rules
-
Define what valid data looks like. Rules can check for completeness, validity, accuracy, uniqueness, and timeliness. When you run DQ evaluation, each record is measured against these rules, with results showing pass/fail rates at the record, attribute, and catalog item level.
- Thresholds
-
Define acceptable quality levels. When results fall below a threshold, an alert is triggered.
- Anomaly detection
-
Identifies unexpected changes in data patterns or record volumes. Anomaly detection flags unusual values that might indicate data issues, even when no specific rule has been violated.
For more information, see DQ Monitors.
-
Set up a DQ monitor for your catalog item.
-
Run profiling to understand your data.
-
Create and apply DQ rules to define quality criteria.
-
Run DQ evaluation to measure data against your rules.
To monitor quality across multiple catalog items, use DQ dashboards.
If you need to evaluate data quality in real-time as data flows through your pipelines, use DQ Firewalls. DQ Firewalls apply your DQ rules via API calls, allowing you to filter or route records based on quality results before they enter downstream systems.
2. Connect your pipelines
Pipeline monitoring uses the OpenLineage standard to collect execution metadata from your orchestration tools. If your data flows through Airflow, dbt, or Dagster, you can connect them to Ataccama ONE to track job executions.
The setup process:
-
Create an orchestrator connection in Ataccama ONE and generate an API key.
-
Configure your orchestrator to send OpenLineage events to the connection endpoint.
-
Verify events are flowing — job executions will appear in the Pipeline monitoring module.
Once connected, you can see which jobs are running, completed, or failed — and correlate data quality issues with upstream pipeline failures.
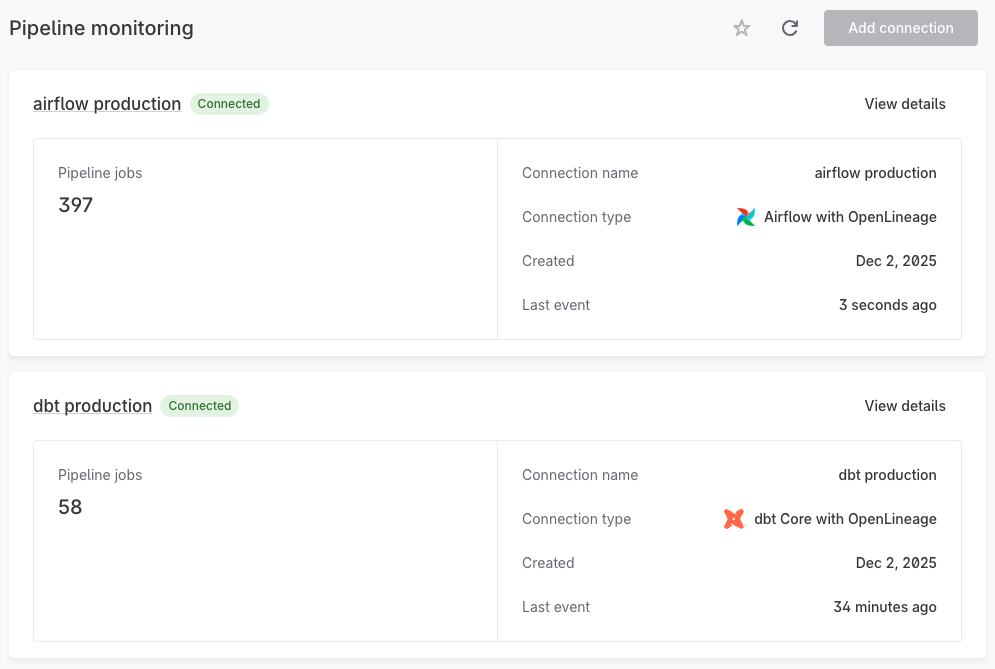
For more information, see Pipeline Monitoring.
-
Create an orchestrator connection and generate an API key.
-
Configure your orchestrator to send OpenLineage events: Apache Airflow, dbt Core, or Dagster.
-
Monitor job executions in the Pipeline monitoring module.
3. Configure alerts and notifications
The Alerts system provides a single view of issues detected across both data quality and pipeline monitoring. Findings appear in the alerts feed as they are detected, grouped to reduce noise and help you focus on root causes.
Alerts are triggered by findings from different sources:
| Category | Finding types | Source |
|---|---|---|
Pipeline job findings |
|
Pipeline monitoring |
Data quality findings |
|
DQ evaluation |
Data anomalies |
|
Profiling and anomaly detection |
Schema changes |
|
Profiling |
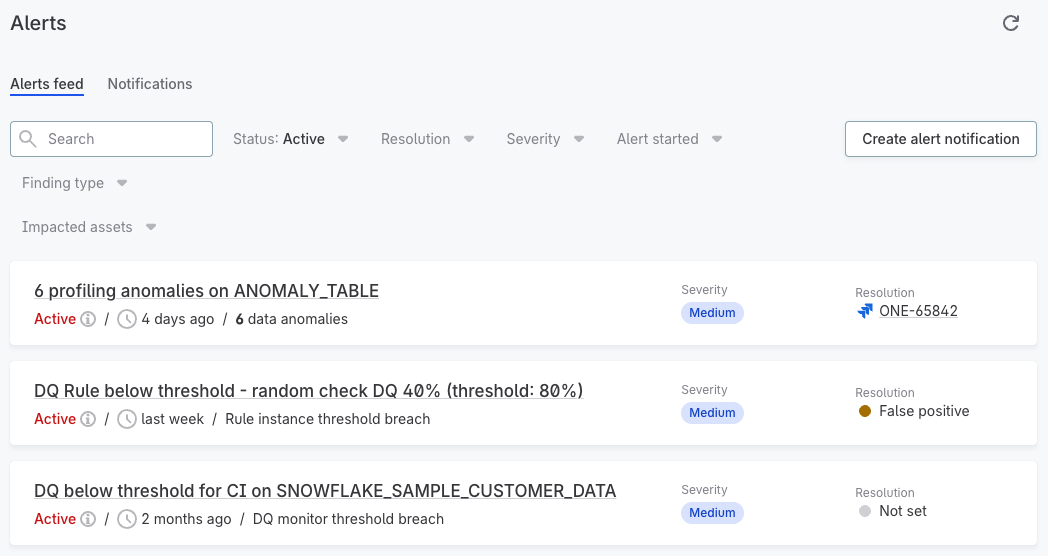
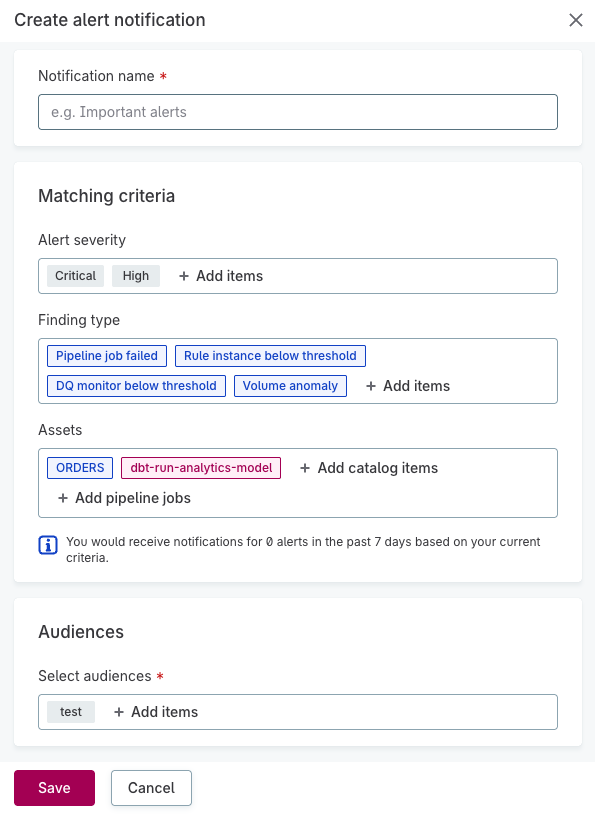
To receive notifications, configure notification policies that define which alerts trigger notifications and who receives them. Start simple: create one notification policy that sends all critical findings to a shared team channel, then refine as you learn which alerts are most valuable.
-
Review the alerts feed to understand what findings are being detected.
-
Create audiences to define who should receive notifications.
-
Create notification policies to route alerts to the right people.
Was this page useful?