
Filter Visualization Data
Filters defined for a visualization apply only to that specific visualization. To define global filters that apply to all visualizations in a dashboard or story, see Create a Dashboard and Create a Story.
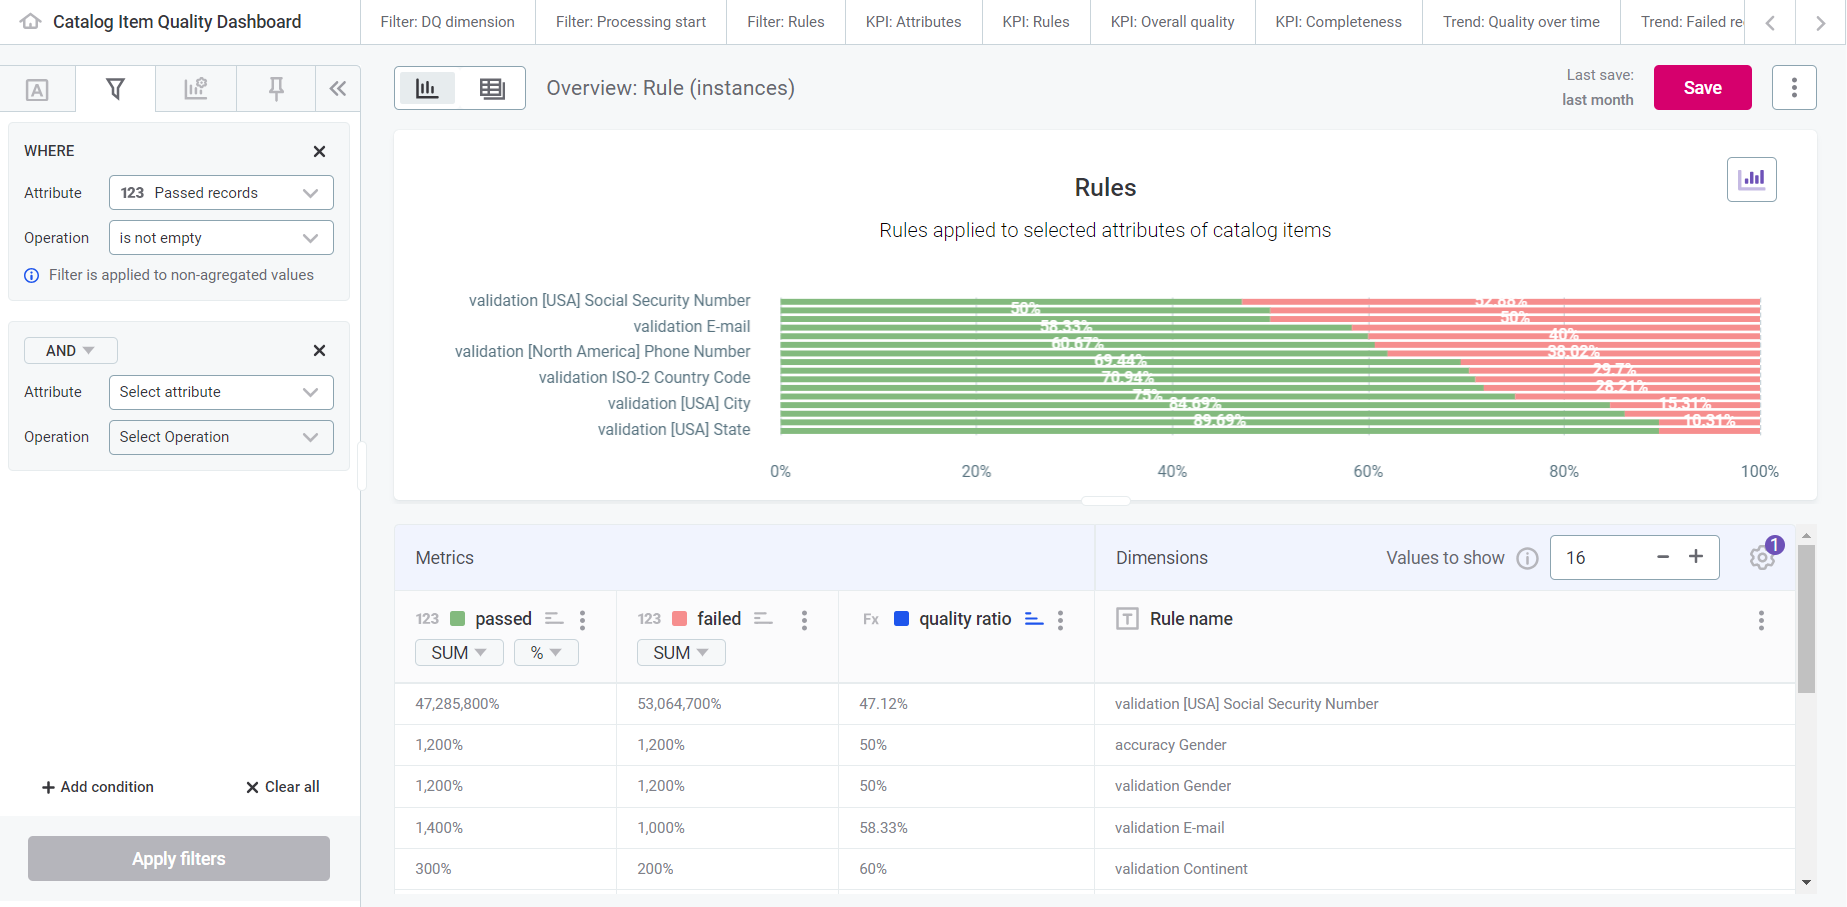
Add filters
| ONE Reports leverages data protection classification that prevents unauthorized access to protected data, as signaled by visual indicators (lock icons) and notifications. For more information, see Data Protection in ONE Reports. |
-
Open your visualization.
-
Go to the Filters tab.
You can also filter directly by opening the three dots menu for a specific value in the Dimensions column and selecting Add to filter. This adds the attribute value using the equal to operation. -
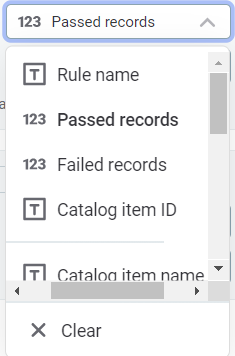
In Attribute, choose an attribute from the list. Recommended attributes (dimensions and metrics used in your chart) are displayed first.
Specify the operation
In Operation, select an operation based on the data type of the chosen attribute.
-
Numeric
-
Text
-
Date
-
>: Greater than the value entered.
-
<: Less than the value entered.
-
>=: Greater than or equal to the value entered.
-
⇐: Less than or equal to the value entered.
-
=: Equal to the value entered.
-
≠: Not equal to the value entered.
-
is empty: Cells with NULL values.
-
is not empty: Cells without NULL values.
-
in range: Within the specified range.
-
not in range: Outside the specified range.
-
equal to: Matches the value entered.
-
not equal to: Does not match the value entered.
-
contains: Matches the text specified (case-sensitive).
-
does not contain: Does not match the text specified.
-
is empty: Cells with NULL values.
-
is not empty: Cells without NULL values.
-
equal to: Matches the date entered.
-
not equal to: Does not match the date entered.
-
in range: Within the selected date range.
-
not in range: Outside the selected date range.
-
before: Before the chosen date.
-
after: After the chosen date.
-
is empty: Cells with NULL values.
-
is not empty: Cells without NULL values.
-
in last: Within the last N days, weeks, quarters, months, or years.
-
in current: Within the current day, week, month, or year.
Enter values
The input fields vary depending on the attribute type and operation.
Numeric attributes
-
Simple comparisons (
>,<,>=,⇐,=,≠): Enter a numerical value. Use the plus and minus icons to adjust the value. -
No data (
is empty,is not empty): No additional input required. -
Range (
in range,not in range): Enter the lower and upper limits.
Text attributes
-
No data (
is empty,is not empty): No additional input required. -
Text entry: Select Add items to specify text values. The search is case-sensitive.
By default, search looks only in recommended results. Select Search in all column values to broaden the search. -
Wildcard search (
contains,does not contain): Use%before or after text. For example,%smatches values ending with "s", ands%matches values starting with "s".
Date attributes
-
Specific date (
equal to,not equal to,before,after): Select a date from the calendar. -
No data (
is empty,is not empty): No additional input required. -
Date range (
in range,not in range): Enter start and end dates. -
Relative date (
in last): Enter a number and select the period type (days, weeks, quarters, months, years). -
Current period (
in current): Select the period type (day, week, month, year).
Manage filters
-
Select Apply filters to update the visualization.
-
Select Add condition to add more filters.
-
When using multiple conditions, choose
AND(both must be met) orOR(either must be met). -
Select Clear all to remove all filters.
For individual filters:
-
Select the condition to modify it.
-
Select the trash icon to remove it.
Was this page useful?