
DQ Monitors
DQ monitors control how DQ evaluation and profiling operate for catalog items, and display their processing progress and results. They determine which rules are applied, how processing runs and when it executes.
Each catalog item can have one or multiple DQ monitors to support different use cases, such as testing different rule combinations or running evaluations at different frequencies.
Where to find DQ monitors
To see all configured monitors:
-
Go to Data quality > Monitors in the left navigation menu.
-
Select a monitor to open it.
| Use search to find monitors by name. |
To find monitors for a specific catalog item:
-
Open the catalog item Overview tab.
-
Select Open DQ monitor in the Data quality and profile widget.
If there are multiple monitors, see them in the Additional DQ monitors widget.
What the data quality monitor shows
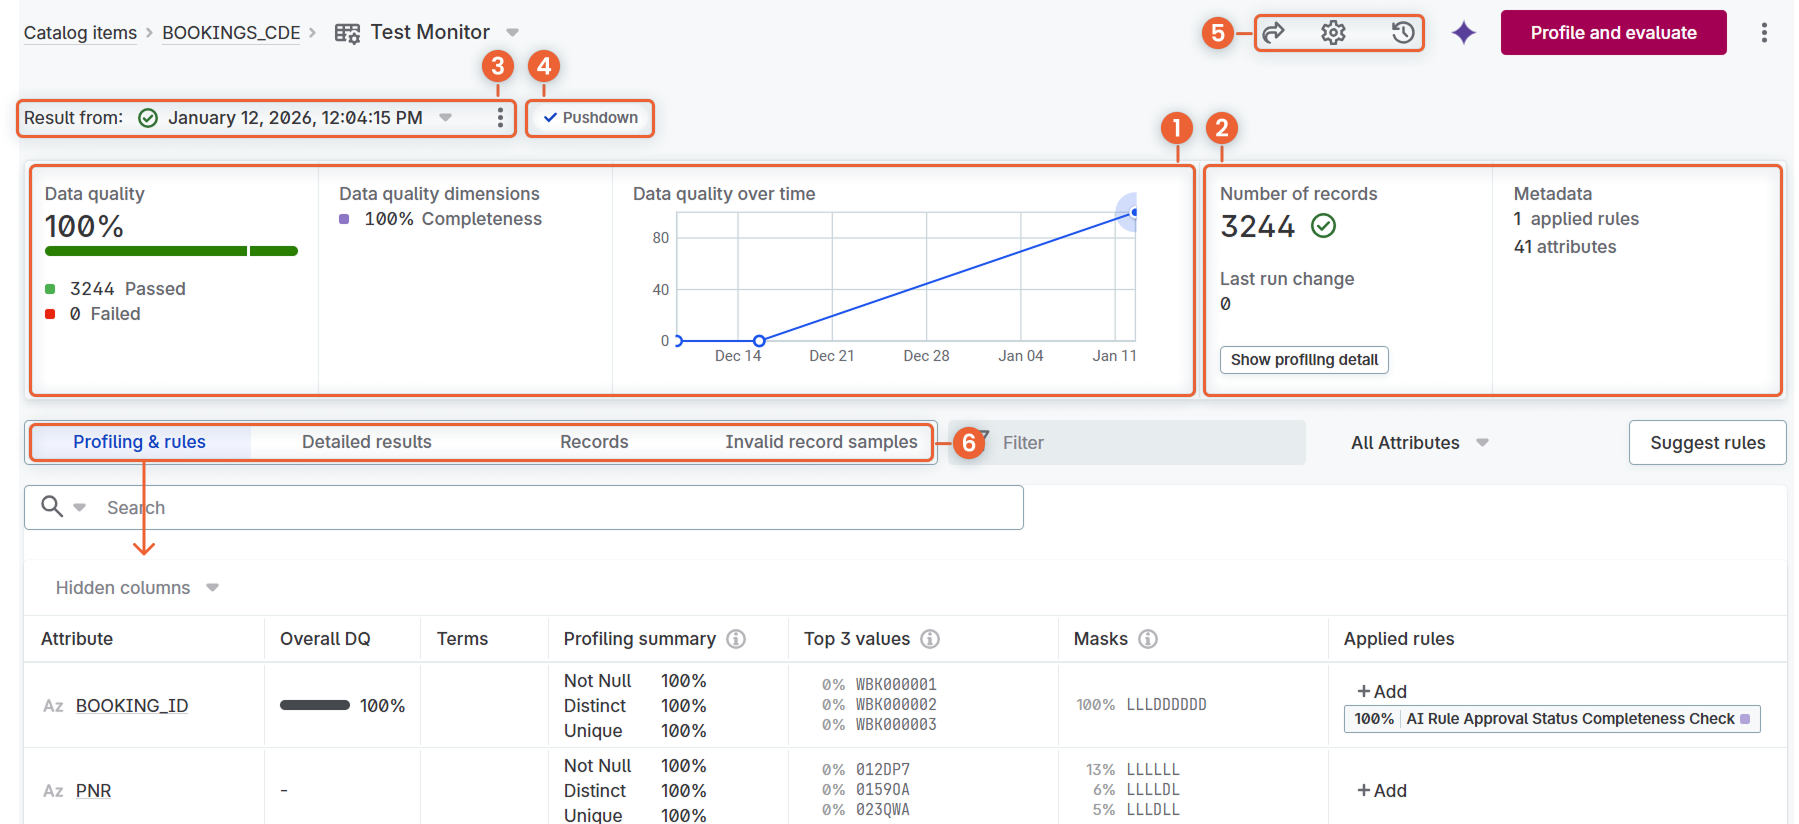
These actions apply to the whole monitor:
-
Profile and evaluate: Run the monitor now.
-
Configure monitor: Open the monitor settings.
-
Share, History, and the AI agent: Share the monitor with others, view or restore previous versions, and ask the AI agent about this catalog item.
When a catalog item has more than one monitor, the monitor selector shows which one you are looking at. See Set up multiple DQ monitors.
The monitor summarizes its latest run and the catalog item:
-
Data quality: The overall score, how many records passed and failed, and the trend over time. Select the timestamp beside the card name to see the results of an earlier run, or the three-dot menu to delete a run. Within the card, DQ dimensions breaks the same score down by dimension, and Anomaly detection shows whether any metric fell outside its learned range.
-
Freshness: Whether data arrives on time, measured against the SLA set on the catalog item. This card appears only once freshness monitoring is set up. See Freshness Monitoring.
-
Metadata: How many rules are applied, how many attributes and records the catalog item has, and which Data Quality Dashboards include this monitor.
Open any card to see its full history.
The results are broken down four ways:
-
Rules: One row per applied rule, with its score, the attribute it runs on, and how many records passed and failed.
-
Attributes: The same results grouped by attribute, with each attribute’s rules nested underneath. Select an attribute to open a sidebar, with its Profiling and Data Quality results on separate tabs.
-
Terms: The same results grouped by business term.
-
Records: The catalog item’s data, where you can also filter to the records that failed. When the catalog item’s connection uses the Strict (no data leaves Edge) compliance mode, this tab is grayed out. See Invalid records.
You can filter the rules, attributes, and terms by Dimension, or show only critical data elements.
Configure DQ monitor
Select Configure monitor in the monitor header to open Monitor Settings.
Some of these settings are available only under certain conditions:
-
Anomalies reports on runs that profile the full table, so it works alongside full Profiling.
-
Freshness becomes available here once freshness monitoring is enabled on the source.
-
Slice is available only on catalog items from supported connections.
Invalid records controls what happens to failing records after evaluation: keeping a sample in the platform, or exporting the full set.
Changes take effect only once you publish them. While a monitor has unpublished changes, you can compare them with the published version, discard them, or publish.
Apply DQ rules
Rules are applied per monitor, so applying one here does not affect other monitors on the same catalog item.
Select Apply rules on the Rules, Attributes, or Terms tab, or go straight to Configure monitor > Data quality. There are three ways to add a rule:
-
Add rule under an attribute opens the rule library, filtered to rules whose input type matches the attribute. Select Apply beside the rule you want. Rules already on that attribute are marked Applied.
Select Create rule to make a new rule without leaving the picker.
-
Suggest rules opens the AI agent with a prompt that finds or creates rules relevant to this catalog item.
-
Create a new rule builds a rule from scratch without leaving the monitor. See DQ Rules.
Some rules must be set up for the attribute before they can run, for example rules that take parameters or read more than one attribute. Those show Configure instead of Apply.
To validate data across two tables in this monitor, for example to check that values are consistent between the catalog item and a related table in another system, use a cross-table rule. See Cross-Table Rules.
Configure a rule before applying it
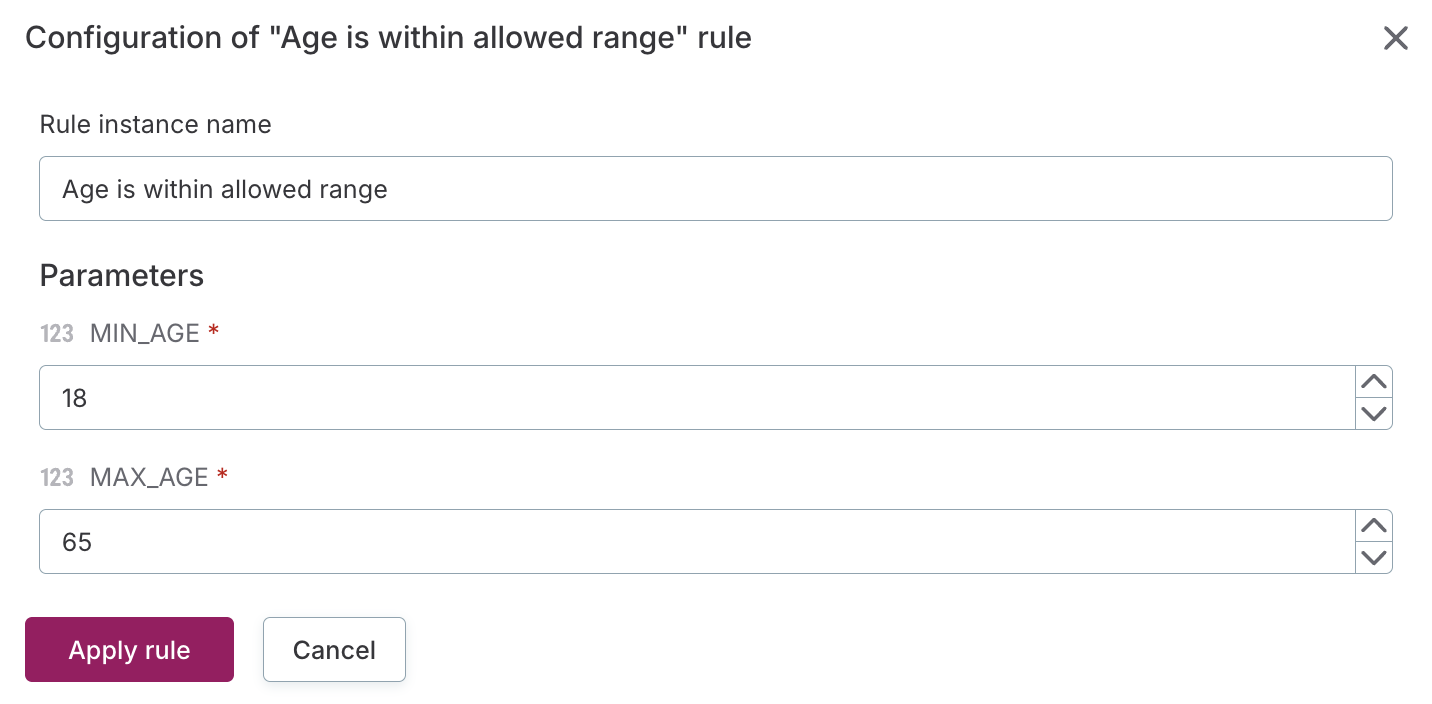
Selecting Configure opens a dialog whose contents depend on what the rule needs.
Applying a rule creates a rule instance: the rule itself stays generic in the library, and the instance is that rule bound to specific attributes.
Every version of the dialog asks for a Rule instance name, which is how the instance is identified in results.
Fields marked with an asterisk () must be filled in before *Apply rule becomes available.
In addition:
-
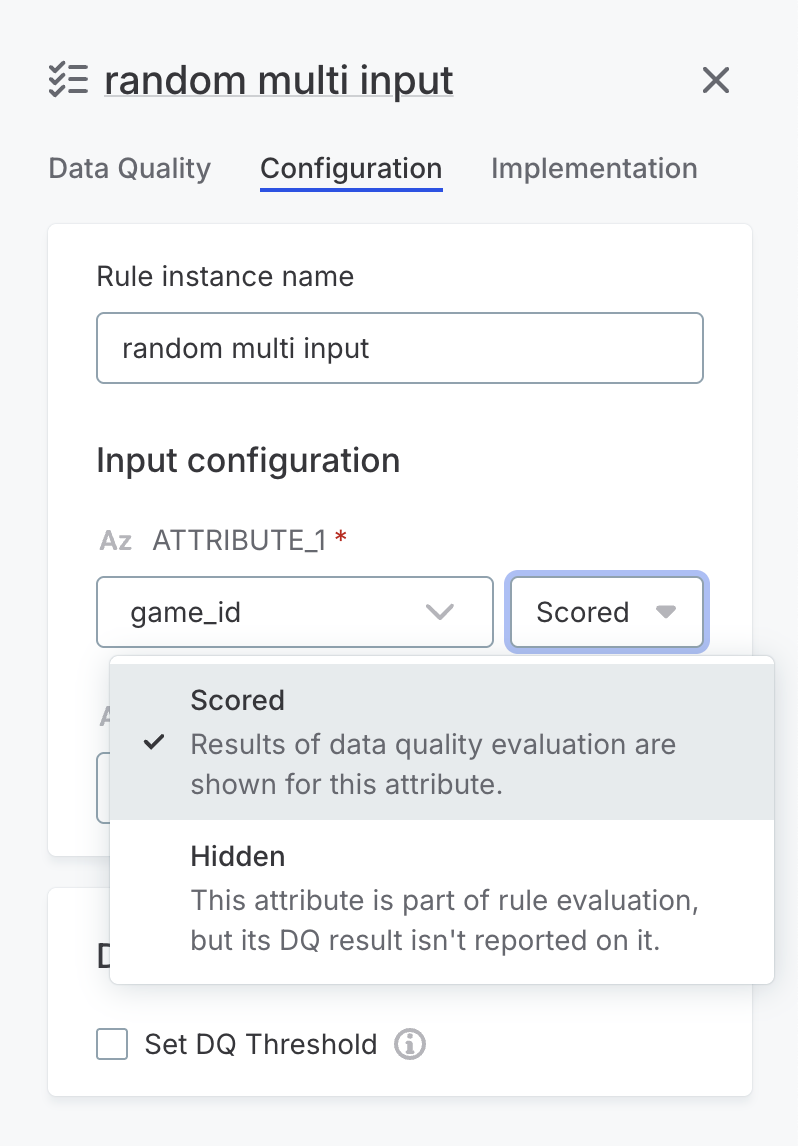
A rule that reads more than one attribute lists each input under Input configuration. Map each to an attribute and set it to Scored or Hidden. Where no attribute of the right type exists, you see No compatible attributes available. See Scored and hidden attributes.
-
A rule with parameters lists each one under Parameters for you to supply a value. See Parameters.
-
A cross-table rule asks for the Primary attribute on this catalog item and the Joined attribute on the related table. See Apply the rule and configure the join.
Edit an applied rule
On the Rules, Attributes, or Terms tab, select a rule to open its sidebar, which has three tabs:
-
Data Quality: The rule’s description and its results on this catalog item, broken down by explanation, with Show Invalid Samples for the failing records.
-
Configuration: The rule instance name, the attribute each input maps to, the Scored or Hidden setting, and the rule’s threshold. Change these here rather than removing and reapplying the rule.
-
Implementation: The rule logic as defined in the rule library.
To stop a rule being evaluated without removing it from the monitor, hover over the rule and select Pause. Paused rules are grayed out and skipped on the next evaluation. Select Pause again to resume.
Publish the changes for them to take effect.
Data quality
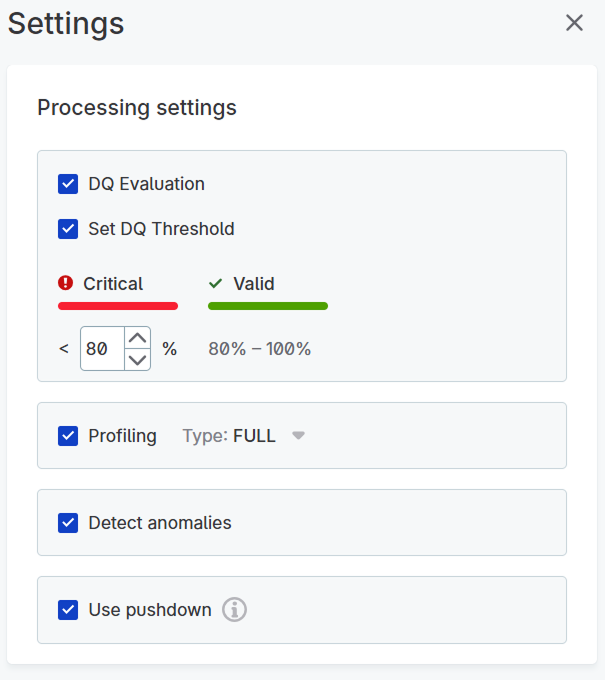
Select Data quality to evaluate the catalog item against the rules applied to it. See Apply DQ rules.
-
Set DQ threshold: Define the acceptable level for your results. Results below this percentage are Critical and trigger alerts automatically. Results at or above it are Valid.
You can also set a threshold on an individual rule, which overrides the monitor’s. See Data Quality Thresholds.
-
Use pushdown: Evaluate data quality in the source instead of in ONE, so only results and invalid samples are sent back. This option appears once pushdown for DQ evaluation is enabled on the connection.
The rules applied to each attribute are listed underneath, with the result of the last run. Depending on the source, the Snowflake pushdown or Databricks pushdown column shows whether each rule can be evaluated in the source.
Rules marked Unsupported are skipped on every run while pushdown is on, and they do not count toward the DQ score. ONE warns you which rules these are before you turn pushdown on. To have such a rule evaluated, either rewrite it so the source can run it, or turn pushdown off for this monitor.
Freshness
Track whether data is being written to this catalog item, and get alerted when it goes stale.
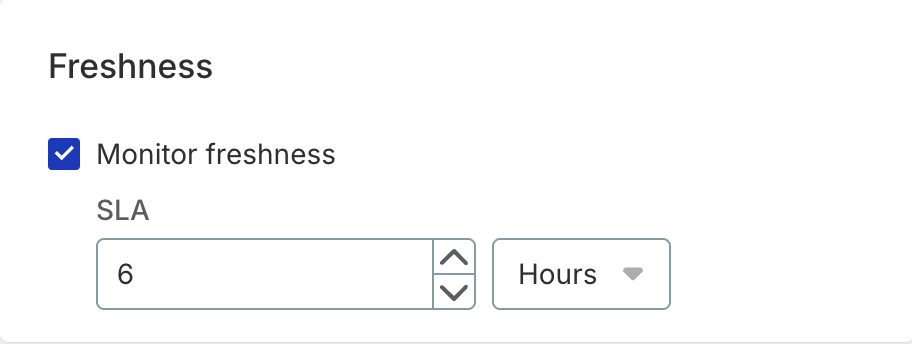
Configure the following:
-
Monitor freshness: Enable freshness monitoring for this catalog item.
-
SLA: Define how recently the data must be updated, as a value in Hours or Days. If the last data write is older than the SLA allows, ONE creates a freshness finding and triggers an alert.
Freshness monitoring only runs once you set an SLA and publish the monitor. Without an SLA, ONE does not check the item, in the same way a monitor without a threshold never triggers an alert.
You can set the freshness SLA on the primary monitor only. Freshness monitoring must also be enabled on the source. Until it is, this section shows Setup incomplete and a Set up freshness monitoring link, which takes you to the source. For the full setup and how freshness is detected, see Freshness Monitoring.
Profiling
Select Profiling to produce the metrics the rest of the monitor builds on, such as value distribution and record counts.
-
Type: Select FULL to analyze all the data, or SAMPLE to analyze a subset. Sampling keeps profiling fast on large tables, but only full profiling supports Anomalies. A monitor with a slice always uses FULL, which reads every row of the slice.
-
Limit number of profiled rows: For sample profiling, set the percentage of rows to profile and the maximum number to read. Rows are selected randomly where the database supports it. Otherwise, reading starts from the first row.
Anomalies
Select Anomaly detection to flag metrics that fall outside the range learned from earlier runs.
Anomaly detection needs earlier runs to learn from, so it is most useful on a monitor that profiles regularly. It reports only on runs that profile the full table, so set Type to FULL under Profiling.
See Anomaly Detection for what anomaly detection covers, the detection models, and how to confirm or dismiss what it finds.
If the catalog item’s connection uses the Strict (no data leaves Edge) compliance mode, Anomaly detection is unavailable and a message explains why. Anomaly detection needs profiling values that can’t leave your edge environment. See Compliance mode.
Slice
Go to Where to look > Slice to control which records the monitor evaluates. By default, the monitor evaluates every record in the catalog item. Select Sliced subset to limit it to the rows that match a condition you build, such as the previous day’s orders or the rows for a single country.
See Data Slices for the supported connections, the operators available, how relative date periods work, and what happens to existing results when you change a slice.
Invalid records
Decide what happens to the records that fail evaluation.
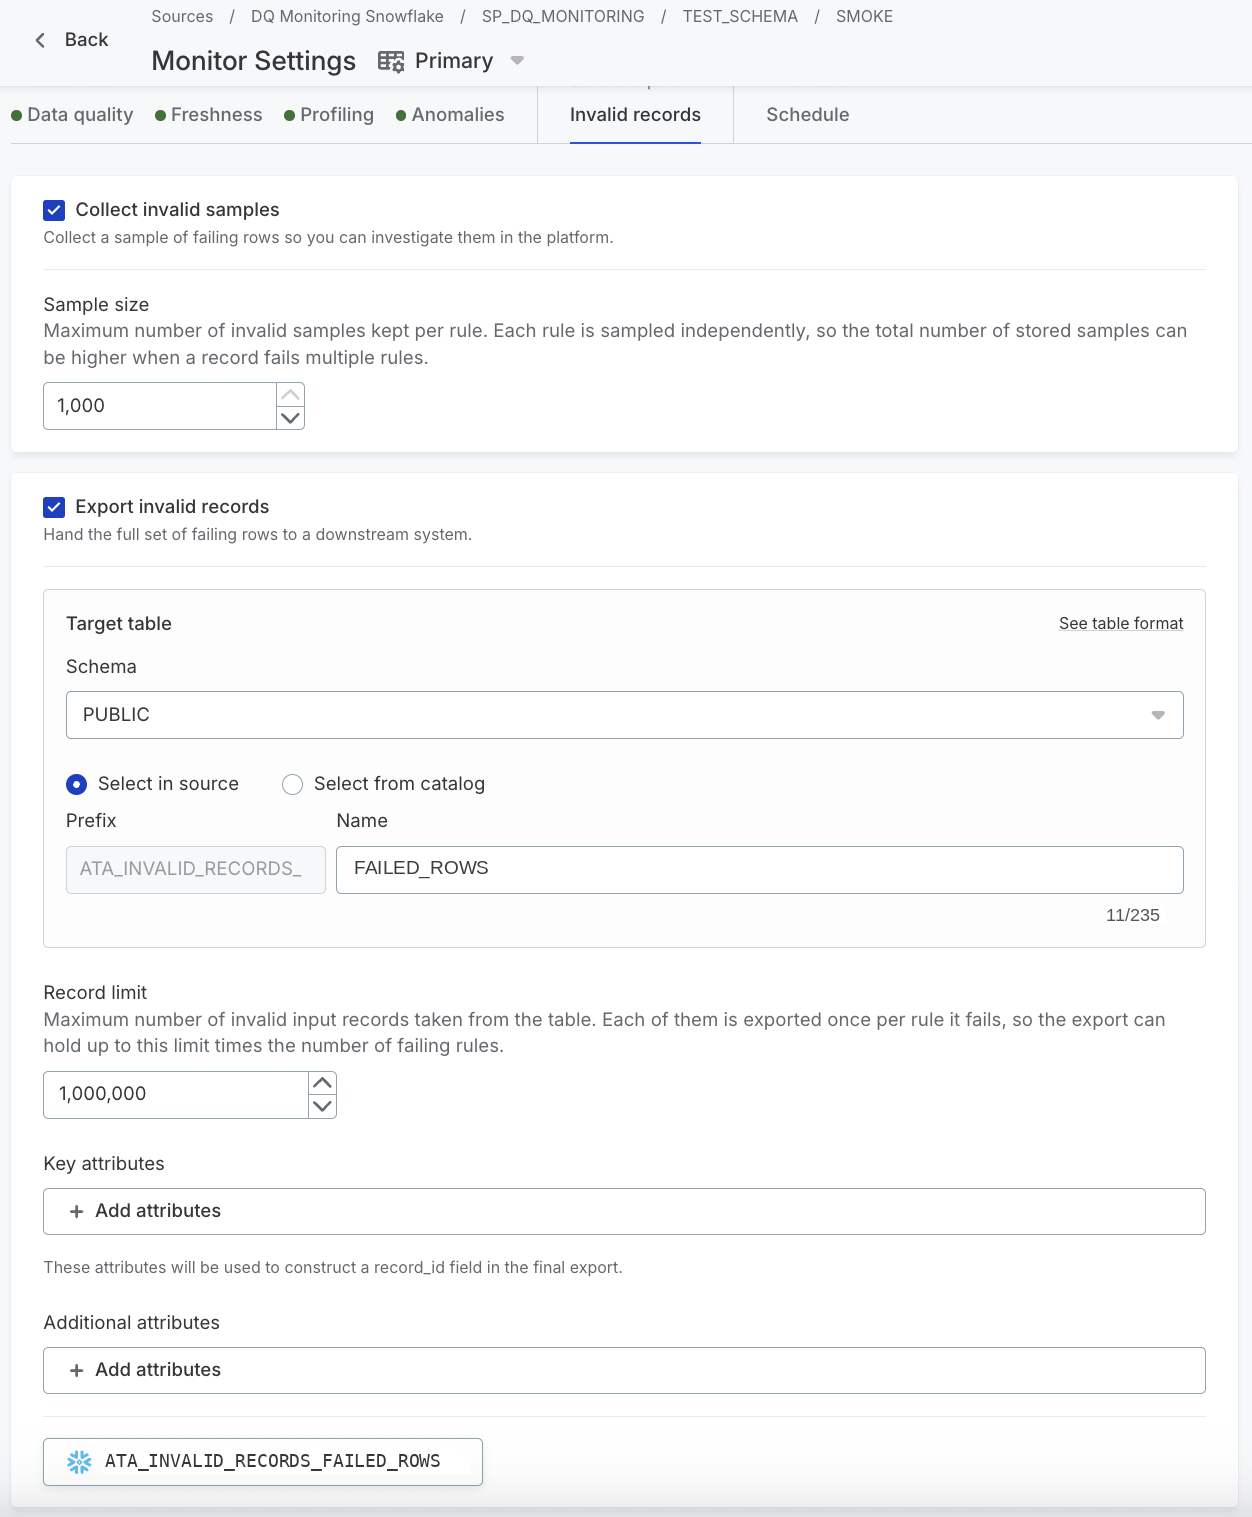
Collect invalid samples
Keep a sample of failing rows so you can investigate them in ONE. Collection must first be enabled globally in DQ retention settings.
Sample size caps how many samples this monitor keeps per rule, 100 by default. Each rule is sampled separately, so the total kept can reach the sample size multiplied by the number of rules.
Samples are collected during evaluation, so if you turn collection on after the monitor has already run, run it again before the samples appear.
Export invalid records
Send the failing rows to a table in your source or catalog, up to the record limit you set, for analysis or remediation elsewhere. See Export Invalid Records for the export settings and the table format.
View the samples and exported records
Once a run finishes, reach the collected samples from the Records tab or from a rule’s sidebar, as described in What the data quality monitor shows and Edit an applied rule. Select All invalid records to reach the exported set: for a Snowflake target this opens the table, and for an S3 target it copies the file’s URI to your clipboard.
If the catalog item’s connection uses the Strict (no data leaves Edge) compliance mode, invalid records aren’t sampled and both Collect invalid samples option and the Records tab are grayed out. Export invalid records still works, because the records are written to your own storage. See Compliance mode.
Schedule
Run data quality, profiling, and anomaly detection automatically. All three read the same data in one pass, so they run together on one schedule.
Regular runs help you catch issues early, and they build the history that Anomalies learns from. When choosing a frequency, consider:
-
Catalog item update frequency: Match the schedule to how often the data changes, so results stay current without wasting resources.
-
Reporting needs: How often you need up-to-date results for reports.
-
Issue resolution: How often you need the data to investigate problems.
To set up a schedule:
-
Select Run on a schedule.
-
In Repeat, select how often the monitor runs: Hourly, Daily, Weekly, Monthly, Yearly, or Cron expression for a pattern the other options cannot express.
-
Set the time and time zone. For a cron expression, enter the expression in place of the time and give the schedule a Label.
-
In Valid from, set when the schedule starts.
-
Optionally, select Queue action for later if the platform is not accessible at the scheduled time.
The schedule takes effect once you publish the monitor.
Set up multiple DQ monitors
Each catalog item has one primary (default) DQ monitor. In addition, you can create multiple secondary DQ monitors to:
-
Test different rule combinations.
-
Schedule different DQ evaluation frequencies for different use cases (for example, run sample profiling for daily monitoring and full profiling for monthly reports).
-
Run different types of profiling.
-
Share the monitor with specific privacy settings.
To create an additional monitor:
-
Open the catalog item.
-
In the Data quality and profile widget, select the three dots menu and then Create monitor.
-
Name the monitor and select Create to confirm.
Delete monitor
It is possible to delete only the secondary monitors.
To delete a DQ monitor:
-
Go to Data quality > Monitors.
-
Select the monitors and Delete.
Alternatively, delete monitors for a specific catalog item:
-
Go to the monitor listing for catalog item in the Additional DQ monitors widget.
-
In the three dots menu, select Delete.
Next steps
After configuring the monitor, you’re ready to start analyzing your data:
-
Run your first analysis: Select Profile and Evaluate (or Profile, Evaluate, depending on your settings) in the monitor header.
-
Review results: Check DQ evaluation results for data quality metrics and profiling results for data structure and content.
-
Investigate issues: If problems are found, see Investigate DQ Issues.
Was this page useful?