
Data Quality Dashboards
Data quality dashboards bring the results of several DQ monitors together in one place. A dashboard shows the aggregated quality of everything it covers, how that quality has moved over time, and a breakdown by monitor and by applied rule.
Use dashboards to group and monitor the catalog items most relevant to your business needs. Typically, these are the catalog items presented in BI reports, compliance reports, or those used for decision-making.
Create a data quality dashboard
To create a dashboard:
-
Go to Data quality > Dashboards.
-
Select Create.
-
On the Catalog Items step, select the catalog items you want to include.
Search needs at least four characters. You can also narrow the list down using filters such as Type, Terms, Data Source, or Criticality. -
For each catalog item you selected, choose the monitor to use in the DQ Monitor column.
-
Select Next.
-
On the General step, enter a Name for the dashboard and, optionally, a Description.
-
Select Create.
-
Publish the dashboard.
The dashboard is then available at Data quality > Dashboards.
Add DQ monitors
You choose the catalog items and their monitors when you create a dashboard. To add more later:
-
Open the dashboard and go to the DQ Monitors tab.
-
Using Select, choose the catalog items you want to add.
-
For each catalog item, choose the monitor to use in the DQ Monitor column, then select Save.
-
Publish your changes.
Run DQ evaluation
A dashboard shows the latest results of DQ evaluation.
For each catalog item in the dashboard, DQ evaluation runs automatically at the times set in the catalog item’s DQ monitor schedule, if one is configured.
You can also run ad hoc DQ evaluation:
-
For all catalog items in the dashboard, select Run in the upper-right corner of the dashboard.
-
For specific catalog items, go to the DQ Monitors tab, select the catalog items you want, then select Run monitor.
-
From the DQ monitor itself, run DQ evaluation.
Wherever you start DQ evaluation, the results are synchronized in the dashboard and on the catalog item.
Read the dashboard
Open a dashboard and go to the Overview tab, or to the Aggregated monitors tab if your organization has both reports (see Choose which dashboard report your organization sees).
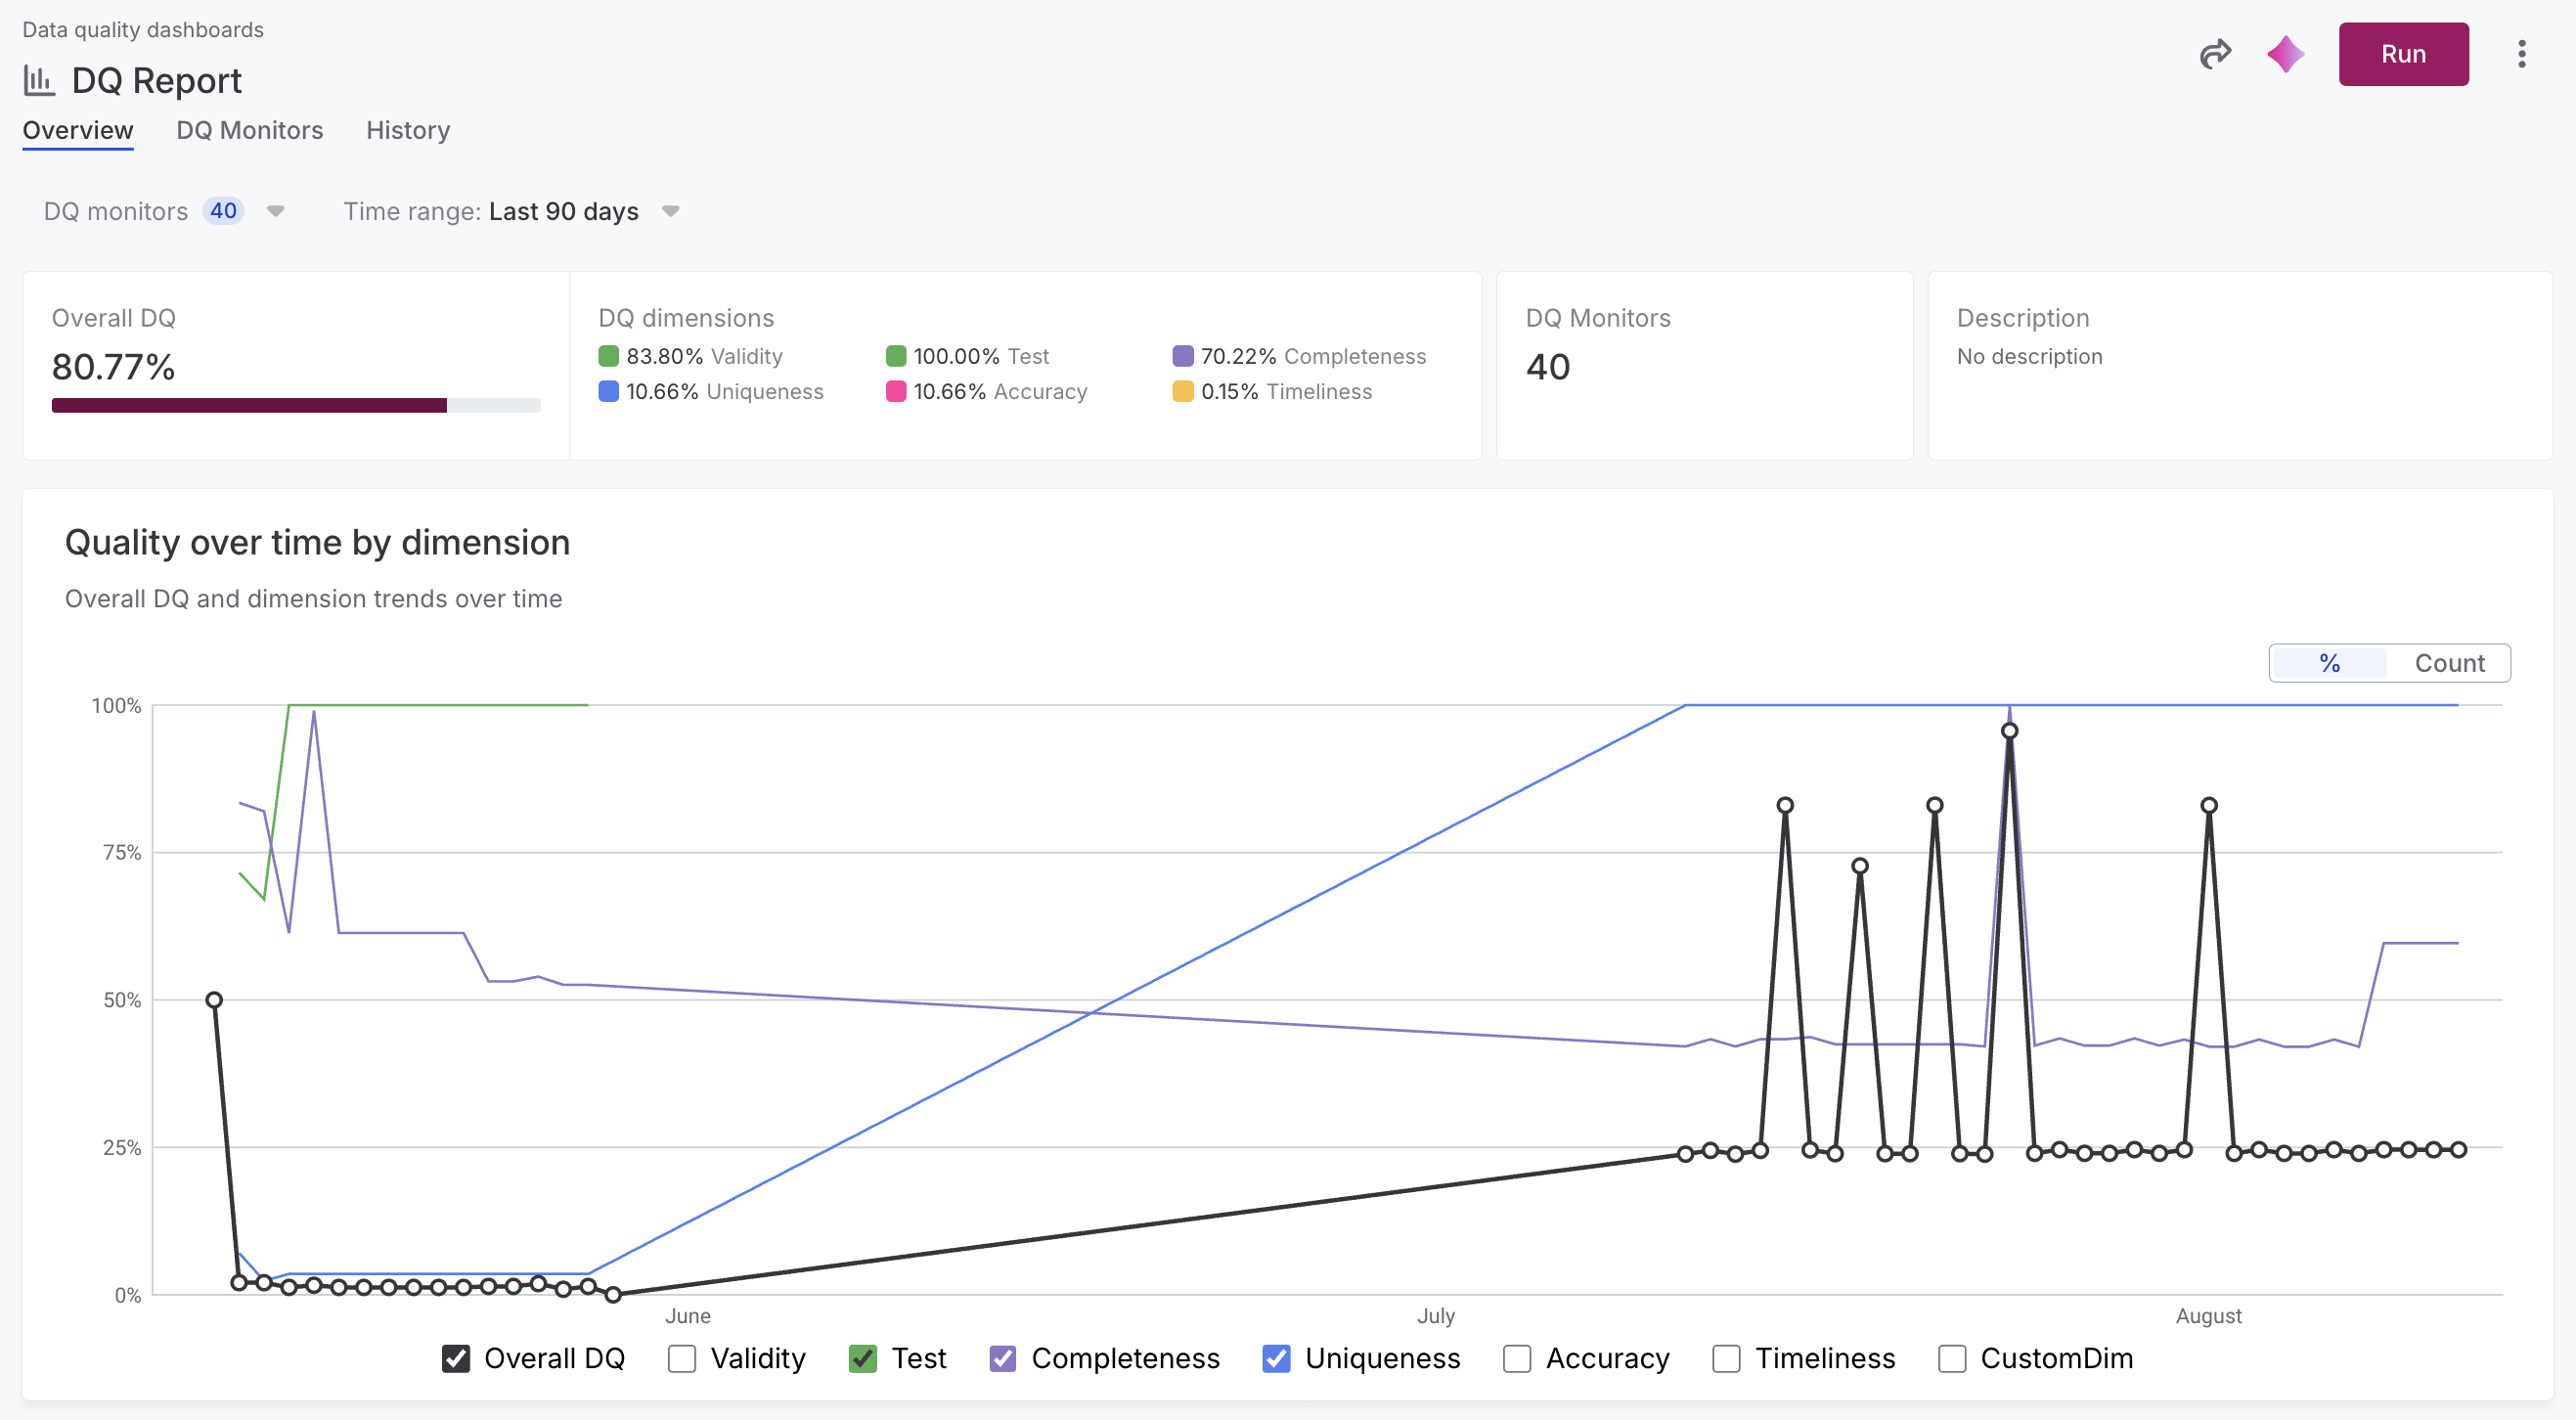
The tab has these parts:
-
Two filters at the top, which control what everything else shows.
-
Summary cards with the current aggregated quality.
-
A chart tracking quality over time.
-
The All DQ Monitors table, with one row per monitor.
-
The Applied rules table, with one row per rule instance.
Filter what the dashboard shows
Two filters sit above the summary cards and apply to everything below them:
-
DQ monitors: Limits the dashboard to the monitors you select. Monitors are listed as
catalog item/monitor, so you can tell apart monitors that share a name. Use the search field to find a specific monitor, or select Select all. -
Time range: Limits results to the period you select. Choose a preset (All time, Last 1 day, Last 7 days, Last 30 days, Last 90 days, Current year, or Last year), or set a custom period using the From and To dates in the calendar. Select Clear filter to remove the time range.
Summary cards
The cards summarize the monitors currently shown:
-
Overall DQ: Aggregated quality across all the monitors in view.
-
DQ dimensions: Quality for each DQ dimension represented in those monitors.
-
DQ Monitors: How many monitors are in view.
-
Description: The description entered when the dashboard was created.
Quality over time by dimension
This chart tracks overall quality and each individual dimension across the selected date range.
To focus on particular lines, clear the checkboxes at the bottom of the chart for the lines you don’t need.
To switch between quality as a percentage and quality as a record count, select % or Count in the upper-right corner of the chart.
The chart plots one point per day, which means that:
-
If DQ evaluation ran several times on a given day, the chart shows the last run of that day.
-
If DQ evaluation didn’t run on a given day, the chart carries forward the result of the most recent run before it.
All DQ Monitors table
This table lists every monitor currently in view, one row each. The columns are:
-
Catalog item: The catalog item the monitor belongs to. Select it to open the catalog item sidebar.
-
Monitor: The name of the DQ monitor. Select it to open the monitor. See DQ Monitors.
-
Overall DQ: Aggregated quality for that monitor, shown as a percentage and a bar.
-
Trend: Whether quality improved or declined since the previous run, and by how much. Filter the table by Improving or Declining to see only the monitors moving in that direction.
-
Evaluated records, Passed records, and Failed records: Record counts from the monitor’s latest run.
Narrow the table down using the Quality ratio, Trend, and Failed records filters above it.
Applied rules table
This table lists the individual rule instances behind the results, one row per rule and attribute. The columns are:
-
Rule name: The rule instance, tagged with the dimension it contributes to.
-
Overall DQ: Quality for that rule instance, shown as a percentage and a bar.
-
Trend: Whether quality improved or declined since the previous run, and by how much. Filter the table by Improving or Declining to see only the rules moving in that direction.
-
Catalog item and Attribute name: Where the rule was applied. Select either one to open its sidebar.
-
Monitor: The DQ monitor the rule runs in. Select it to open the monitor.
-
Evaluated records, Passed records, and Failed records: Record counts from the latest run.
Narrow the table down using the Rule name, Attribute name, Catalog item, Quality ratio, Trend, and Failed records filters above it.
| To find your worst-performing rules, sort by Overall DQ in ascending order, or filter by Failed records. |
What affects the results you see
A dashboard queries your data quality results directly rather than reading a stored copy of them. A dashboard therefore always reflects your current permissions and retention settings.
Monitors you can’t access are hidden
You only see results for the monitors you have permission to view, even when other monitors are part of the dashboard.
This means two people can open the same dashboard and see different aggregated numbers. See Manage Permissions for DQ Assets.
Retention limits how far back results go
Charts and tables can only show evaluation results that still exist. When results are removed, either by retention settings or by manual deletion, they disappear from the dashboard, so aggregated quality and the quality-over-time chart can change.
To control how long results are kept, see Data Quality Retention Settings.
Choose which dashboard report your organization sees
Data quality dashboards were rebuilt in the August 2026 release. If your organization used dashboards before then, an administrator can choose what dashboards show on the Overview tab. Data Stories is selected by default, so your dashboards keep showing the report they used before the rebuild until an administrator changes it.
-
Go to Global settings > DQ settings > DQ Dashboards.
To access Global settings, select the Ataccama logo. -
Select one of the following Overview report options:
-
Data Stories: The Overview tab shows the report your dashboards used before the rebuild.
-
Both: The Overview tab shows the Data Stories report, and a separate Aggregated monitors tab shows the report described on this page.
-
Aggregated monitors: The Overview tab shows the report described on this page.
-
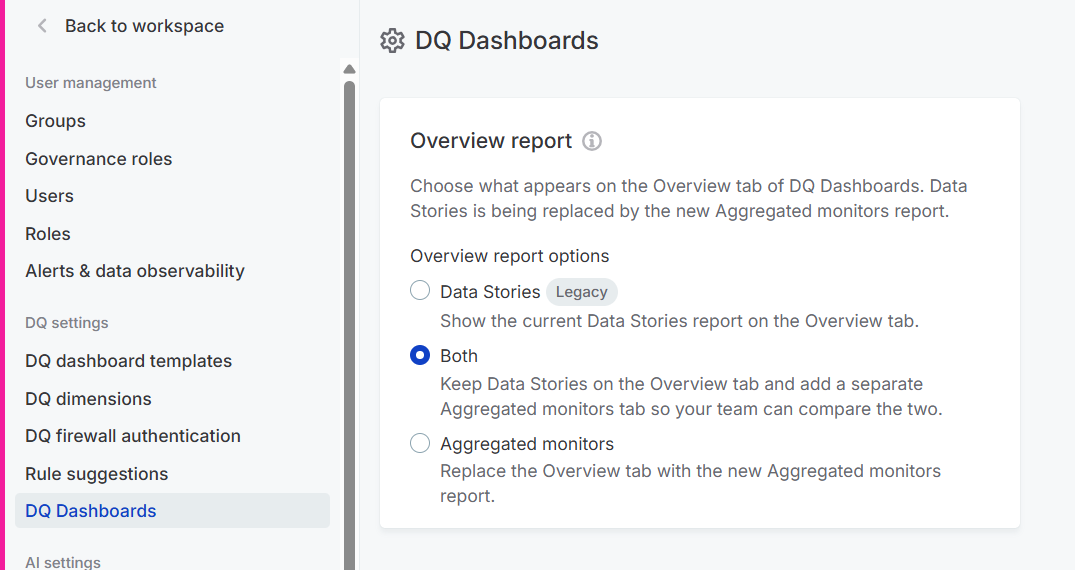
The Data Stories report is being retired, so switch to the Aggregated monitors report when your team is ready. If something you rely on is missing, contact your Customer Success Manager.
Troubleshooting data quality dashboards
No data is displayed
Cause: The selected catalog items have no completed DQ evaluations, or none within the selected date range.
Solution: Verify that DQ evaluation has run for the catalog items. If it has, widen the Time range filter.
The dashboard looks incomplete
Cause: The dashboard includes monitors you don’t have permission to view, so their results are left out.
Solution: Check that all the monitors you expect are shared with your user account. See Manage Permissions for DQ Assets.
Rule configuration isn’t what you expected
Cause: The catalog item was added with a DQ monitor other than the one you expected.
Solution: On the DQ Monitors tab, check the Name column to see which monitor is used for each catalog item. Then check that the monitor itself is set up as you want it. See DQ Monitors.
Was this page useful?