
Investigate DQ Issues
Learn how to identify and investigate data quality issues by analyzing DQ evaluation and profiling results. This page serves as a starting point, rather than a comprehensive guide, for investigating DQ issues.
What are DQ issues
DQ issues occur when data fails to meet the data quality standards expected for its intended use.
Data quality expectations vary by data type and your use case. For some critical assets (for example, regulatory, financial, or safety-critical data), even 95% accuracy might be insufficient, while for others (for example, marketing leads, or web analytics), 80% could be acceptable.
Investigation process
DQ issues typically arise from errors in data collection, transformation, or storage processes. When investigating these issues, focus on identifying root causes so that you can address them with targeted fixes.
If you have thresholds configured, results that fall below a threshold trigger an alert automatically. These alerts can serve as a starting point for your investigation.
Follow this process to effectively investigate DQ issues:
-
Analyze DQ evaluation results:
-
Analyze failing rules and the attributes and terms they affect to see where data quality scores are lowest.
-
Check explanations of the results to understand why records failed.
-
Analyze invalid samples to find patterns in failed records.
-
-
Analyze profiling results to understand data structure and content and to identify DQ issues.
Analyze failing rules and the attributes and terms they affect
Analyze detailed DQ results to identify and understand DQ issues:
-
Open the DQ monitor and choose how to slice the results:
-
Rules: Which rules are failing.
-
Attributes: How each attribute scores, with its rules nested underneath.
-
Terms: How each business term scores.
-
-
Scan for the results with low or decreasing data quality.
-
Select a rule to open its sidebar, then open its Data Quality tab to see the explanations of why records failed.
Analyze invalid samples
Invalid samples show specific records that failed the DQ evaluation. This often provides clearer insights than just reviewing the statistics.
| Invalid samples must be enabled in the DQ monitor settings before running evaluation. If you turn the setting on later, run the monitor again before the samples appear. |
Open the samples for the rule you are investigating:
-
On the Rules, Attributes, Terms, or Records tab, select the rule to open its sidebar.
-
On the Data Quality tab, select Show Invalid Samples.
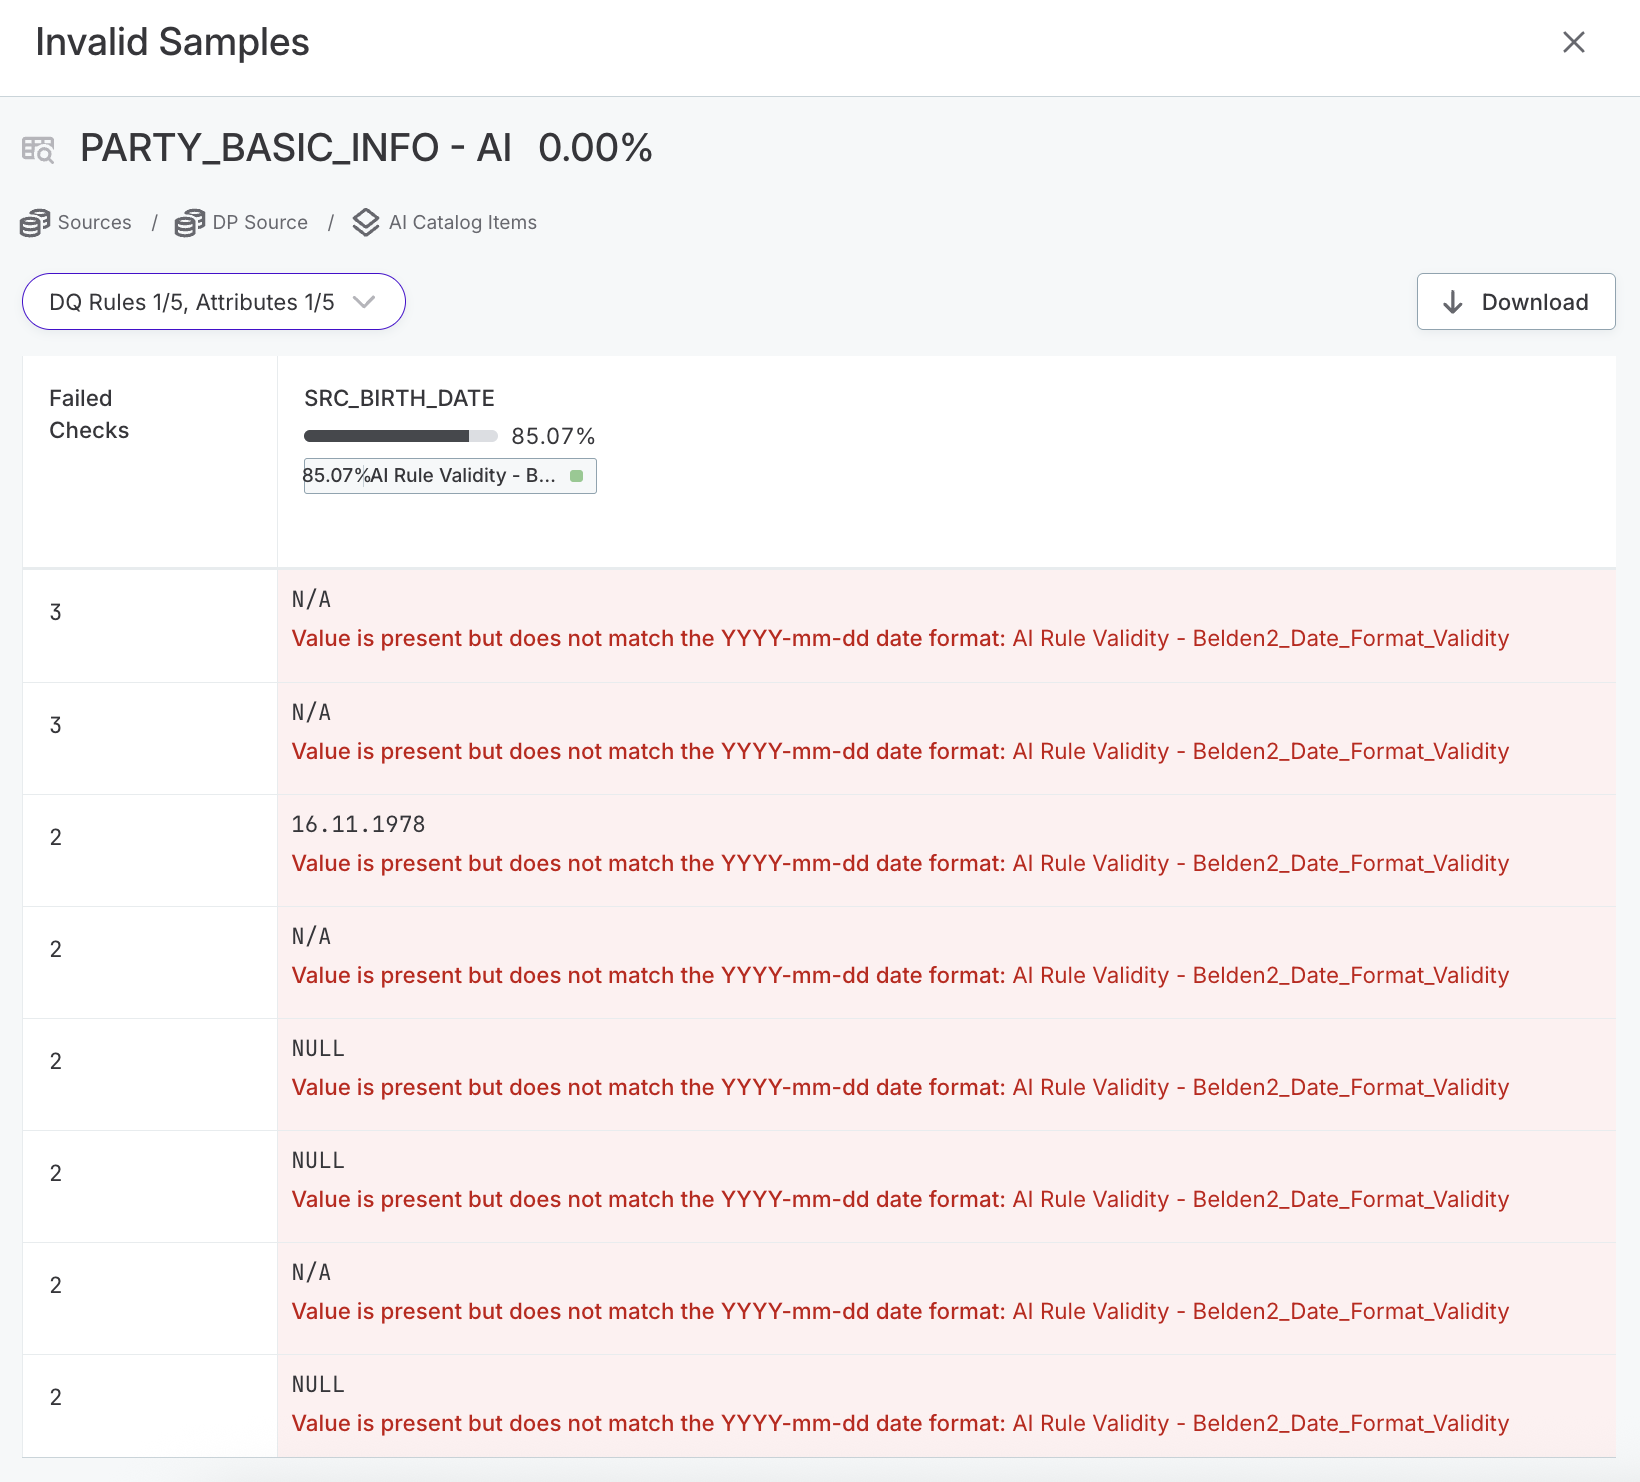
In the samples you can then:
-
Read the Failed Checks column to see which check each record failed and why.
-
Use the DQ Rules and Attributes filters to narrow the samples to specific rules or attributes.
-
Search for patterns in failed records to identify common characteristics.
The Records tab also shows the catalog item’s data directly, so you can browse every failing record rather than one rule’s samples.
Samples are capped per rule, so they suit a quick look at what is failing. Selecting Download gives you a CSV of every sample collected for the catalog item, whichever rule you opened and whatever filter you applied. If you don’t see Download, invalid sample downloads aren’t allowed in your organization. If you need to download samples, ask your application admin. To work with the exported set instead, select All invalid records: for a Snowflake target this opens the table, and for an S3 target it copies the file’s URI to your clipboard. See Export Invalid Records.
Examples
Some examples of common patterns and their possible causes and fixes:
-
Invalid records have a wrong format and missing values. They were filled in the same web application.
-
Possible cause: A field in an online form is not properly validated.
-
Possible fix: Add validations to the online form.
-
-
Invalid records belong to the same customer type.
-
Possible cause: If a default value is applied to the customer type field when it’s left blank or when an error occurs, all records might be assigned the same incorrect customer type.
-
Possible fix: Add validation to the entry field to ensure that the customer type field cannot be left blank.
-
-
Invalid records come from the same country.
-
Possible cause 1: The format for certain types of data (for example, phone numbers, addresses) might differ in the country.
-
Possible fix 1: Use tools to automatically standardize or reformat data as it’s entered.
-
Possible cause 2: If the data is imported or migrated from an external system, there could be issues with how records from that specific country are mapped or parsed during the process.
-
Possible fix 2: Review the migration process and ensure that there are no errors or mismapping during the transfer of data from external systems.
-
-
Invalid records come from the same source system.
-
Possible cause: Problems with data extraction or integration from a specific system.
-
Possible fix: Review and improve how the source system handles data.
-
-
Invalid records have a specific DQ rule applied.
-
Possible root cause: An error in a DQ rule (for example, incorrect value range) marks valid data as invalid.
-
Possible fix: Fix the DQ rule.
-
Analyze profiling results
Analyze profiling results to understand data structure and content, identify DQ issues, and investigate DQ issues identified by DQ evaluation.
You can view profiling results in the monitor Attributes tab. Select the attribute row to open its sidebar, then open the Profiling tab.
For details about profiling statistics, see Understand Profiling Results.
Examples
Common issues that profiling can help identify:
-
Missing values
-
Duplicate entries (for example, duplicate customer ID)
-
Inconsistent data formats (for example, date of birth appearing in the YYYY-MM-DD, MM/DD/YYYY, YYYYMMDD formats)
-
Outliers, values out of the expected range (for example, a “150-years-old” value in the age field).
How can profiling help with investigation of DQ issues:
-
Masks and patterns analysis (for example, if DQ evaluation identified an issue with a phone number format, you can check masks and patterns to see in what formats the numbers actually appear)
Analyze data quality trends
Use the Data quality card on the monitor to observe data quality trends over time. Select the arrow in the card to open its full history.
Monitoring data quality over time helps you:
-
Confirm whether your fixes to improve data quality are working.
-
Detect new issues as they emerge.
-
Establish quality baselines for different types of data.
Examples
Examples of observed trends and what they might indicate:
-
Upward trend: The interventions to improve data quality are effective.
-
Sudden decline: A new source of issues was introduced into your data environment.
-
Recurring drops: These can be linked to specific events, such as regular system migrations. If expected, these drops do not signify a DQ issue.
-
Random fluctuations: Inconsistent data handling or varying standards in data collection across time periods.
Was this page useful?