
Freshness Monitoring
Freshness monitoring tells you whether your data is being updated as expected. By tracking when data is written to your catalog items and comparing it against a freshness SLA you define, Ataccama ONE alerts you when a table goes stale, so you can act before it affects downstream decisions.
What freshness monitoring provides
With freshness monitoring, you can:
-
Track data writes: See when data was last written to each monitored catalog item.
-
Set freshness SLAs: Define how recently a table must be updated, in hours or days.
-
Get alerted on breaches: Receive a finding and an alert when the last data write is older than the SLA allows.
-
Resolve automatically: Rely on findings and alerts closing on their own once data is written again.
-
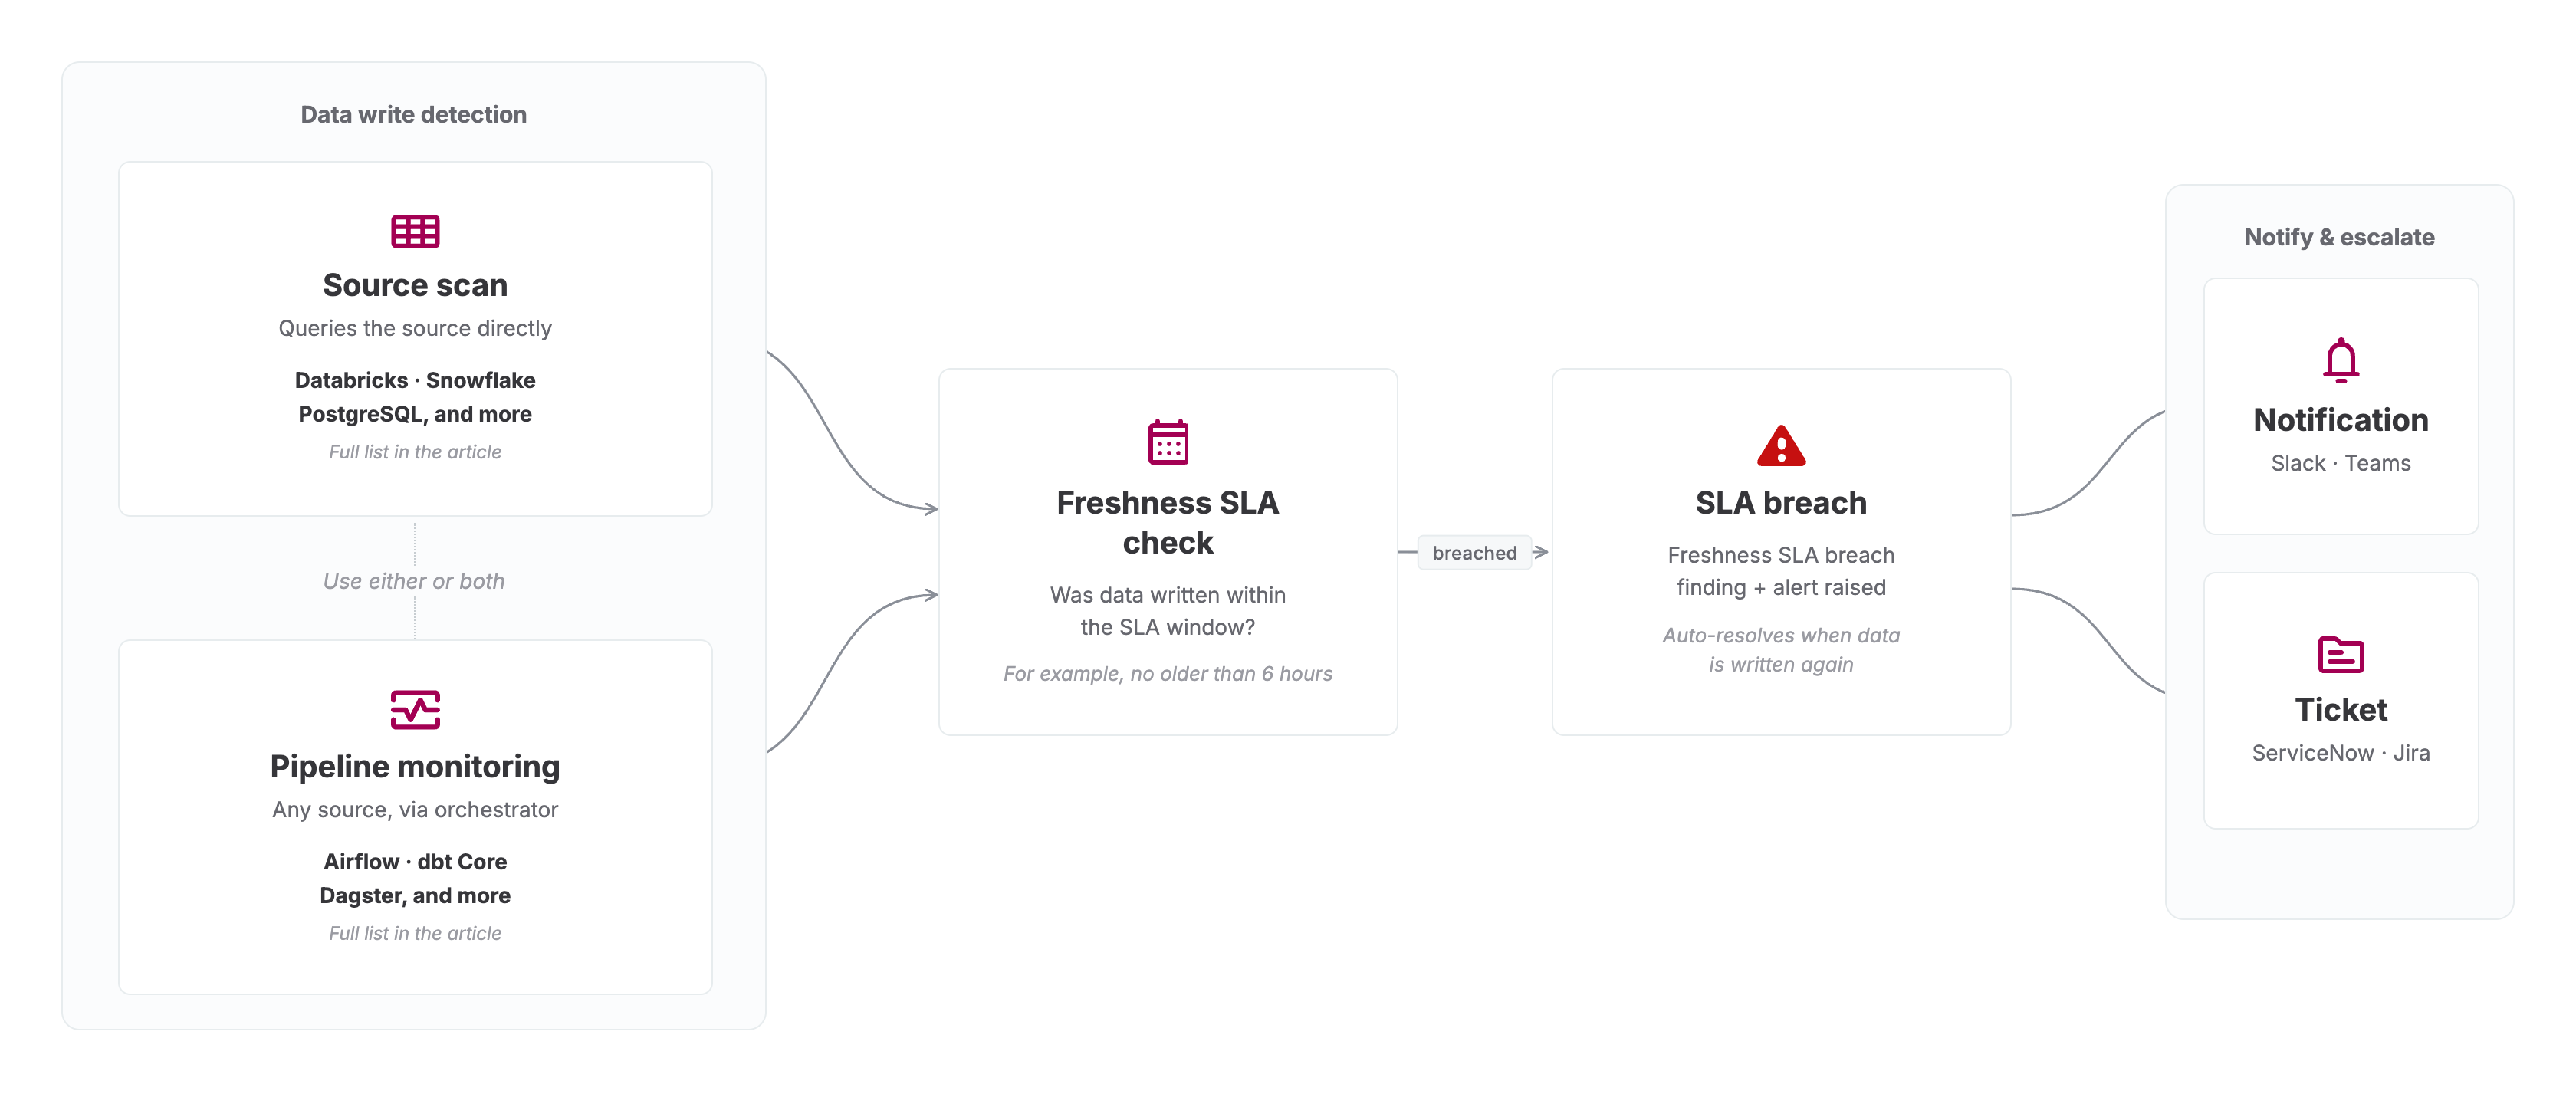
Notify and escalate: Send freshness alert notifications to Slack or Microsoft Teams, or escalate to a ticket in ServiceNow or Jira.
How freshness monitoring works
After you set a freshness SLA on a catalog item, ONE checks for new data writes to it automatically.
If the last data write is older than the SLA allows, ONE creates a Freshness SLA breach finding and raises an alert. For details, including how the finding clears when data is written again, see Freshness findings and alerts.
ONE detects data writes using two independent methods, described in the next section. Each alert shows which method confirmed the most recent write, so you always know where the information came from.
How ONE detects data writes
ONE confirms a data write using up to two independent methods. You can use either method on its own, or both together. Using both gives you the most complete picture of your data’s freshness.
Source scan
ONE queries the source directly to detect recent data writes.
This method is available for these sources:
-
Databricks
-
Snowflake
-
PostgreSQL
-
Amazon Aurora PostgreSQL
-
MS SQL Server, including Azure SQL
-
BigQuery
-
Oracle
This list applies to source scanning only, not to freshness monitoring overall.
For details about what ONE reads in each source, see How Freshness Is Detected by Source. For the full connector reference, see Supported Connectors.
Pipeline monitoring
ONE treats a successful pipeline job that writes to a table as a data write for that table. This method works for any source, as long as the pipeline that writes to it is monitored through a configured orchestrator connection, such as Apache Airflow or dbt.
Pipeline monitoring lets you monitor freshness for a source that source scanning does not support, as long as its data is produced by a monitored pipeline. To set this up, connect your orchestrator and monitor the relevant pipeline jobs. See Pipeline Monitoring and Connect to an Orchestrator.
The source scan list is not the limit of freshness monitoring. If your source is not on that list, you can still monitor its freshness by setting up pipeline monitoring for the jobs that write to it.
Prerequisites
Before you can monitor freshness, you need:
-
A source added in ONE, with at least one catalog item you want to monitor.
-
Sufficient permissions to configure source monitoring and edit DQ monitors. For details, see Manage Data Observability Permissions.
-
For the pipeline monitoring method, a configured orchestrator connection and monitored pipeline jobs. For details, see Pipeline Monitoring.
Get started
Setting up freshness monitoring involves two mandatory steps: enabling freshness monitoring on the source, and setting a freshness SLA on each catalog item you care about.
Step 1: Enable freshness monitoring for a source
Enabling freshness monitoring on a source unlocks freshness settings for all catalog items in that source. On its own, this step does not start monitoring any catalog item.
-
Go to Sources and open the source you want to monitor.
-
Select the Monitoring tab.
-
In Freshness monitoring, select Configure.
-
Turn on Enable freshness monitoring.
-
Select Save.
Step 2: Set a freshness SLA on a catalog item
Freshness monitoring only starts once you set a freshness SLA on a catalog item. Without an SLA, ONE does not check the item and does not create findings, in the same way a DQ monitor without a threshold never triggers an alert.
You set the SLA on the catalog item’s primary monitor.
| You can set and edit the freshness SLA on the primary monitor only. Freshness is not shown on additional monitors, even when it is enabled on the source. |
-
Open the catalog item and go to its DQ monitor.
-
Select the Settings icon in the monitor header.
-
In the Freshness section, select Monitor freshness.
-
Set the SLA value and choose Hours or Days.
-
Save your changes.
-
Publish the monitor.
For more about the monitor Settings panel, see the Freshness settings.
Set an SLA when you use pipeline monitoring only
If you monitor freshness through pipeline monitoring rather than source scanning, you still set the SLA on the catalog item that the pipeline writes to.
To find that catalog item from a monitored pipeline:
-
Go to Data Observability > Pipeline monitoring and open the relevant pipeline job.
-
In the job’s Pipeline view, identify the output asset the job writes to.
-
Open that catalog item and set its freshness SLA as described in Step 2: Set a freshness SLA on a catalog item.
Monitor freshness
Once a catalog item has a published freshness SLA, its DQ monitor shows a Freshness card. The card displays the history of detected data writes against your SLA, so you can see how consistently the table is updated.
Use Scan now to check for a recent data write on demand instead of waiting for the next scheduled check. How often scheduled checks run depends on the freshness configuration on the source or catalog item.
Both on-demand and scheduled scans appear in Processing center, where you can follow a scan’s progress, see which catalog items it covered, and cancel a scan that is still running. See Freshness scans.
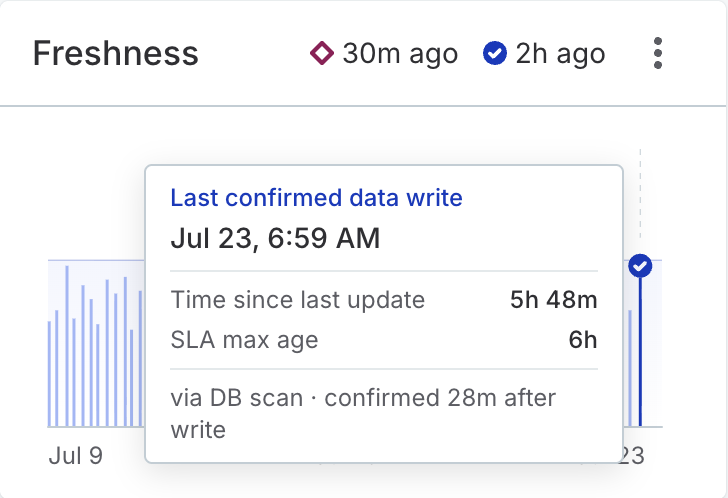
Point to any write on the timeline to see its details, including the time since the last update, the SLA it is measured against, and which method detected the write.
Freshness findings and alerts
When a catalog item goes longer than its SLA without a detected data write, ONE creates a Freshness SLA breach finding and raises an alert.
Freshness alerts follow the standard alert lifecycle:
-
The finding and alert are Active while the SLA remains breached.
-
As soon as a data write is detected, the finding and alert transition to Inactive, because the data has been refreshed.
-
The full history is kept on the catalog item, and any notifications or tickets you configured remain traceable.
Each freshness finding shows which method detected the write, such as via DB scan for source scanning or via pipeline monitoring.
For more about working with alerts, see Investigate Alerts.
See also
-
How Freshness Is Detected by Source — How ONE detects data writes in each supported source.
-
Pipeline Monitoring — Monitor pipeline executions and feed freshness signals.
-
DQ Monitors — Configure DQ monitors, including freshness SLAs.
-
Investigate Alerts — Investigate and resolve alerts, including freshness breaches.
-
Get Notifications for Alerts — Route freshness alerts to the right people.
Was this page useful?