
Processing Center
The processing center provides visibility into all data processing activity in Ataccama ONE. Use it to monitor workflows, manage scheduled jobs, and inspect individual data processing module (DPM) jobs.
Access the processing center
To access the processing center, select Processing center in the left navigation menu.
Quick view
Selecting Processing center opens a quick view popover showing recent activity. This provides an at-a-glance summary without leaving your current page.
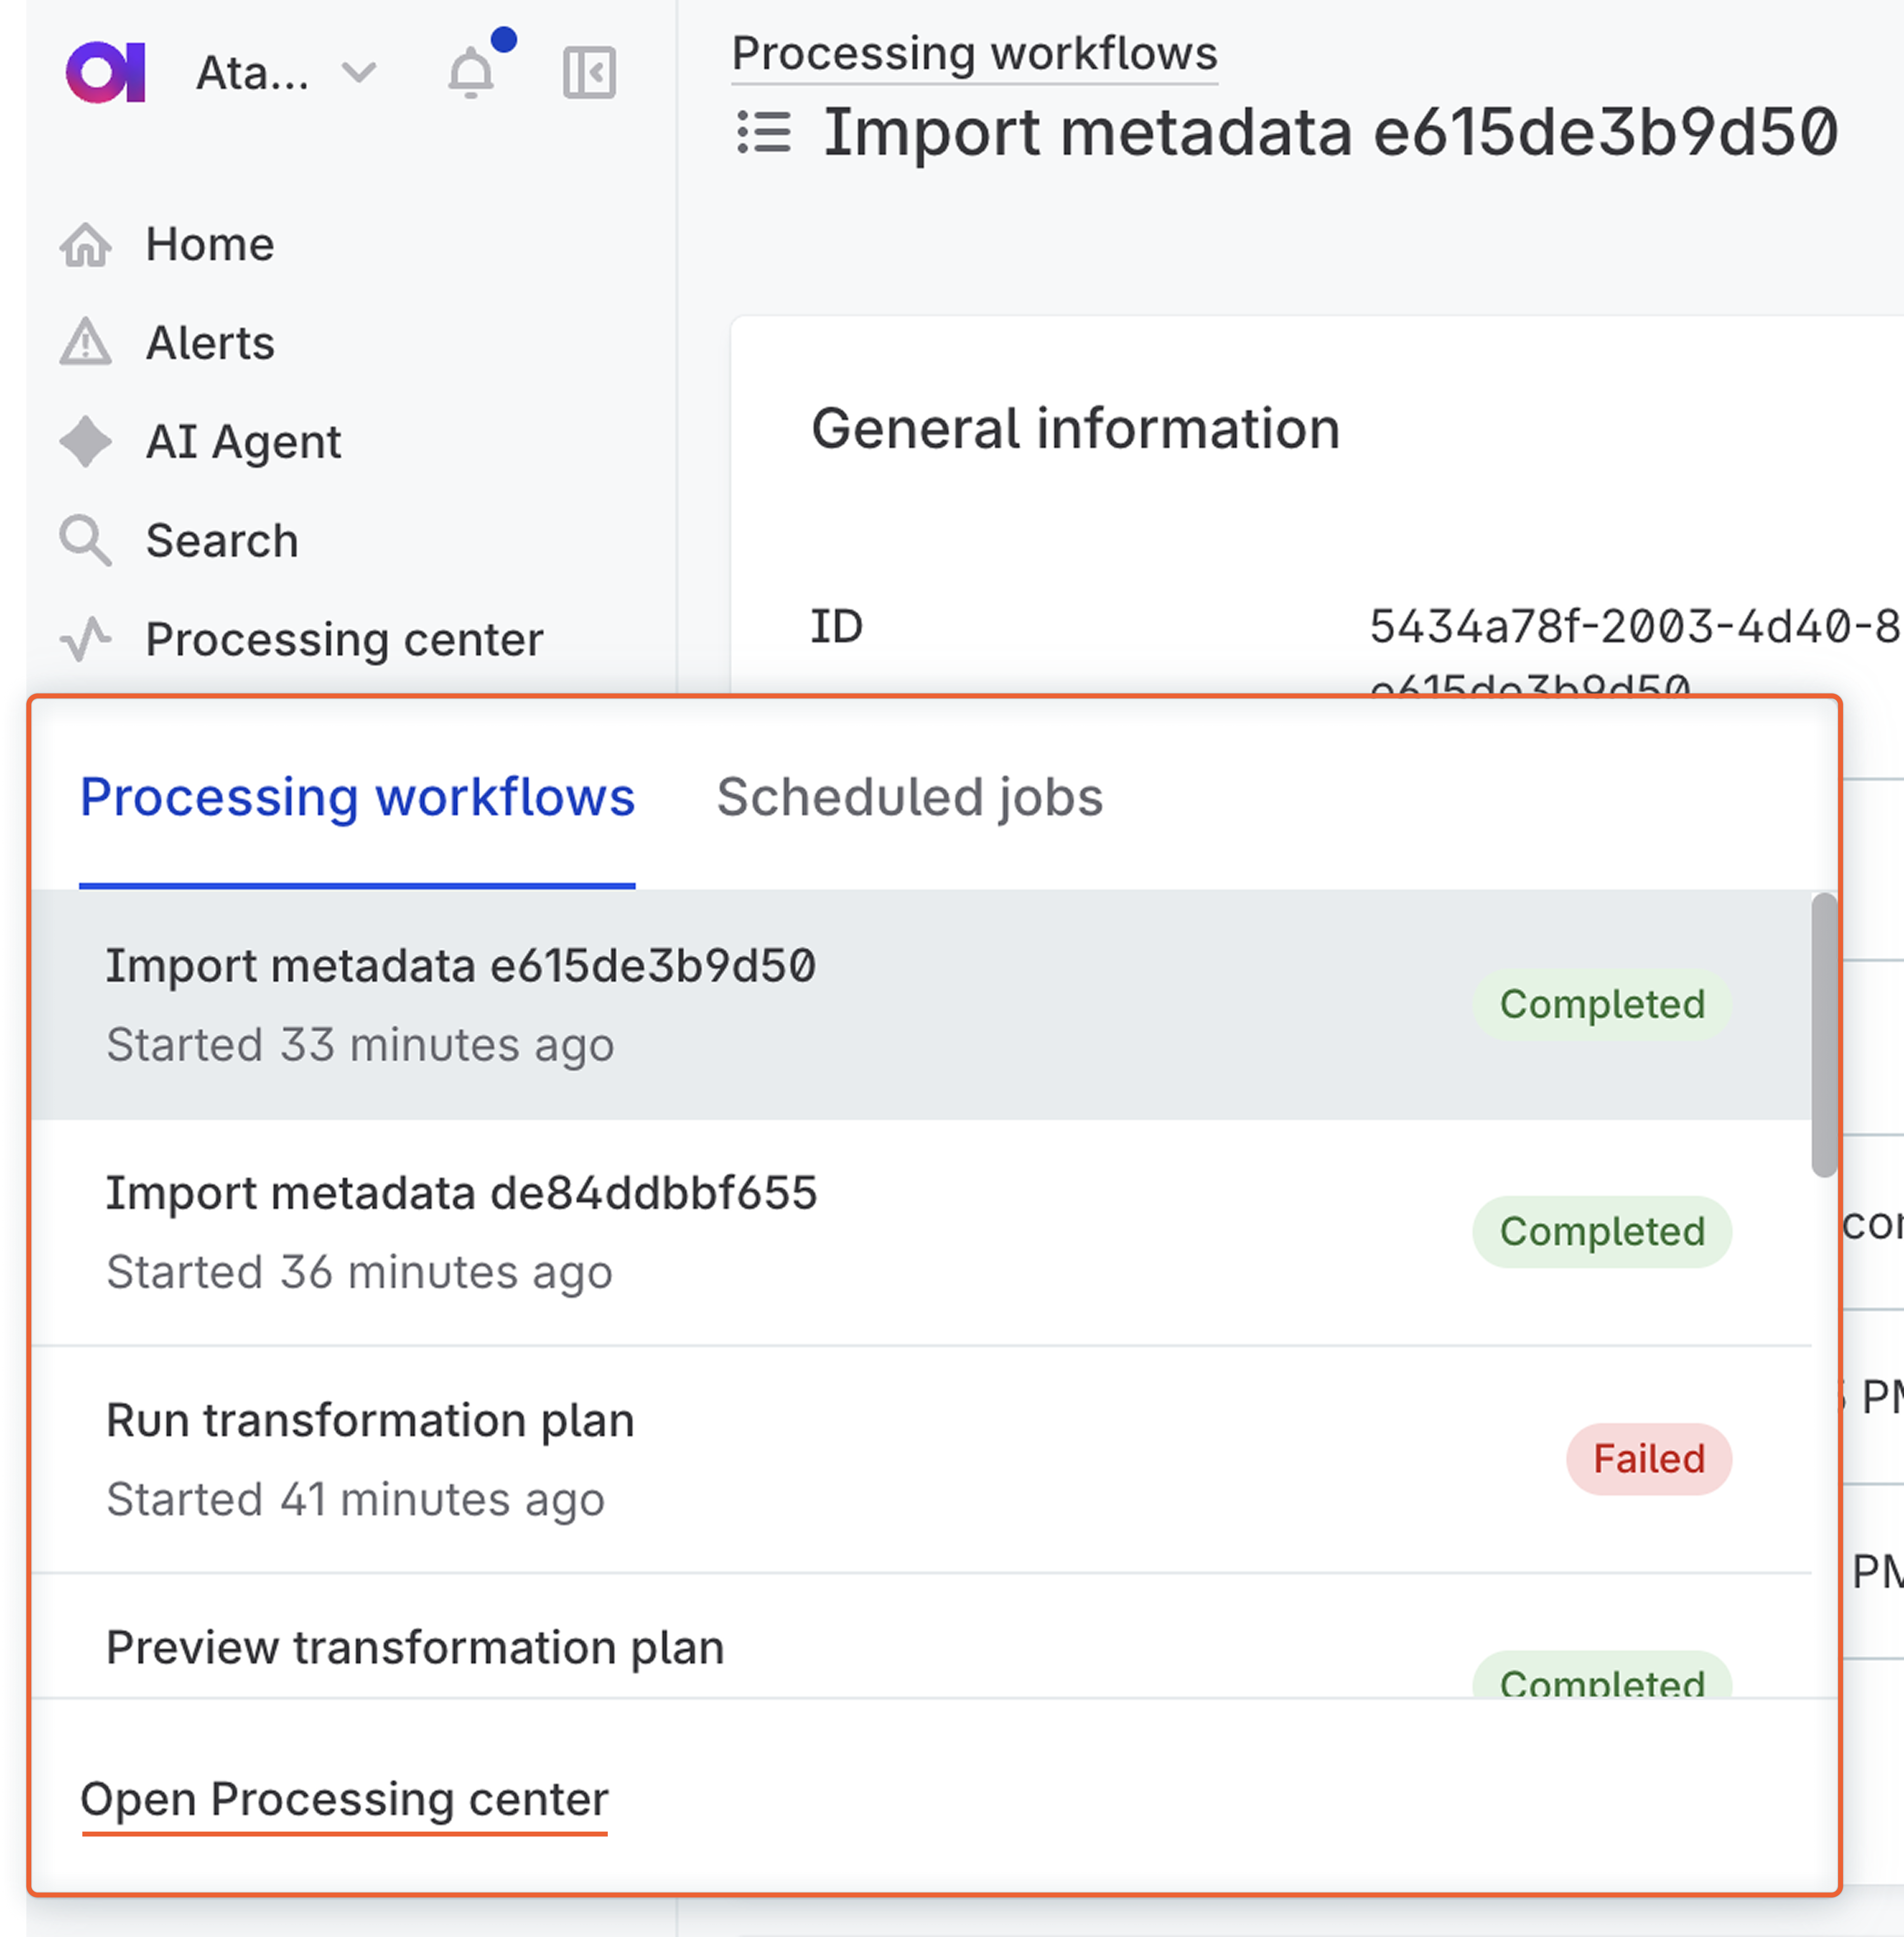
The quick view displays two tabs:
-
Processing workflows: Recent workflows with their name, start time, and status.
-
Scheduled jobs: Upcoming scheduled jobs.
Each tab shows a count of total items. To open the full processing center, select Open Processing center at the bottom of the popover.
| The quick view is useful for checking recent workflow status or upcoming scheduled jobs without navigating away from your current task. |
Full view
The full processing center page provides comprehensive job management and is organized into three tabs:
-
Workflows: Monitor processing workflows and their constituent jobs.
-
Scheduled jobs: View and manage job schedules.
-
DPM jobs: Inspect individual jobs processed by the data processing module.
Workflows
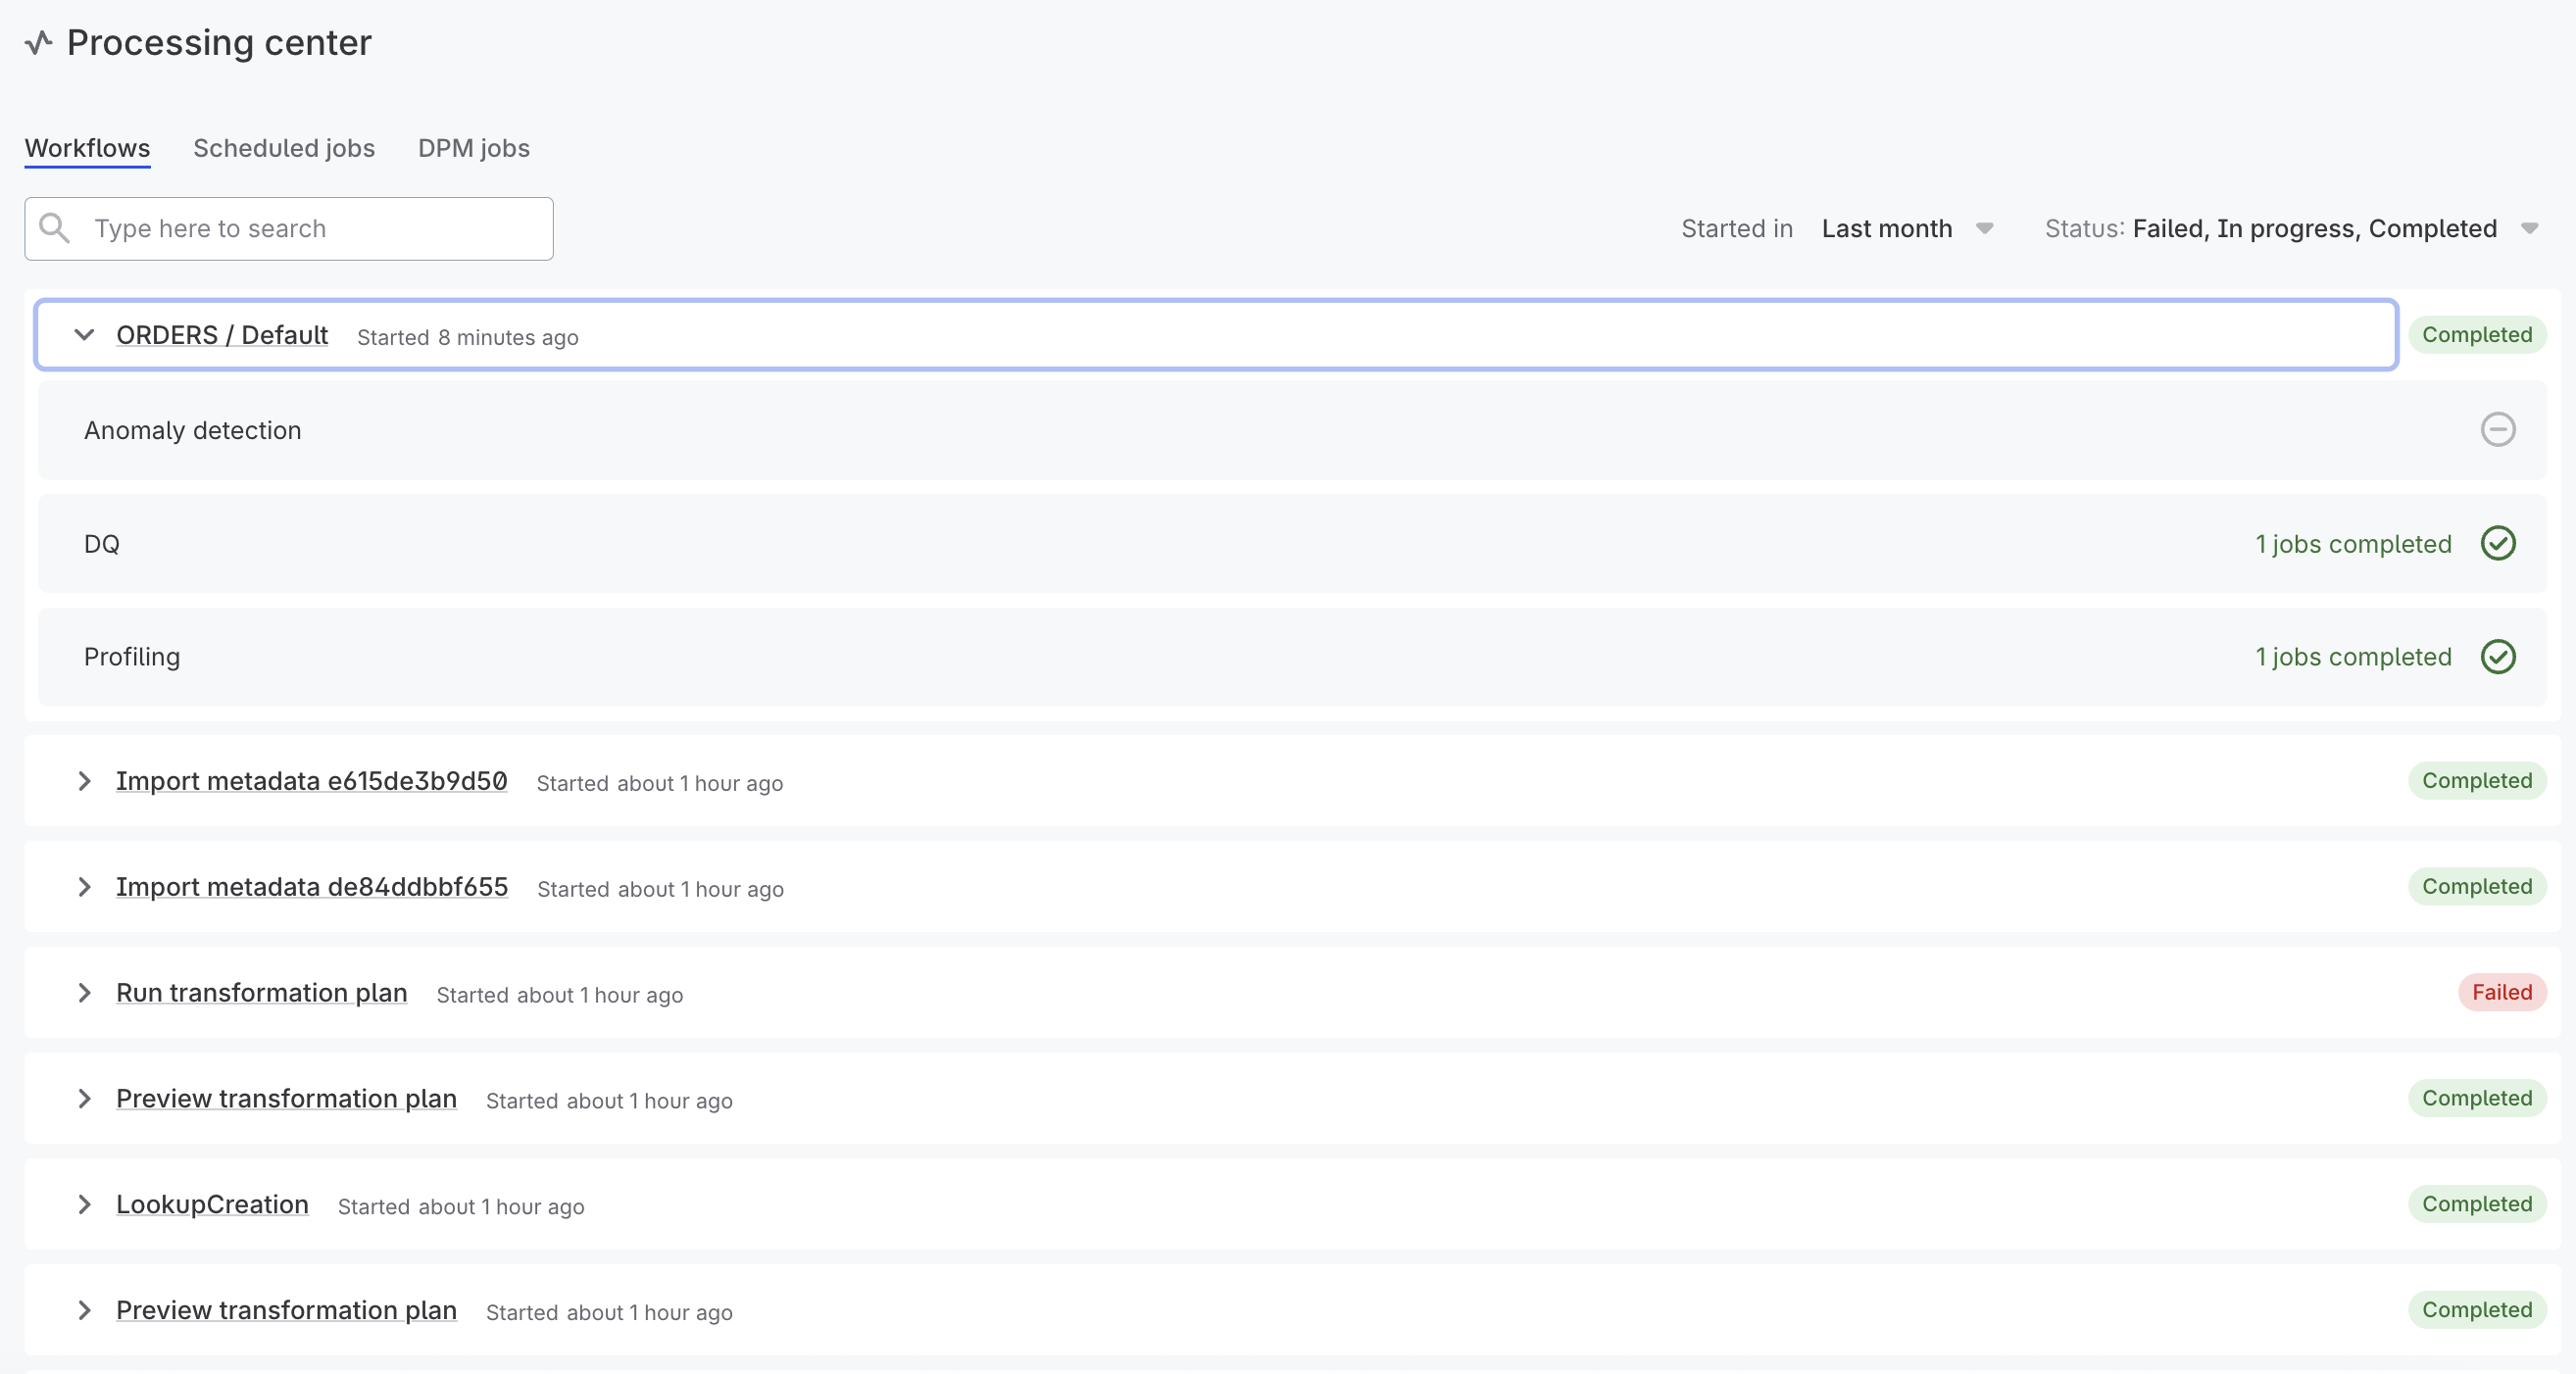
The Workflows tab displays processing workflows. Workflows are operations that bundle multiple jobs together, such as running a transformation plan, executing a "profile and evaluate" action on a catalog item, or running a DQ monitor.
View workflows
Workflows are listed with their name, start time, and overall status. Select a workflow row to open a sidebar panel showing its status, type, timings, and the individual jobs it contains, such as Anomaly detection, DQ, or Profiling.
Use the filtering options to find specific workflows:
-
Search: Search workflows by name.
-
Started in: Filter by time range (Last hour, Last day, Last week, Last month).
-
Type: Filter by workflow type, such as DQ job, Export, Freshness scan, or Metadata import.
-
Status: Filter by workflow status (Failed, Completed, In progress, Skipped, Canceled, Pending).
-
Background jobs: Include workflows that run in the background instead of being started by a user. Off by default.
-
My own: Limit the list to your own workflows. Off by default.
View workflow details
Select a workflow name to open its detail page, or select View full details in the sidebar panel.
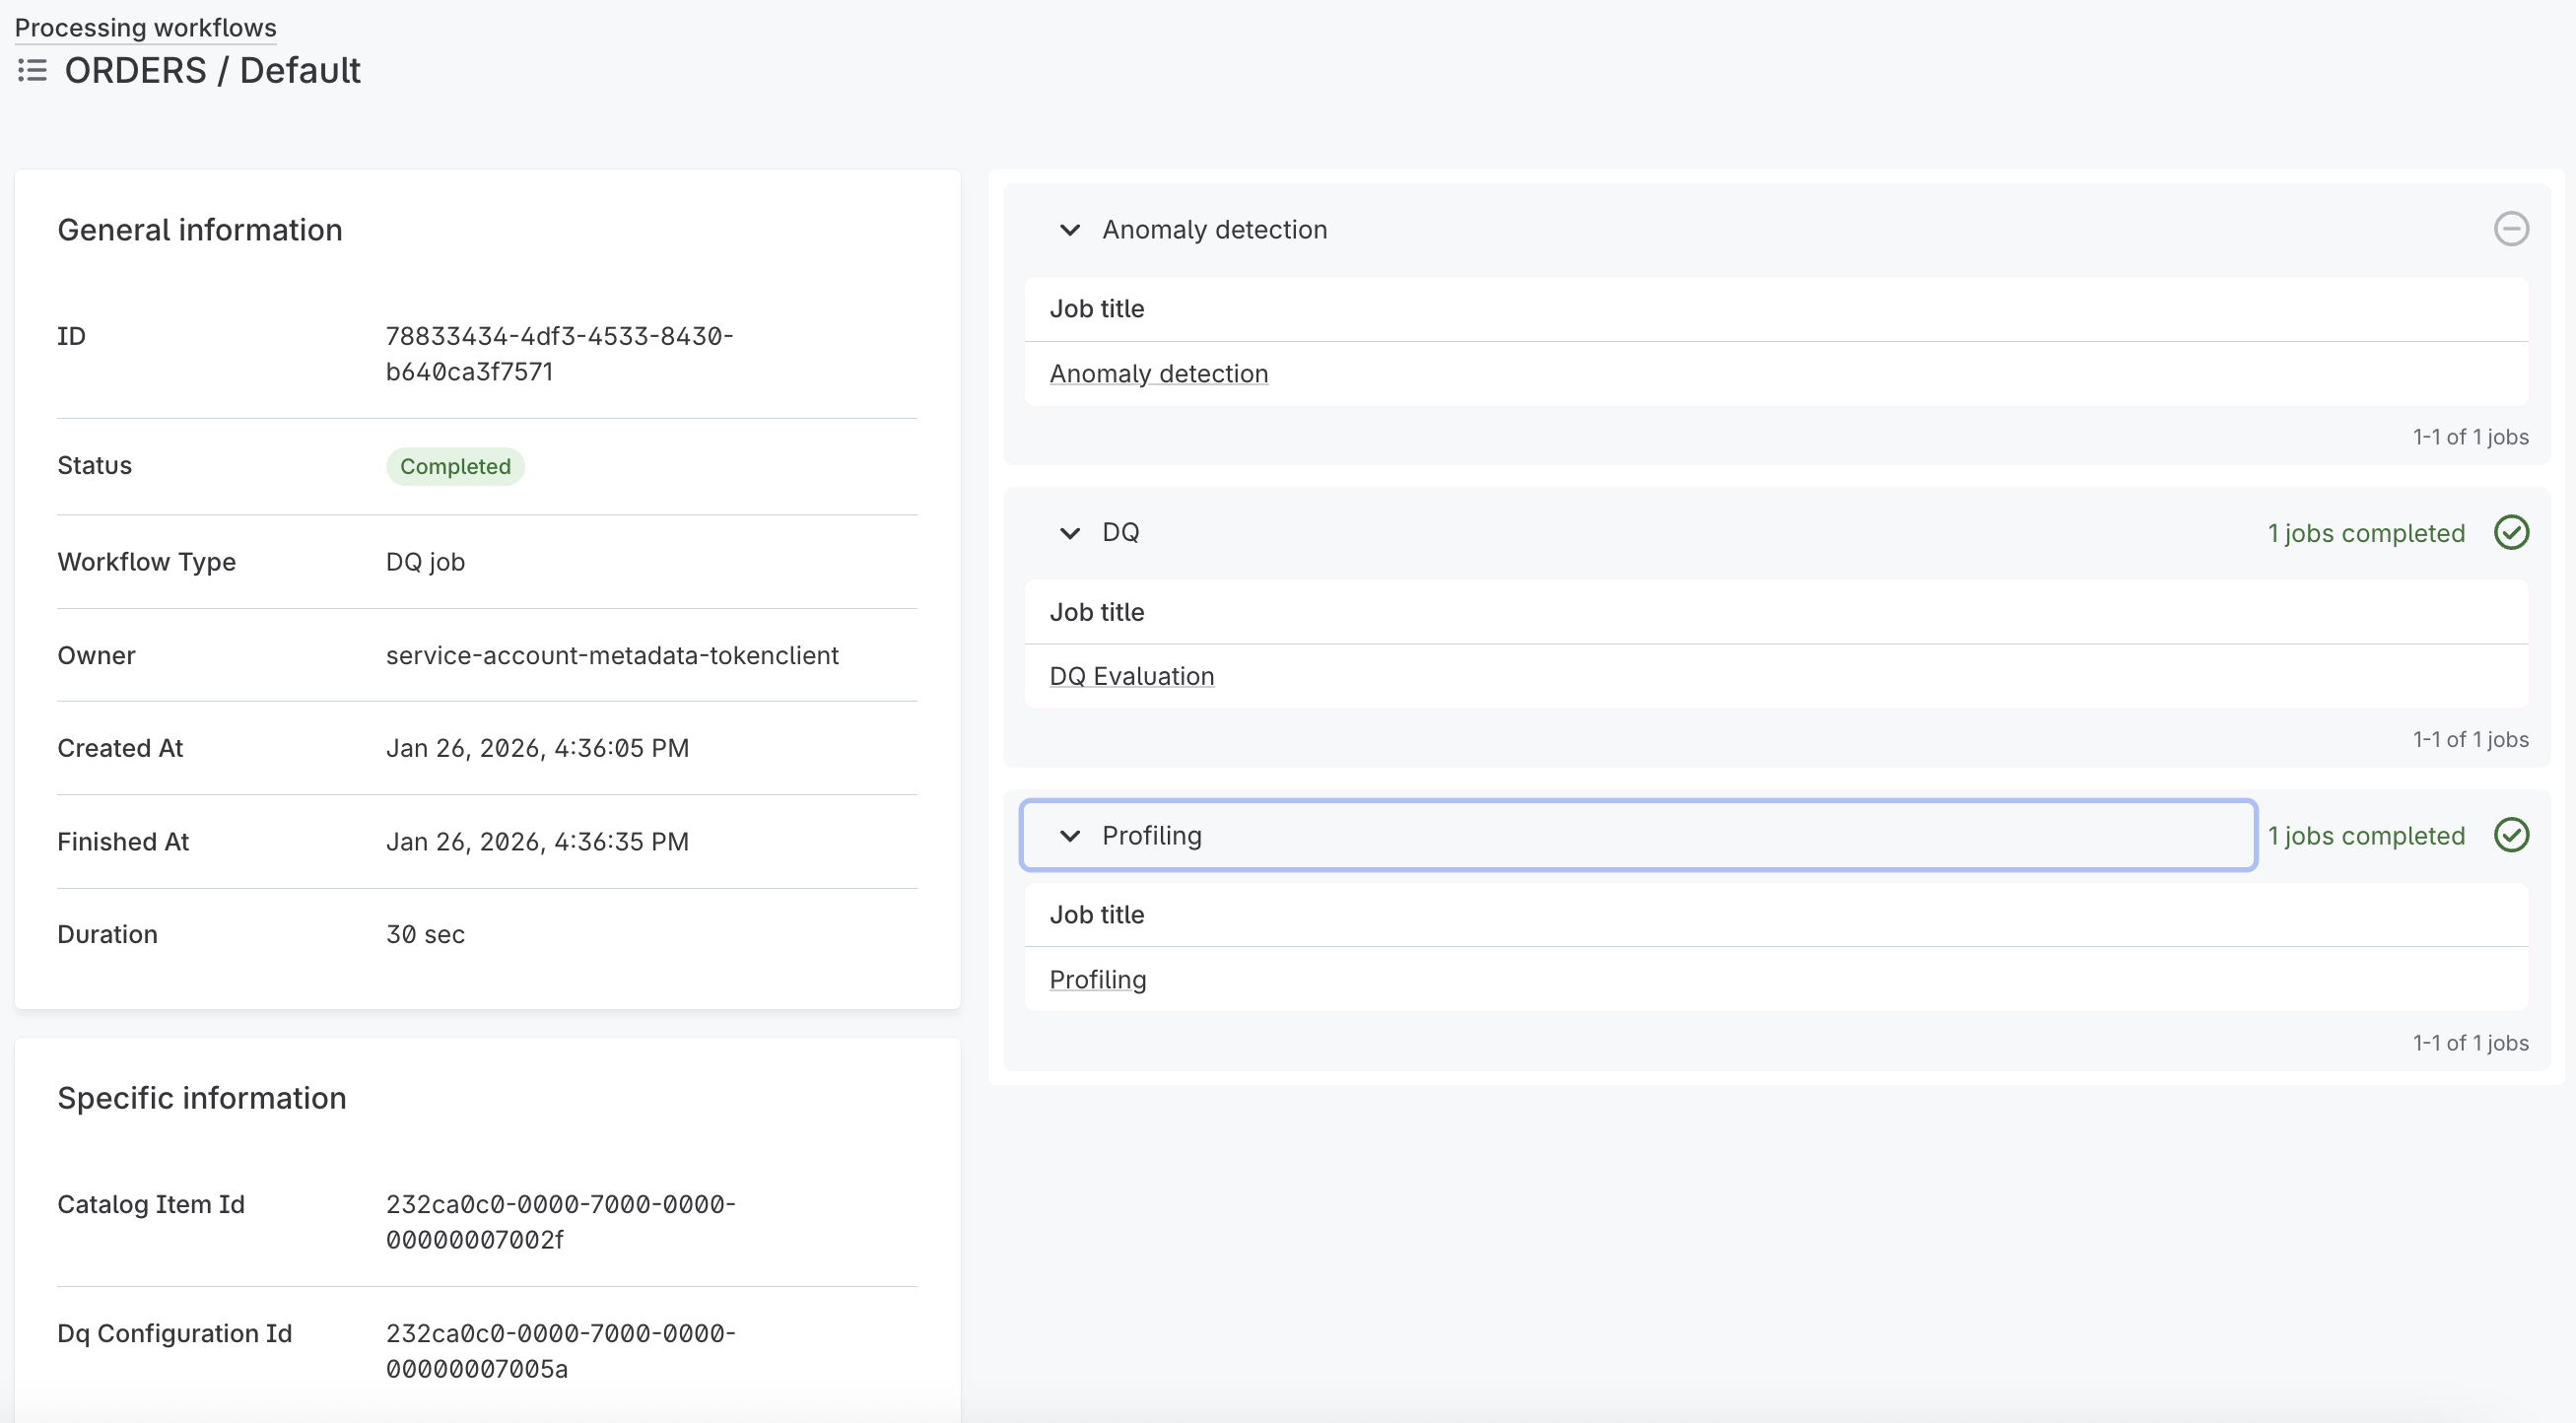
The workflow detail page displays:
-
General information: Workflow ID, status, type, owner, creation and completion timestamps, and duration.
-
Job breakdown: Individual jobs within the workflow, organized by processing stage (for example, Resolving dependencies, Running preview, Processing results). Each stage shows its completion status and the number of jobs completed.
Freshness scans
Freshness scans check the catalog items in a source for recent data writes, and appear on the Workflows tab alongside other processing activity. Each scan is named for the source it checks and the number of catalog items it covers, for example Freshness scan - Snowflake Edge (5 catalog items).
Scans are started in two ways:
-
On-demand scans: Started by selecting Scan now on a catalog item’s Freshness card. A notification confirms the scan is queued and links to the workflow.
-
Scheduled scans: Started automatically in the background, according to the freshness configuration on the source or catalog item.
Because scheduled scans run in the background, they stay hidden until you select Background jobs. Background jobs is also switched on automatically when you select Freshness scan in the Type filter.
Freshness scans do not appear on the Scheduled jobs tab.
To see which catalog items a scan covered, open its detail page and check the Links section. The edge instance that ran the scan is shown both in the workflow list and on the detail page.
Scheduled jobs
The Scheduled jobs tab lists all job schedules configured in Ataccama ONE. Schedules automate recurring tasks such as DQ evaluation, lookup rebuilds, and system maintenance.
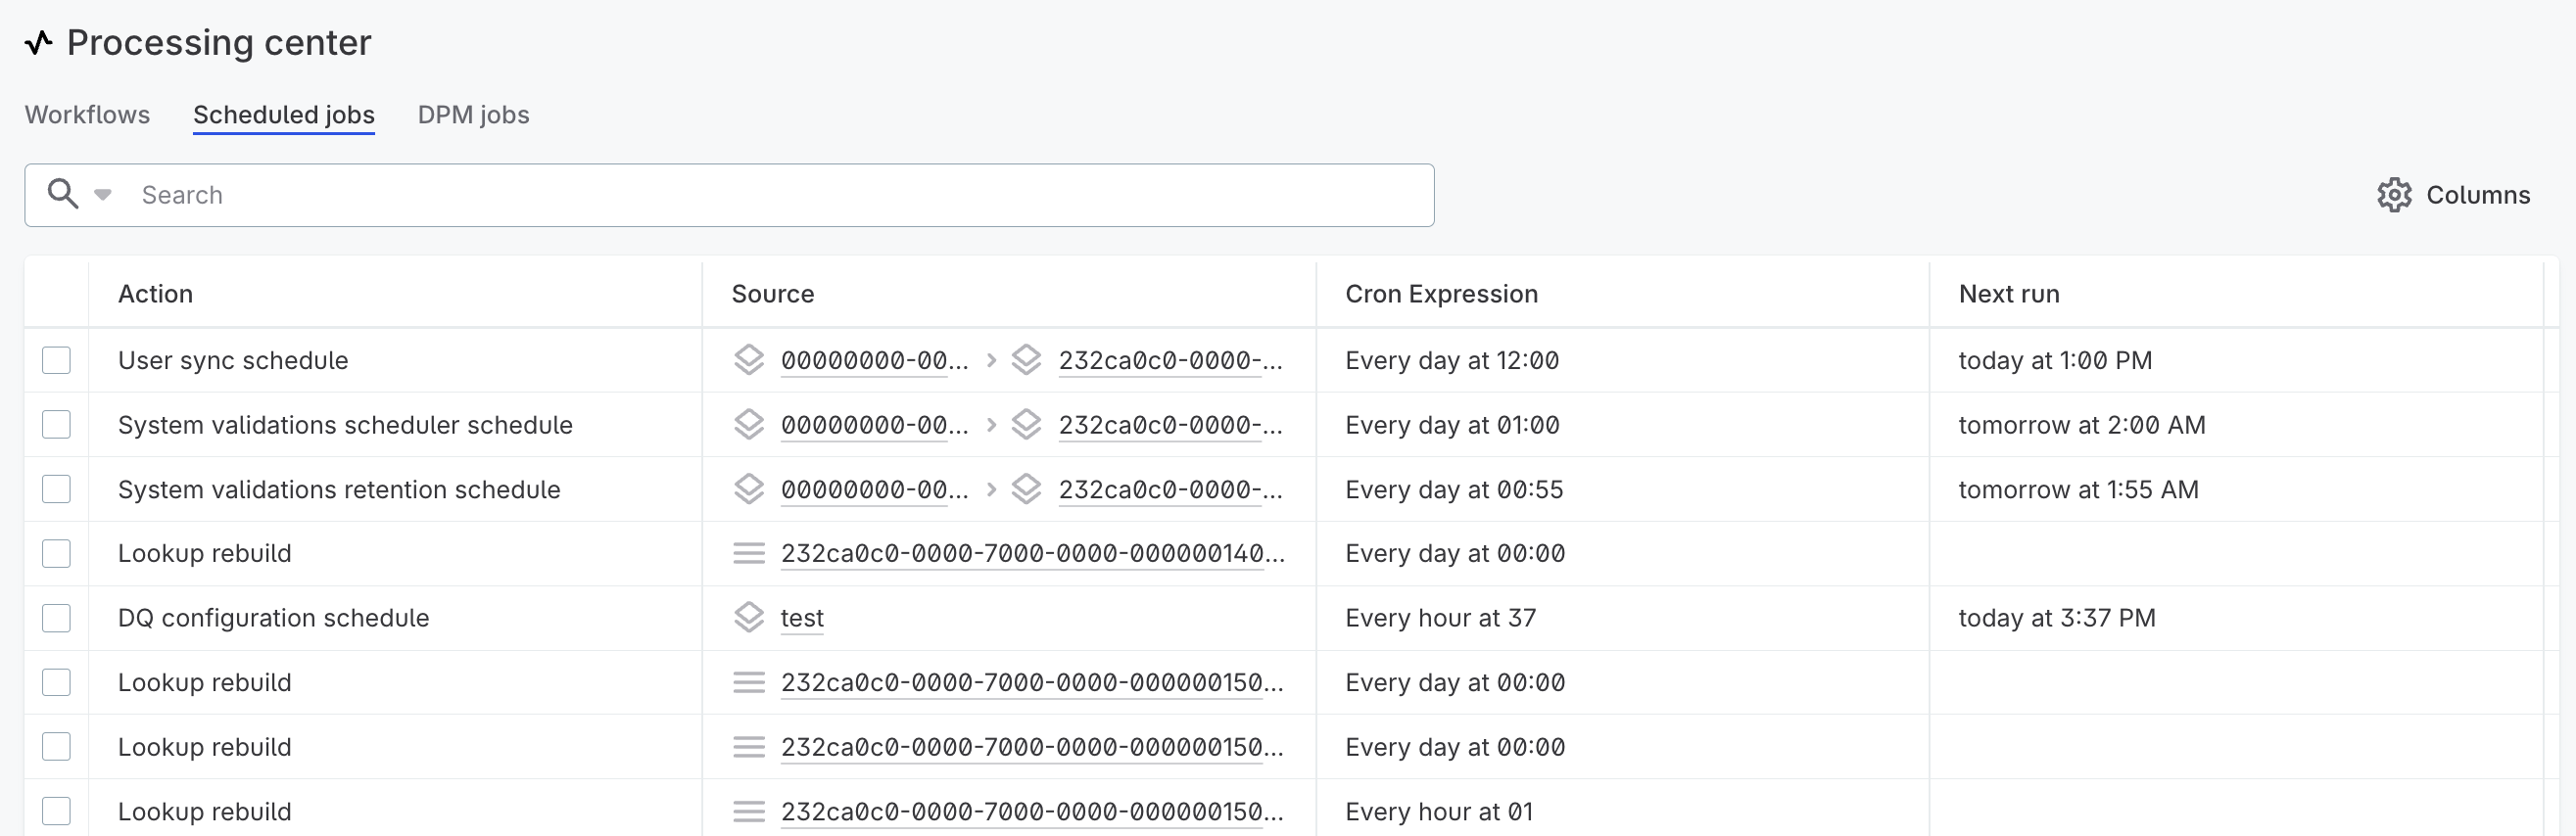
| You cannot create or edit schedules from this view. To modify a schedule, select the item in the Source column to navigate to where the schedule is defined. |
View scheduled jobs
The schedule list displays the following information:
-
Action: The type of scheduled job (for example, DQ configuration schedule, Lookup rebuild, User sync schedule).
-
Source: The path to the asset or configuration associated with the schedule. Select the source to navigate to the schedule configuration.
-
Cron expression: The schedule frequency in human-readable format (for example, "Every day at 00:00") or cron syntax.
-
Next run: The next scheduled execution time, or "Disabled" if the schedule is inactive.
Use the search bar to find schedules by name or source path. Select Hidden columns to customize which columns are displayed.
View schedule details
Select a schedule row to open its details in a sidebar panel. The sidebar displays:
-
Description: Optional description of the schedule.
-
General information: Cron expression, enabled status, ignore misfires setting, time zone, start and end dates, priority, and next run time.
-
Info: Next scheduled run and last job execution.
To view the full schedule detail page, select the schedule name in the sidebar header. The detail page includes an Overview tab with schedule configuration and a History tab showing past executions.
DPM jobs
The DPM jobs tab provides direct access to individual jobs processed by the data processing module. This view offers detailed technical information useful for monitoring, debugging, and performance analysis.
View DPM jobs
The job list displays:
-
Name: The job name or identifier.
-
Engine: The Data Processing Engine (DPE) that processed or is processing the job.
-
Type: The job type (for example, DQC, DQ_EVAL_CATALOG_ITEM, PUSHDOWN-PROFILING, LOOKUP-CREATE, PROFILING).
-
Created: The date and time the job was created.
-
Submitting user: The user who initiated the job.
-
Status: Current job status (Running, Starting, Queued, Success, Failure, Killing, Killed).
-
Priority: The job’s priority value.
-
Progress: Completion percentage.
See here for a full list of possible job statuses and their descriptions
-
UNKNOWN: Default initial state for newly created jobs.
-
SUBMITTED: Job has been submitted to the data processing pipeline.
-
PREPROCESSING: Job is in the preprocessing stage of the pipeline.
-
QUEUED: Job is waiting in queue to be sent to the data processing engine.
-
SUBMITTING: Job is being submitted to the data processing engine.
-
SUBMITTED_TO_ENGINE: Job has been successfully submitted to the data processing engine.
-
STARTING: Data processing engine is initializing the job.
-
RUNNING: Job is actively being processed by the engine.
-
PROCESSED: Job processing has been completed by the engine.
-
POSTPROCESSING: Job is in the final postprocessing stage.
-
SUCCESS: Terminal state indicating successful job completion.
-
FAILURE: Terminal state indicating job failure.
-
KILLING: Job has been selected for termination by user.
-
KILLED: Job has been successfully terminated.
-
DISCONNECTED: Engine has disconnected and associated jobs are marked accordingly. If the engine reconnects before timeout, the job reverts to its standard state.
-
EVICTED: Job requires restart due to pipeline rescheduling. This status indicates that part of the data processing pipeline needed to be rescheduled, and the job needs to be restarted at that stage of the pipeline.
Use the following options to customize your view:
-
Search: Search jobs by name or identifier.
-
Status: Filter by job status.
-
Hidden columns: Show or hide specific columns.
-
Clear sort: Reset column sorting.
-
Refresh: Manually refresh the job list, or enable auto-refresh at intervals of 5, 10, 20, or 30 seconds, or 1 minute.
View job details
The job detail page provides comprehensive technical information for debugging and analysis.
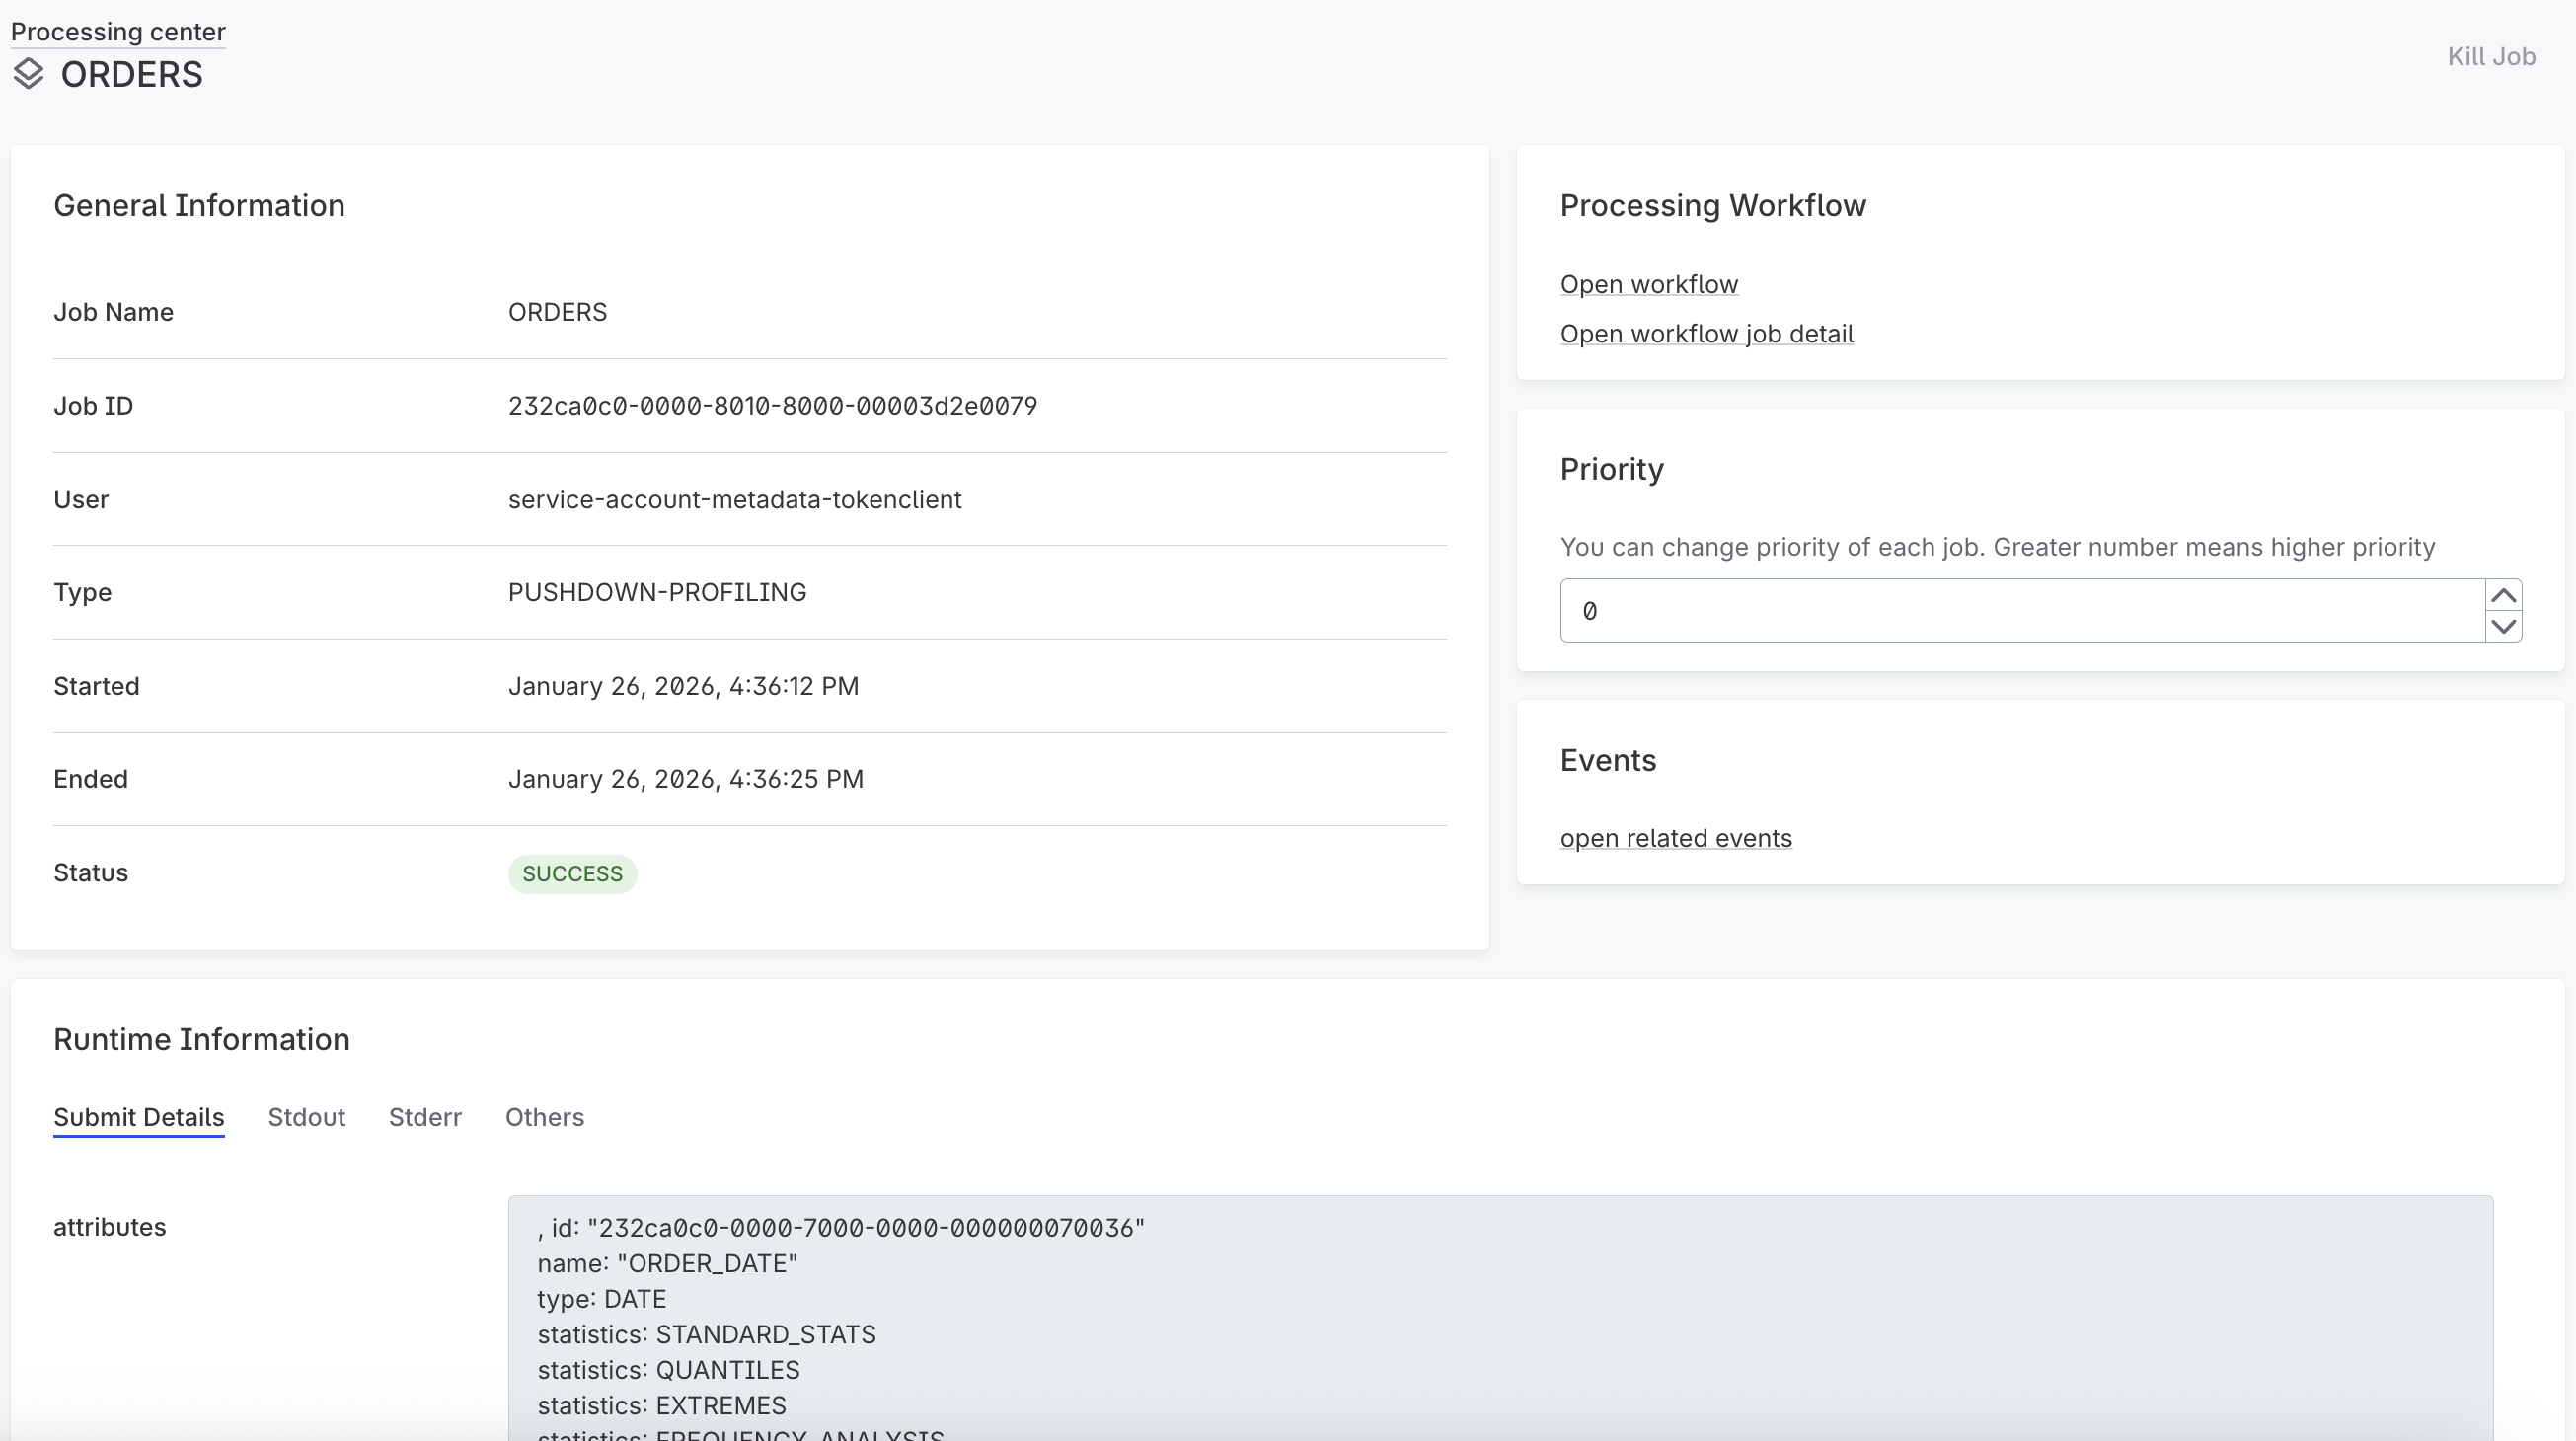
The page includes:
-
General information: Job name, ID, user, type, start and end times, and status.
-
Processing workflow: Links to open the parent workflow or workflow job detail.
-
Priority: Adjust job priority (higher values indicate higher priority).
-
Events: Link to view related events.
| You can also select a job row to open its details in a sidebar panel. |
Runtime information
The Runtime information section provides detailed technical data organized into four tabs:
-
Submit details: Job submission details including file locations, configuration settings, data source information, and execution plans. This covers the locations of working, job, and runtime folders, runtime and server configurations, data source and catalog item details, entity, component, and plan structures, entity attributes, and launch type (for profiling jobs).
-
Stdout: Standard output stream from job processing.
-
Stderr: Standard error stream from job processing.
-
Others: Additional information such as dependency properties (listing lookups and components used in the job) and job PID.
| The Stdout and Stderr tabs are useful for debugging, as they provide direct access to processing output without searching through log files. |
View job events
Events trace the stages a job passes through from submission to completion. This information helps identify where and why a job failed.
To view events for a specific job, select open related events in the job details sidebar.
The events list displays:
-
Sequential ID: A consecutive number assigned when the event was initiated.
-
Job ID: The identifier of the associated job. This identifier can be used to retrieve all events related to a single job.
-
Created: The date and time the event was created.
-
Data: Event data, typically status or progress information in JSON format.
-
Description: Additional context for the event.
Change job priority
You can adjust the priority of jobs to control processing order. Priority is expressed as an integer value. Jobs with higher priority values are processed before jobs with lower values. The default priority is 0. Jobs with equal priority are processed in the order they were submitted.
To change a job’s priority:
-
Select the job row to open the details sidebar.
-
In the Priority section, enter a new value.
-
The change takes effect immediately for queued jobs.
Cancel jobs
You can cancel jobs that have not yet completed. Cancellation can fail if the job is too far into the process at the time of cancellation. Additionally, canceling one job can affect other running jobs.
| After canceling jobs, check the processing center to confirm the cancellation was successful and to see if any other jobs were affected. |
Was this page useful?