
Manage Visualizations and Collections
ONE Reports provides a powerful visualization builder to create compelling charts and quickly identify patterns and trends in your data. You can then include those visualizations in dashboards or stories.
Visualizations are stored in collections, which act as folders for organizing related visualizations. Before creating your first visualization, you need to create or have access to a collection.
Before you start
In ONE Reports, you can work with ONE catalog items and SQL catalog items, as well as reference data tables.
The application supports AWS Aurora PostgreSQL, PostgreSQL, and Snowflake connections as data sources.
| ONE Reports leverages data protection classification that prevents unauthorized access to protected data, as signaled by visual indicators (lock icons) and notifications. For more information, see Data Protection in ONE Reports. |
Create a collection
Collections are required to store visualizations. When you create a collection, you become its owner, which lets you share it, transfer ownership, or delete it.
To create a collection:
-
Go to ONE Reports > Visualizations.
-
Select Create new collection.
-
Enter a name for your collection and select Create.
| You can also create a collection while creating a visualization by selecting New collection instead of Existing collection. |
Create a visualization
-
Go to ONE Reports > Visualizations and select Create visualization.
Alternatively, in ONE, select a catalog item from a supported source and use the three dots menu to select Create Data Visualization.
To open an existing visualization, select the relevant card on the Your visualizations screen.
To duplicate an existing visualization, select the three dots menu next to the visualization and choose Duplicate.
-
In New visualization, select where to store your visualization:
-
Existing collection: Select a collection from the dropdown.
-
New collection: Enter a name for a new collection.
-
-
Select the source catalog item or dataset from the list.
-
Select Create a new visualization.
The visualization builder opens. See Build a Visualization to learn how to configure your visualization.
Visualization builder overview
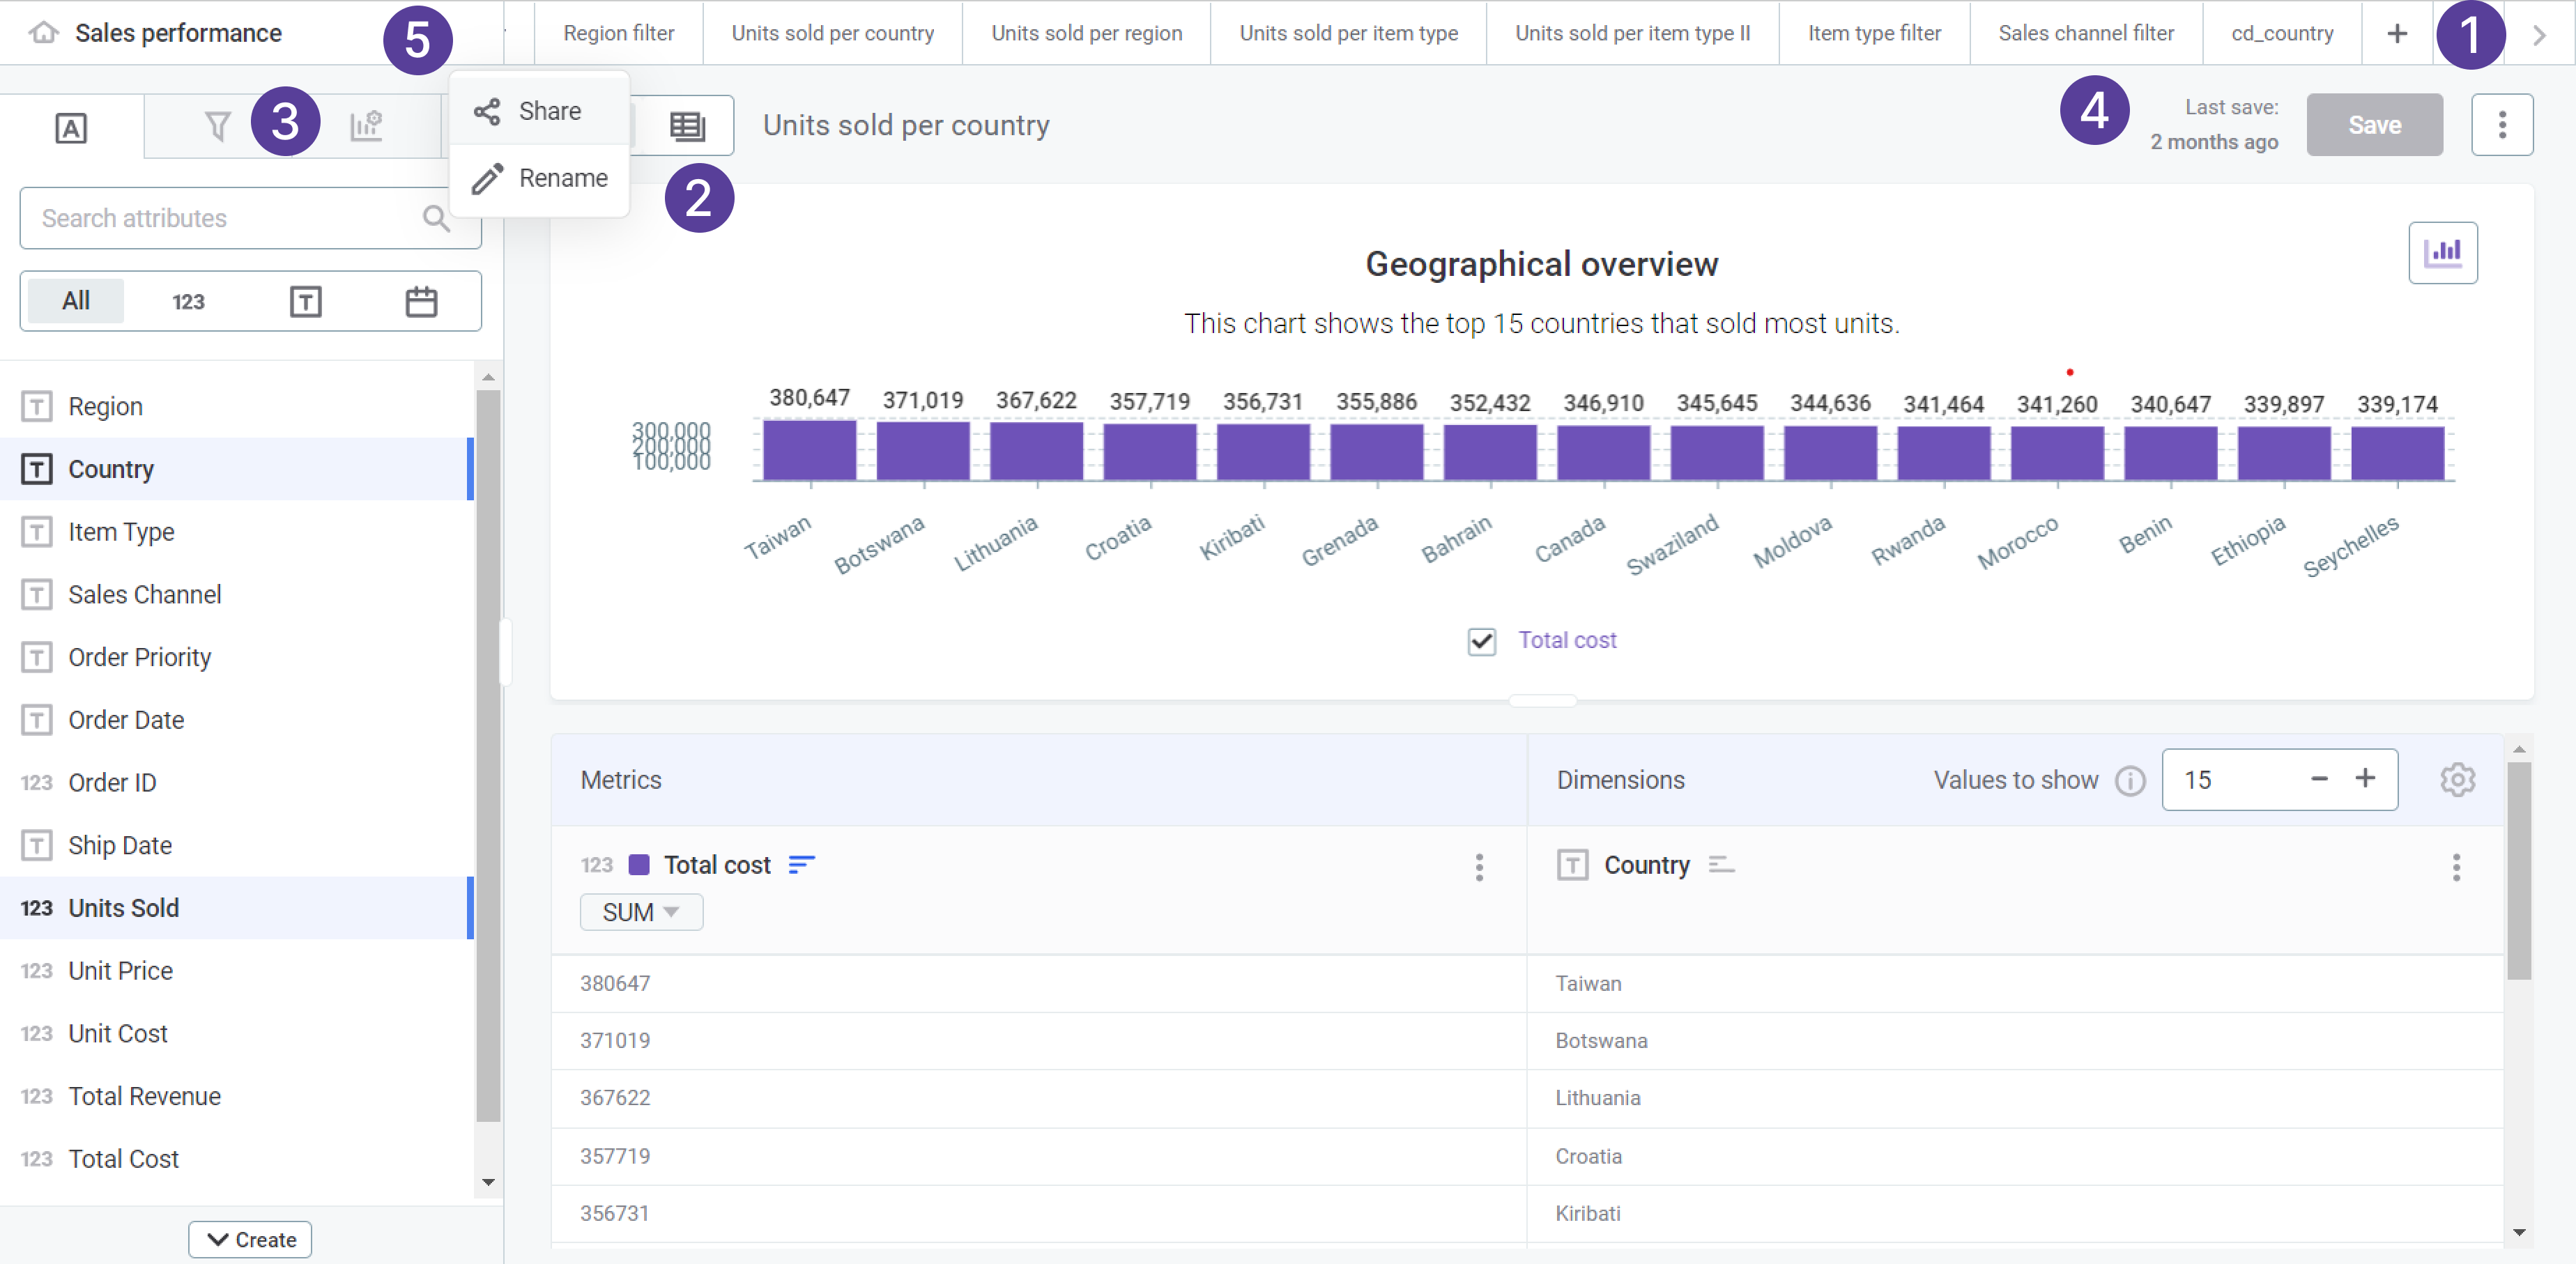
The visualization builder includes:
-
Tabs ribbon: Create, manage, or remove tabs. Tabs let you create multiple visualizations within the same collection. Select the Home tab to see all visualizations in the collection as cards.
-
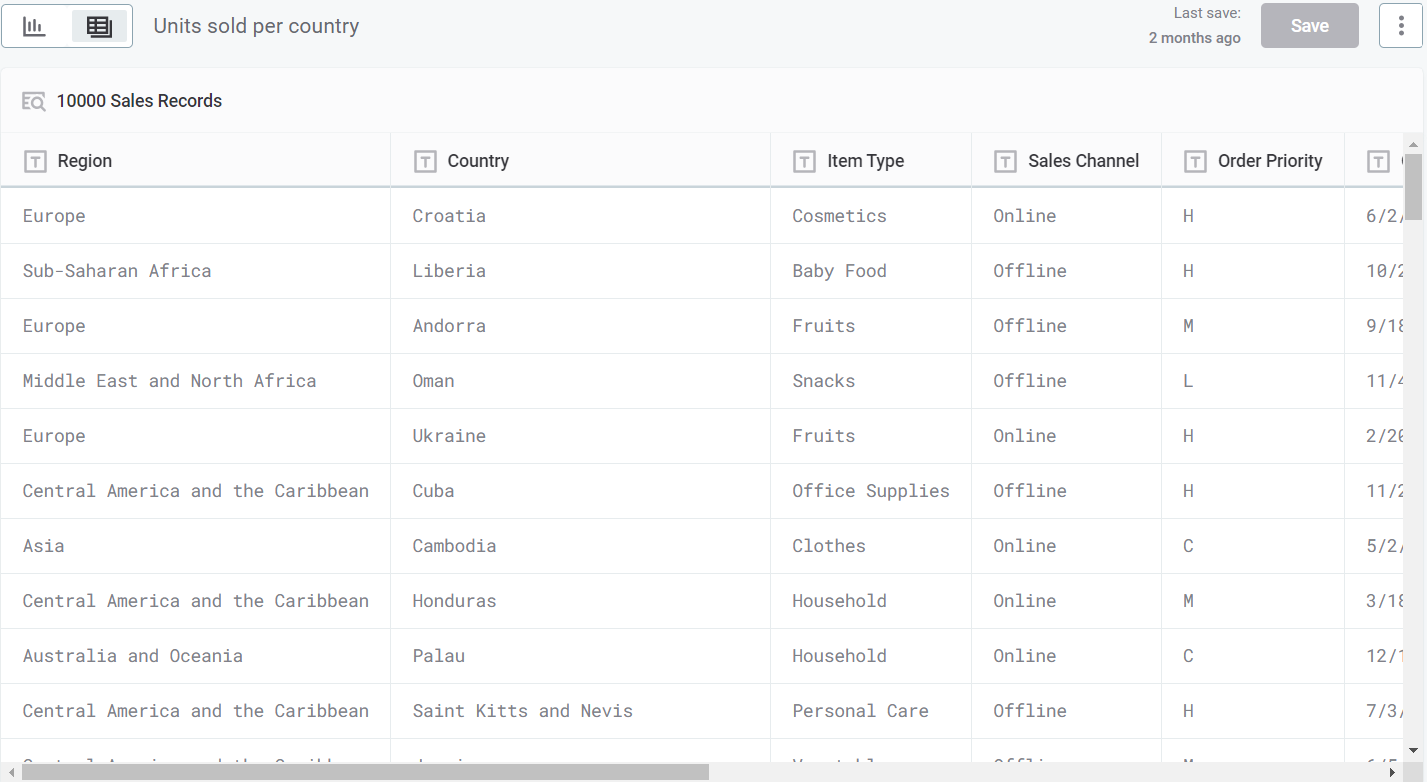
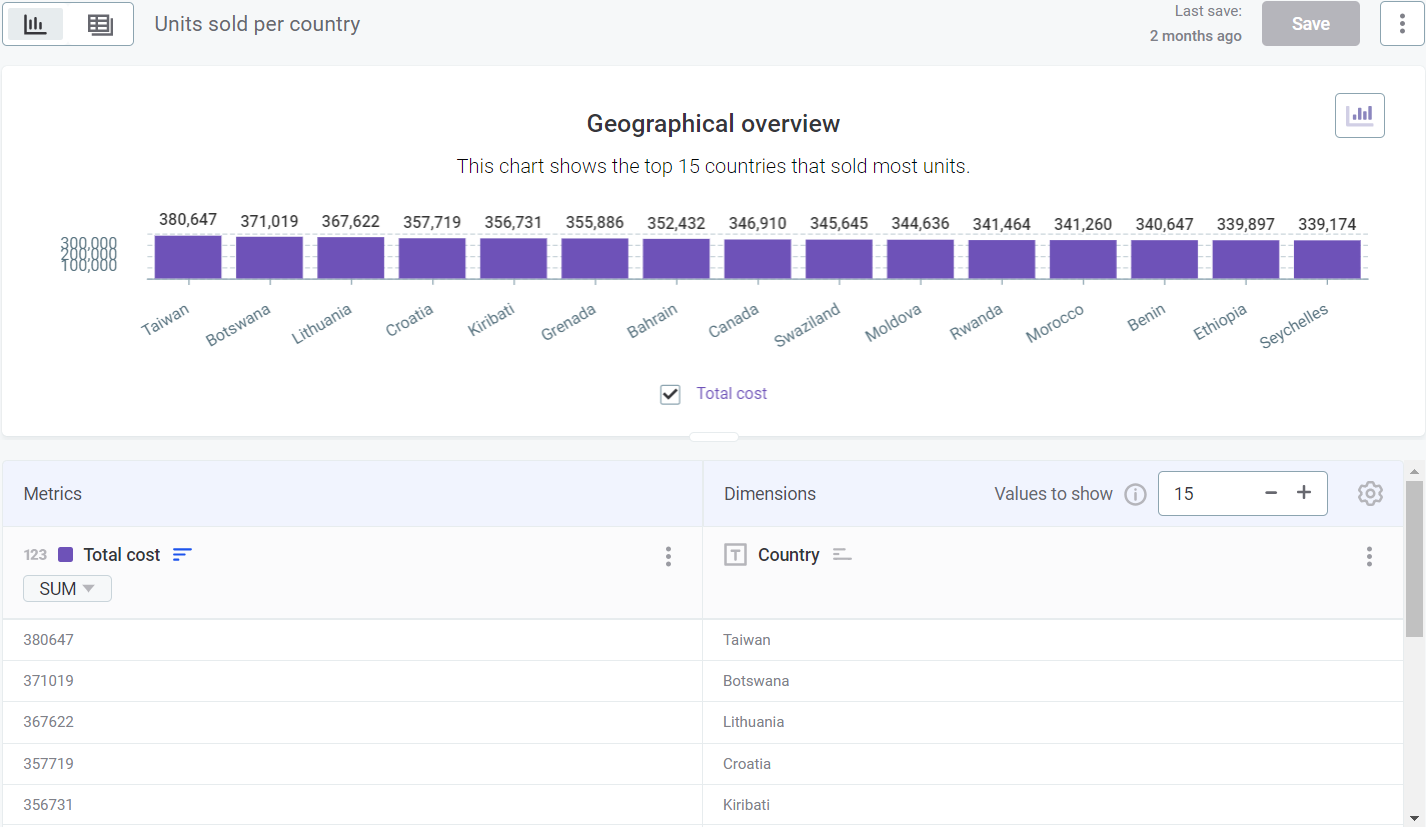
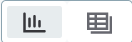
Data and Visualization toggle: Switch between Data view (browse raw data) and Visualization view (build your chart).
-
Left-side menu:
-
Attributes: Search and select attributes, or create custom attributes.
-
Filters: Create filters for your visualization.
-
Visualization properties: Customize the look and feel of your chart.
-
Pinned values: Save favorite values and create formulas.
-
-
Save: Save your visualization. The last saved timestamp appears to the left.
-
Share: Share your collection with other users or groups.
Work with tabs
Tabs let you create multiple visualizations at once in the same collection, based on the same or different catalog items.
To add a new visualization tab:
-
Select the plus icon in the tabs ribbon.
-
Choose the dataset or catalog item to explore.
| Saving one tab does not automatically save others. Navigate to each tab and save changes separately. |
| Drag tabs to rearrange their order in the navigation bar. |
Copy a visualization
To copy a visualization to a different collection:
-
Go to ONE Reports > Visualizations.
-
Locate the visualization and select the three dots menu.
-
Select Copy.
-
Choose the destination collection and select Copy.
Delete a visualization
| Deleted visualizations cannot be restored. |
-
Go to ONE Reports > Visualizations.
-
Locate the visualization and select the three dots menu.
-
Select Delete and confirm your choice.
Share a collection
As the collection owner, you can share it with other users or groups. Sharing a collection grants access to all visualizations it contains.
-
Go to ONE Reports > Visualizations.
-
Locate the collection and select the three dots menu.
-
Select Share with.
-
Select the users or groups to share with.
-
Set the access level for each:
-
View access: Users can view the collection and use its visualizations in reports.
-
Edit access: Users can edit the collection and its visualizations.
-
Remove access: Revokes access for the user or group.
-
-
Select Done.
| For users to view a report, they need at least View access to the report, the underlying catalog item or data quality results, and the collection containing the visualizations. |
Rename a collection
Owners or editors can rename a collection:
-
Go to ONE Reports > Visualizations.
-
Locate the collection and select the three dots menu.
-
Select Rename.
-
Enter the new name and select Rename.
Change collection ownership
| Only the current owner can change ownership. This action is irreversible unless the new owner transfers it back. |
-
Go to ONE Reports > Visualizations.
-
Locate the collection and select the three dots menu.
-
Select Change ownership.
-
Select the new owner (user or group).
-
Select Done.
Delete a collection
| Deleting a collection permanently removes all its visualizations and affects any reports using them. This action cannot be undone. |
-
Go to ONE Reports > Visualizations.
-
Locate the collection and select the three dots menu.
-
Select Delete.
-
Review the list of affected reports and confirm your choice.
Was this page useful?