
Data Protection in ONE Reports
Data protection classification gives you granular control over data access at the attribute level: attributes marked as protected remain secure and cannot be accessed by unauthorized users. This way, you can hide sensitive data, such as personally identifiable information (PII), and ensure data integrity across ONE.
Data protection classification uses visual indicators (lock icons) and notifications to signal access restrictions.
This article describes how data protection classification affects data display in ONE Reports components, including visualizations, filters, dashboards, and stories. For general information about this functionality, see Data Protection Classification.
How data protection works in visualizations
When data protection classification is applied in ONE Reports:
- Creating and viewing visualizations
-
-
Protected attributes are marked with a lock icon.
-
Users without access cannot use protected attributes when exploring data or building charts.
-
If a visualization includes protected data, unauthorized users see an error message and the visualization is not rendered.
-
- Sharing reports
-
-
Thumbnails for reports containing protected attributes are hidden for unauthorized users.
-
Only authorized users can view parts of a report that contain protected data.
-
Visualizations
-
A lock icon appears next to the visualization name to indicate the presence of protected attributes.
-
If you don’t have the necessary access permissions:
-
The thumbnail for visualizations containing protected attributes is hidden.
-
Error messages specify whether the issue is due to insufficient permissions or protected attributes.
-
| For more information about visualizations, see Manage Visualizations and Collections. |
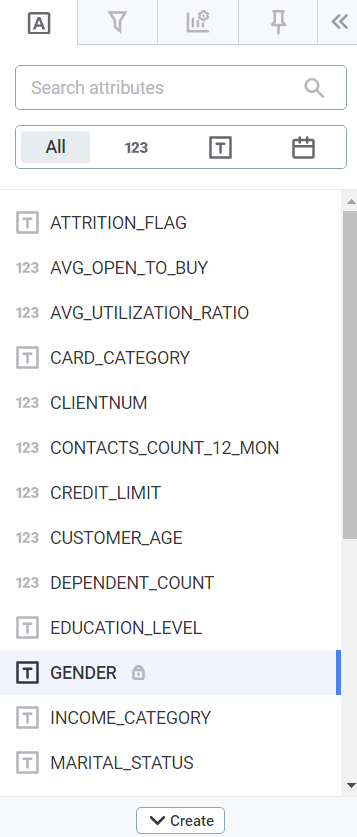
Metrics and Dimensions dropzone
-
Every protected metric or dimension has a lock icon.
-
If you don’t have the necessary access permissions:
-
Data with protected attributes is not shown in the visualization area.
-
You cannot drag and drop protected attributes into the metric or dimension areas.
-
| For more information about the visualization builder, see Build a Visualization. |
Visualization filters
-
Notifications and lock icons are displayed for filters that include protected attributes.
-
If you have the necessary access permissions, you can use protected attributes for filters without limitations.
-
If you don’t have the necessary access permissions:
-
You cannot see the filter configuration if a visualization has a filter with a protected attribute.
-
You can remove filters configured with protected attributes but cannot configure them.
-
| For more information about visualization filters, see Filter Visualization Data. |
Reports
-
On the Reports tab, if you don’t have the required access permissions and a report contains a protected attribute in any visualization, the thumbnail for that report is hidden.
Dashboards
-
Visualizations that contain protected attributes are indicated with a lock icon in the collection list (left panel).
-
If you don’t have the necessary access permissions, you can drag and drop visualizations with protected attributes into the grid, but the visualization shows an error message instead of data.
| For more information about dashboards, see Create a Dashboard. |
Stories
-
Visualizations that contain protected attributes are indicated with a lock icon in the collection list (left panel).
-
If you don’t have the necessary access permissions:
-
If a slide contains any visualization with protected attributes, the thumbnail for that slide is hidden and replaced with a lock icon placeholder.
-
You can drag and drop visualizations with protected attributes into slides, but the visualization shows an error message instead of data.
-
| For more information about stories, see Create a Story. |
Global filters
Global filters function the same as visualization filters. If you don’t have the necessary access permissions and a protected attribute is selected, a lock icon is displayed and an error message appears when attempting to use the filter.
| For more information about global filters, see Create a Dashboard and Create a Story. |
Was this page useful?