
Glossary
- Collection
-
A folder-like container for organizing related visualizations. Collections can be shared with other users or groups, and ownership can be transferred.
- Dashboard
-
An interactive canvas for presenting multiple visualizations together. Dashboards provide a flexible layout with a fully configurable grid. You can cross-filter all widgets that share a common data source across the entire canvas.
- Data quality dashboard
-
A report in Data Quality > Dashboards that displays data quality evaluation results. Data quality dashboards use a template to define their layout. See DQ dashboard template.
- DQ dashboard template
-
A dashboard template that defines the layout for all data quality dashboards. Templates are managed in Global settings > DQ settings > DQ dashboard templates and built using ONE Reports features. When you view a report in Data Quality > Dashboards, the results are displayed using the DQ dashboard template layout. Changes to this template affect all data quality dashboards.
- Story
-
A slide-based presentation format for data visualization. Stories allow you to present a specific narrative through sequential slides, each with its own grid canvas. Use them to explain topics in an intuitive and visually attractive way using charts, text, and media.
- Visualization
-
A chart, graph, or table that displays data from a dataset or catalog item. Visualizations help you understand data at a glance and explore patterns. You can add visualizations to dashboards or stories.
- Widget
-
A static element you can add to a dashboard or story canvas. Widgets include text, images, and videos. Unlike visualizations, widgets display static content rather than data from a dataset.
- Charts
-
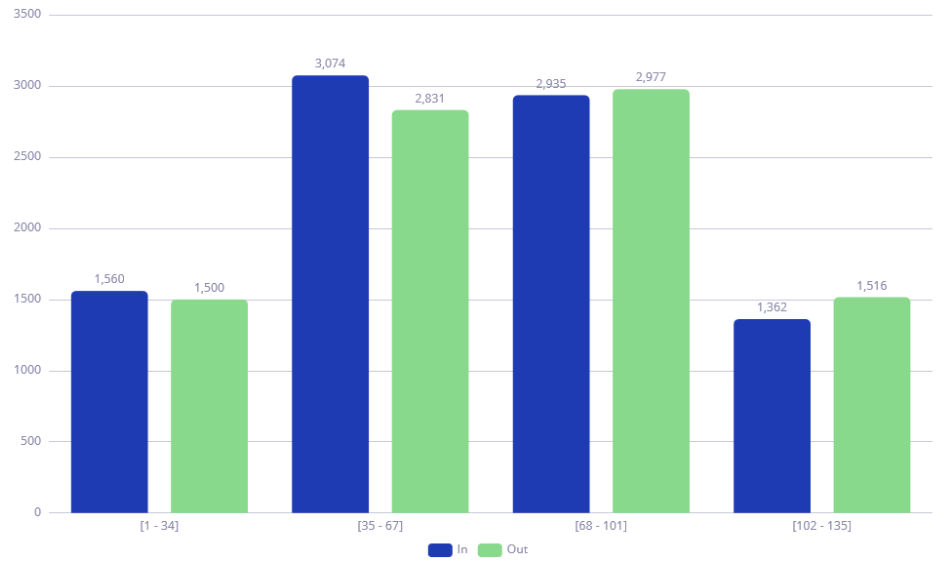
- Bar Chart, Bar Multiseries, and Category Chart
-
Charts that use bars to visualize data. Bar Chart displays metrics for a single category, Bar Multiseries adds a subcategory to the x-axis, and Category Chart displays horizontal bars with category on the y-axis.
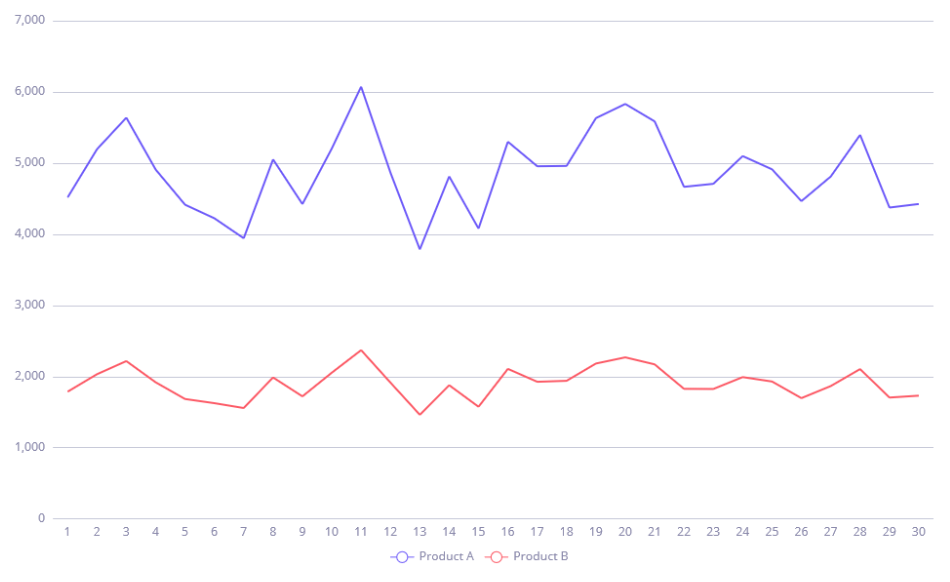
- Line Chart and Line Multiseries
-
Charts that present data as lines. Use Line Multiseries to break down a category into subcategories.
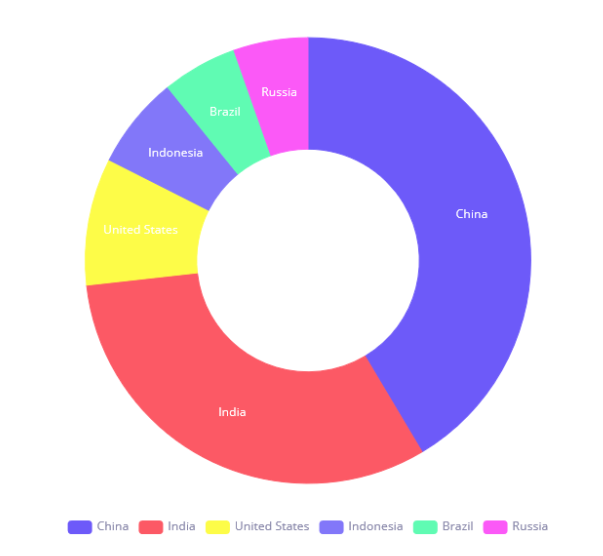
- Pie Chart and Donut Chart
-
Charts that display data as proportionate slices of a circle.
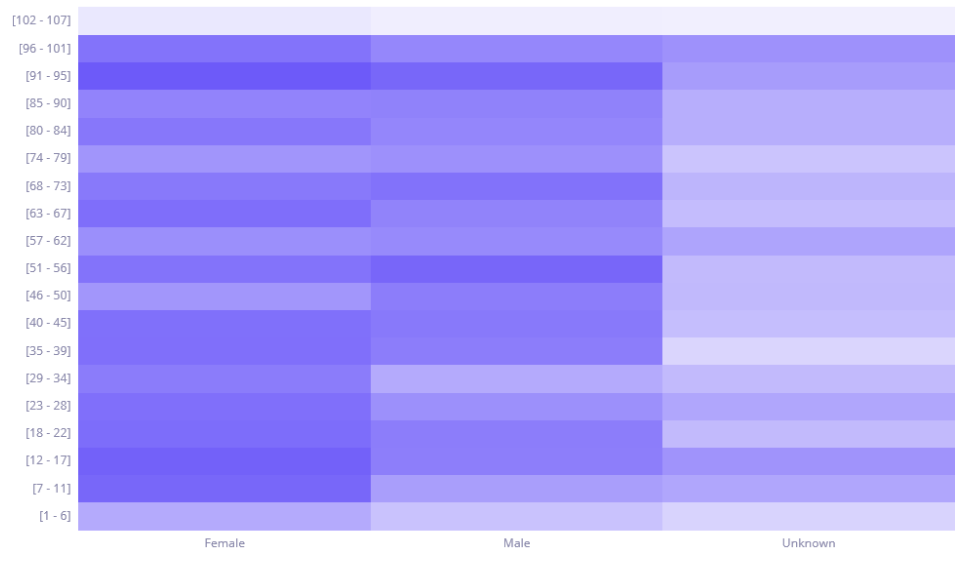
- Scatter Chart, Bubble Chart, and Heatmap Chart
-
Charts for visualizing relationships between categories. Scatter Chart shows the relationship between two categories. Bubble Chart and Heatmap Chart add a third dimension using bubble size or color intensity.
Was this page useful?