Customizing Dashboard Statistics
You can configure which entities and source systems are shown on the MDM Web App Dashboard Statistics graph.
In the Data Volume Statistics section, you can define which and how many entities are shown, while in the Number of Instances per Source System section, you can change how many source systems are displayed and how they are labeled.
-
Open the MDM project in ONE Desktop.
-
Go to GUI Configuration > Dashboard.

-
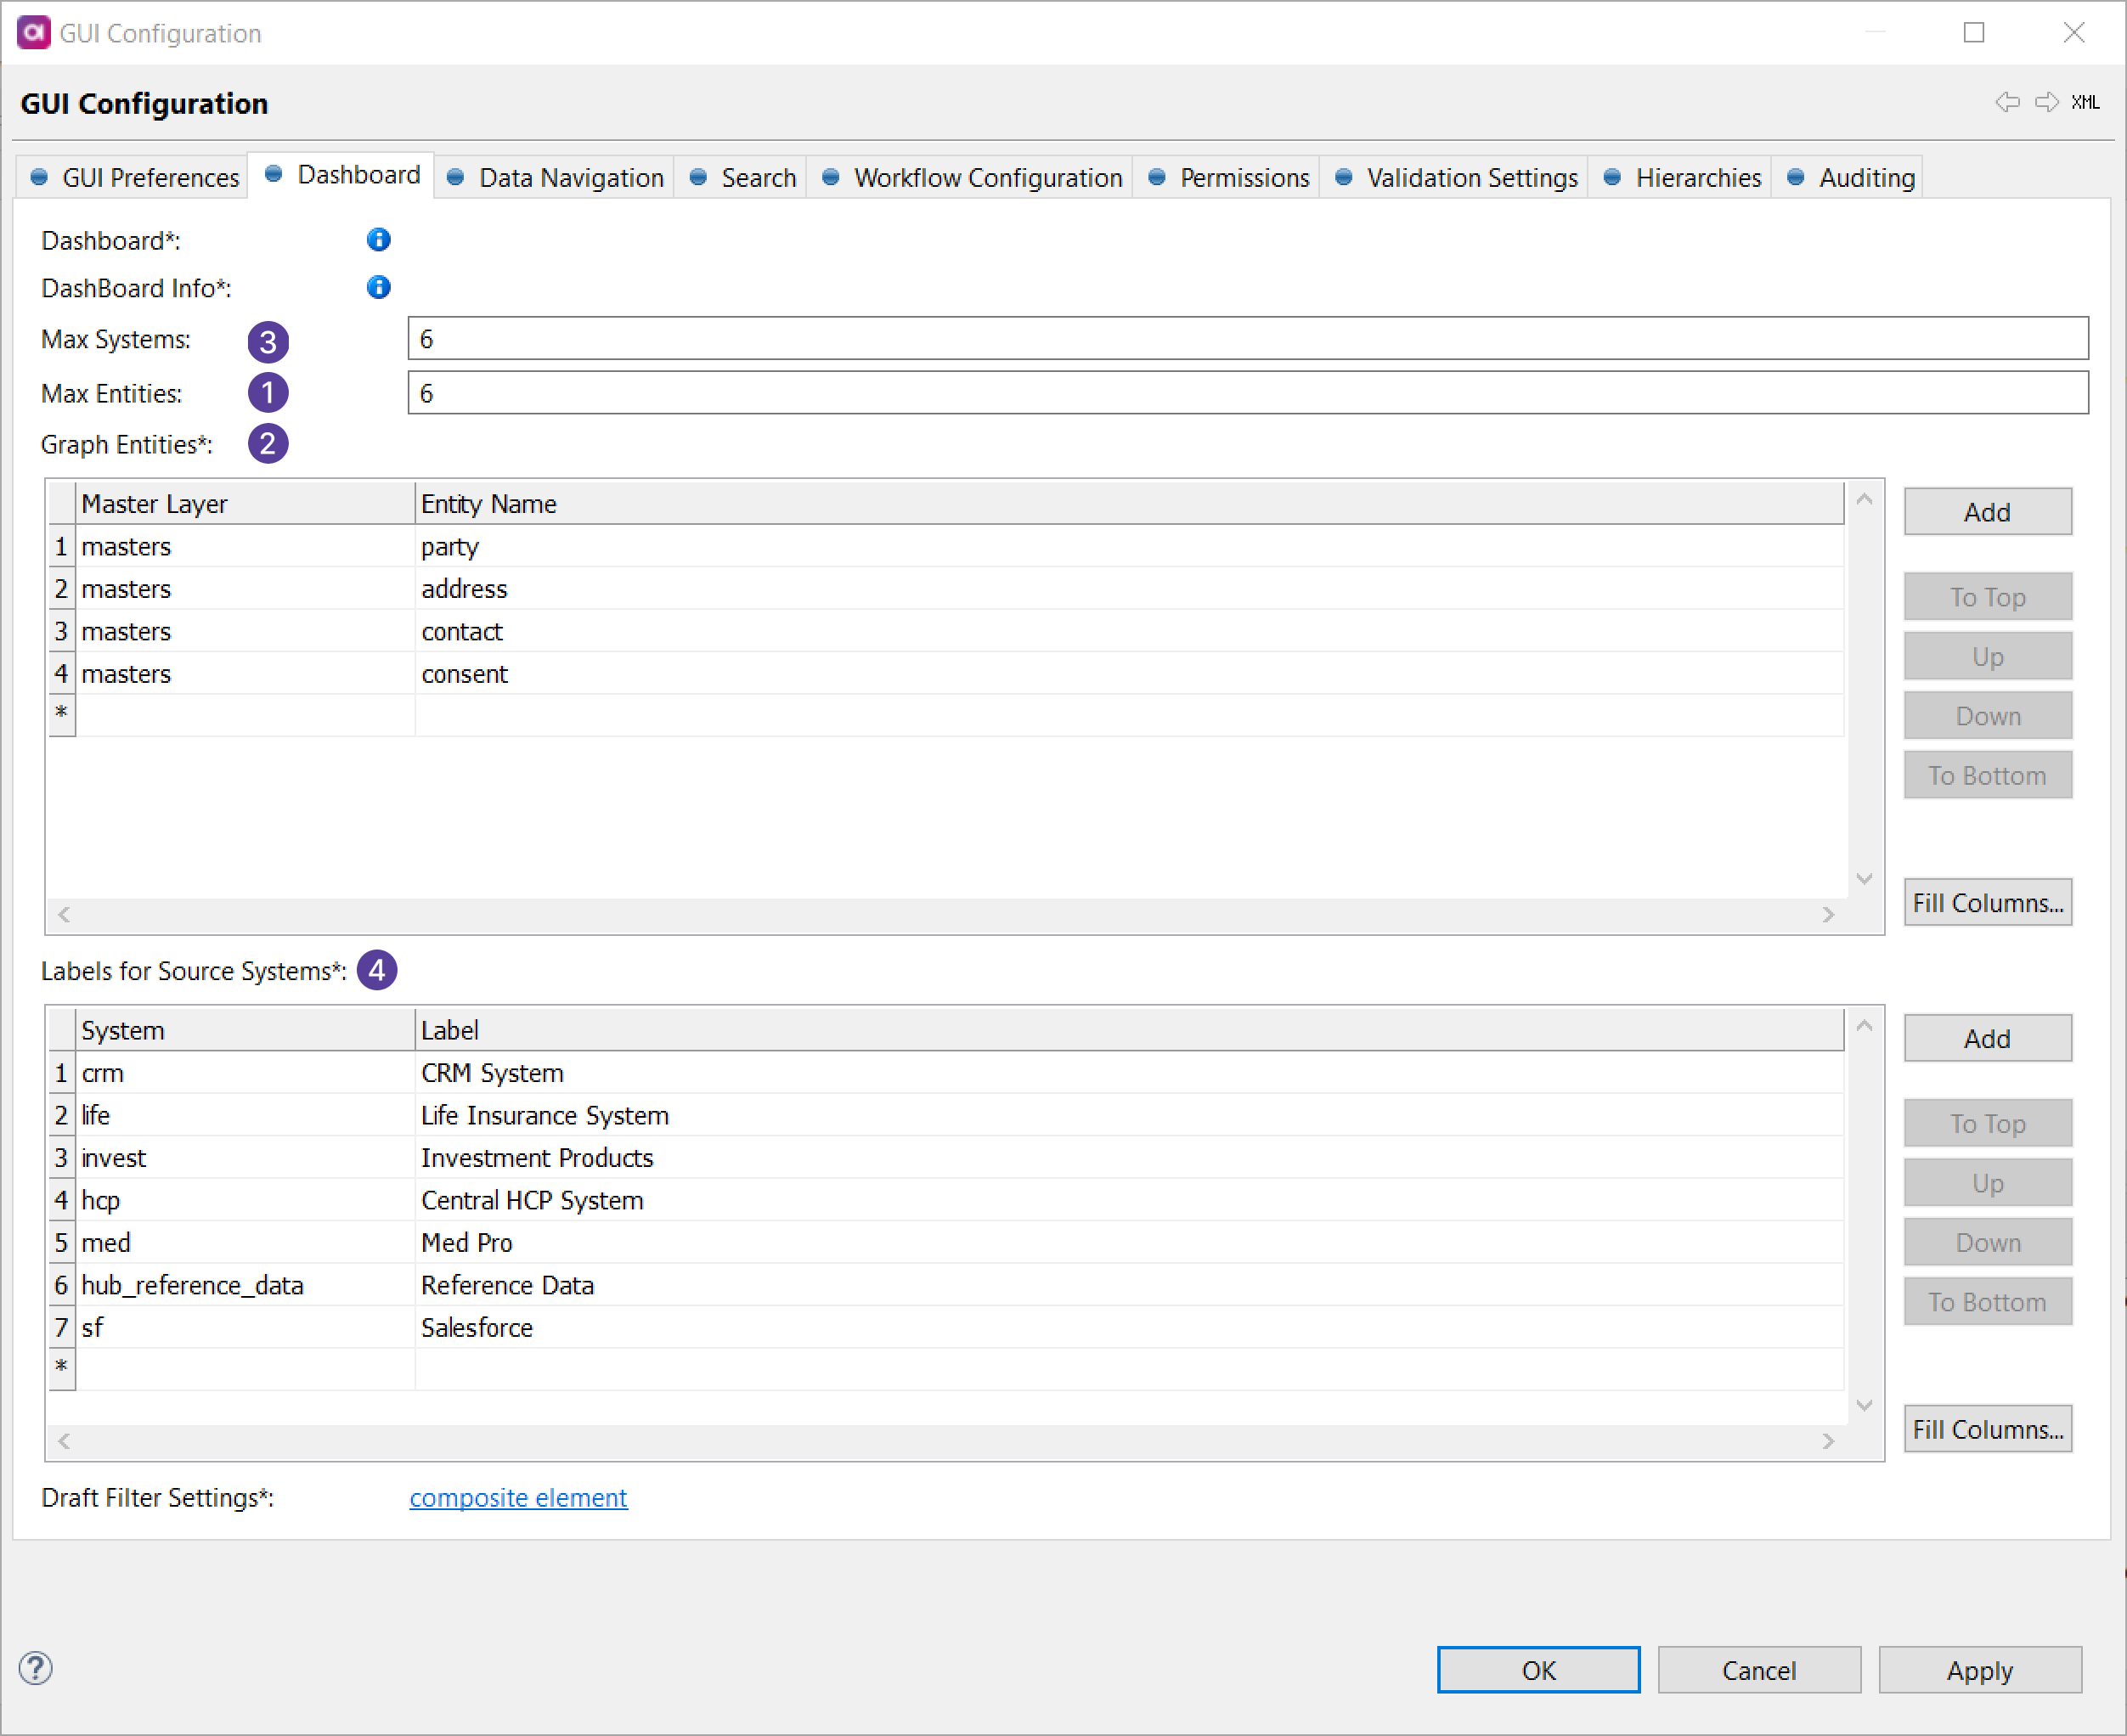
Configure entities. All entities added in Graph Entities are shown on the graph.
If no entities are listed here, entities with the highest number of master records are used instead and you can define how many of them are displayed.
-
Max Entities (1): Set how many entities with the highest number of master records are shown.
The default value is 6 and at least one entity must be shown at all times (zero is not allowed). If you add any entities in Graph Entities, then the parameter is ignored and you will see all the entities you added.
-
Graph Entities (2)
-
To select a layer, start typing in the Master Layer column (press Ctrl+Space to view suggestions).
-
Select a name in the Entity Name column (press Ctrl+Space to view suggestions).
The entities are shown on the graph in the order you have them in the table. In case there is an issue with entities (for example, insufficient permissions, empty entity, non-existing entity), they are not shown.
-
To rearrange the order in which entities appear, use To Top, Up, Down, or To Bottom on the right.
-
-
-
Configure source systems.
-
Max Systems (3): Set how many source systems are shown.
The default value is 6, zero is not allowed.
-
Labels for Source Systems (4): By default, labels are taken from the System description.
-
To change a label for a source system, start typing in the System column (press Ctrl+Space to see suggestions).
-
Write a new label in the Label column.
-
-
Was this page useful?
