
MDM Web App Admin Center
The Admin Center is an administration interface allowing you to monitor, manage, and configure server operations.
It is available at the /admin endpoint on the MDM Web App server URL.
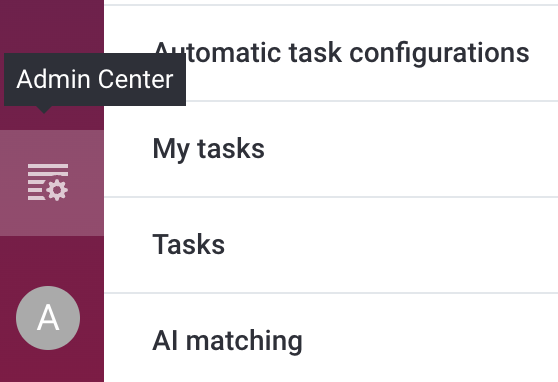
You can also access it from the MDM Web Application main navigation if you have view permissions or higher.
Access
There are several levels of access in the Admin Center:
-
No access: Users can log in but cannot view any information or make changes.
-
View-only access: Users can view available information including details about running operations and the server setup but cannot perform any actions or change settings.
-
Full access: Users can view available information including details about running operations and the server setup, perform any actions, or change any settings.
-
Manager access: Users have all the permissions of full access, and additionally can stop and start the MDM server and clone Git repositories.
|
Access permissions are configured in the MDM Server Application Properties. Note that the |
Limited access to Admin Center
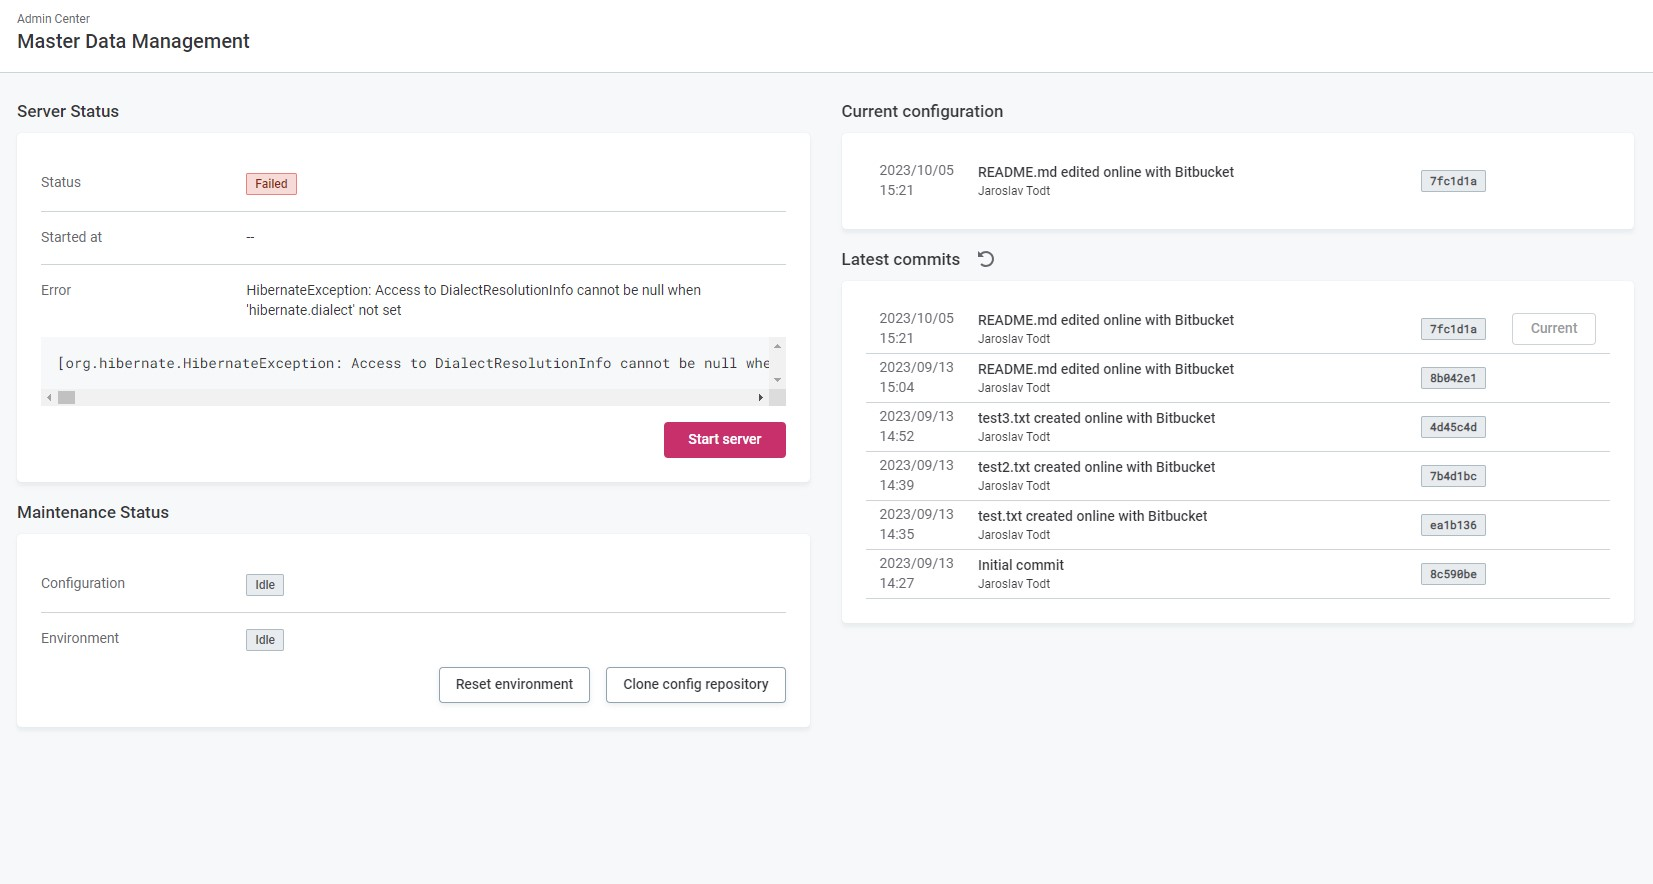
If the server fails to start due to configuration issues or missing lookup files, a limited version of the Admin Center opens, showing more information about the cause of the failure.
You can start the server or reset the environment after fixing the issue, as well as clone the configuration repository or fetch and apply the newest configuration. After this, you can start the server again.
To learn more about these actions, see MDM Web App Admin Center > Server Dashboard.
Navigation
The MDM Web App Admin Center consists of four key areas:
- Interfaces
-
View and execute batch operations, stream consumers, and event handlers, as well as view defined native services.
- Monitoring
-
Track various task and operation executions, retrieve database logs and configuration, and temporarily edit some logging settings.
- Administration
-
Retrieve performance information and edit MDM-specific runtime parameters and logging levels. This is also where the Server Dashboard is located, allowing you to monitor the server status, stop and start the server, and manage the MDM repository.
- Resources
-
View the configured Java properties and path variables.
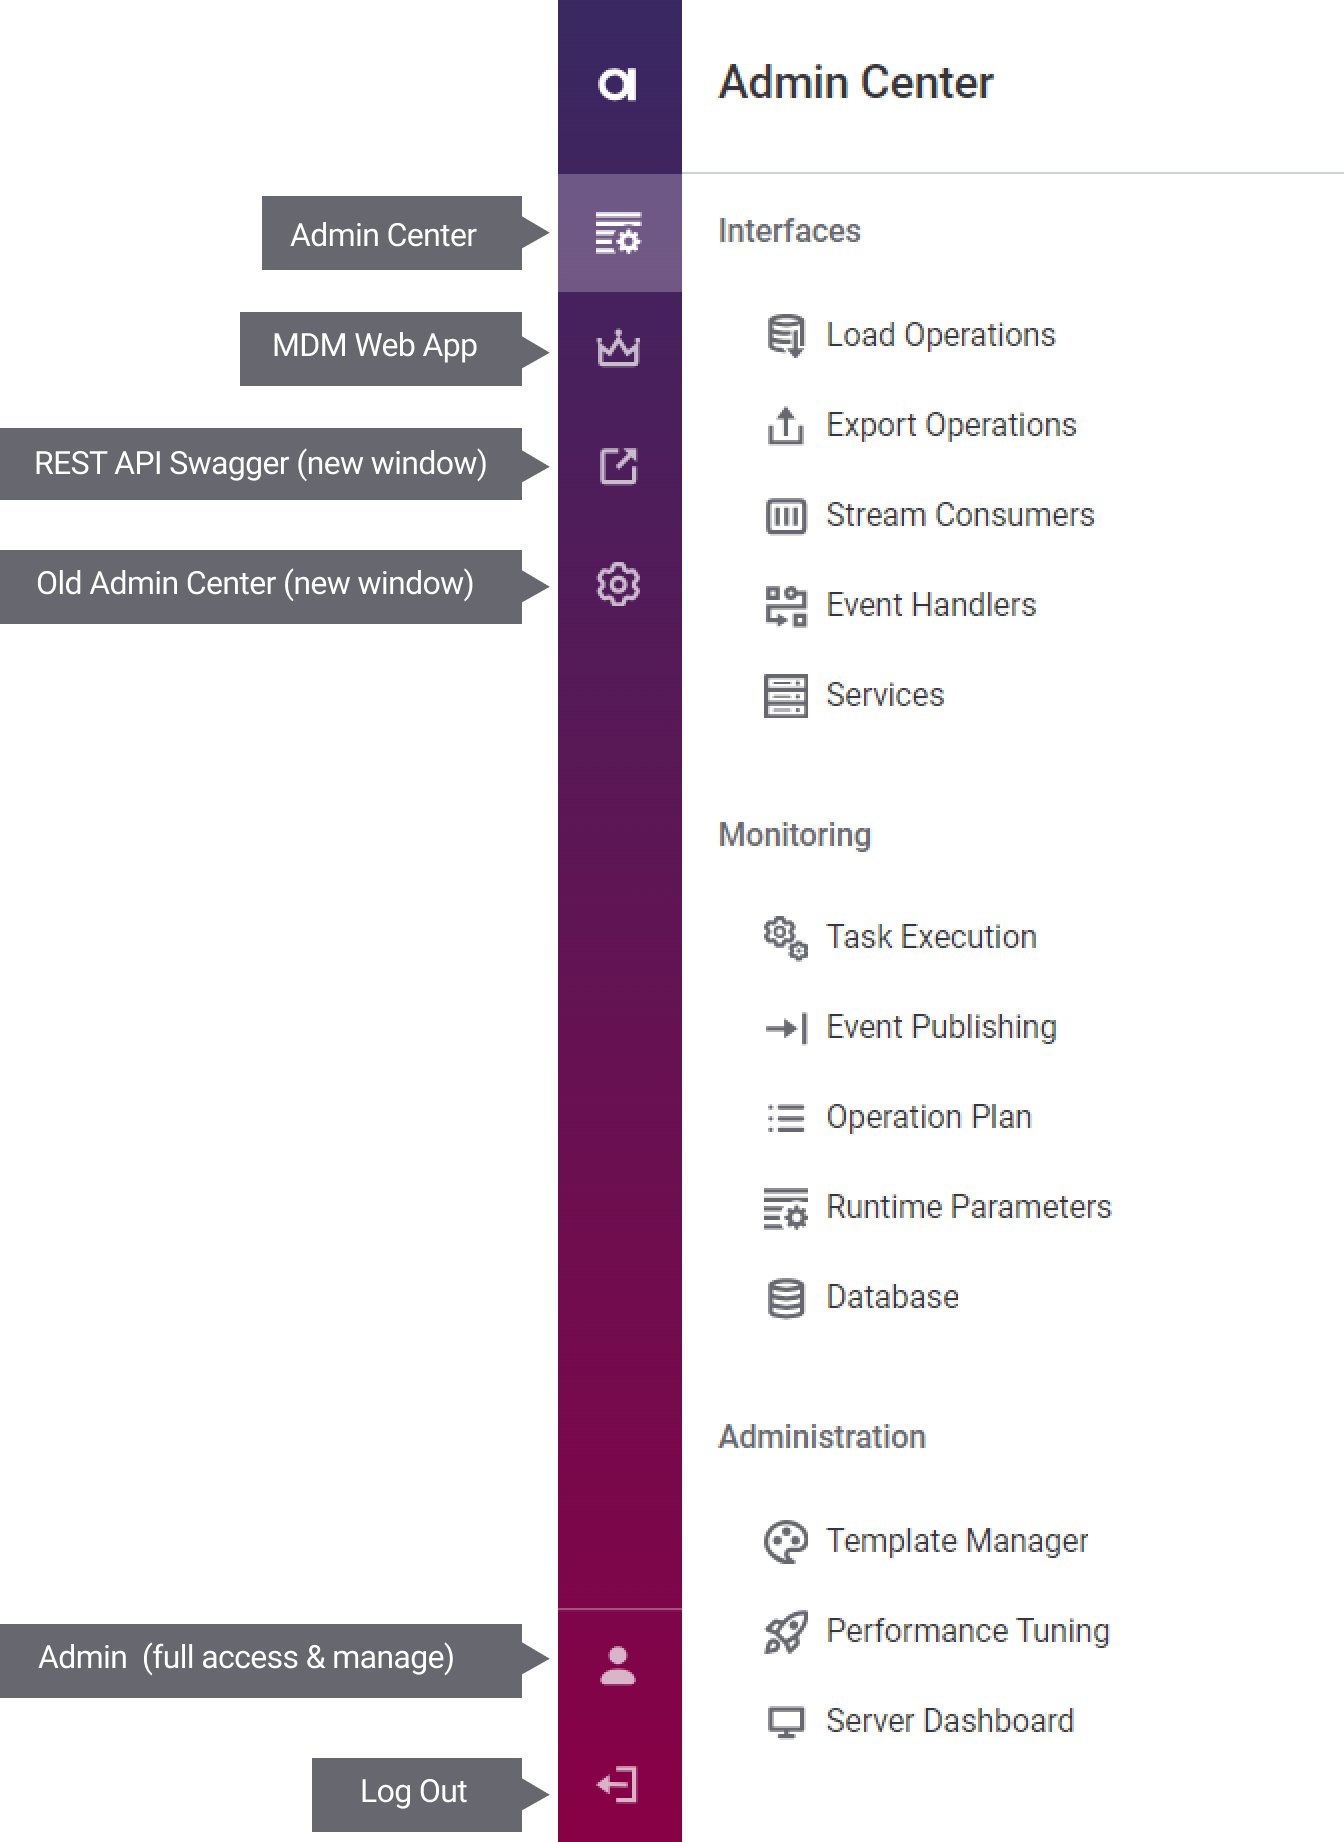
The left sidebar contains the following:
-
Links to connected systems: MDM Web App, High Availability Admin Console (if applicable), REST API Swagger.
-
The user icon showing the first and last name as well as access level of the user on hover.
-
The log out button.
Environment banner
If configured, a banner is displayed at the top of the Admin Center indicating the current environment, for example, This is a DEV environment.
This helps distinguish between environments such as development, testing, and production.
The banner text and color are configured in MDM Web App Application Properties.
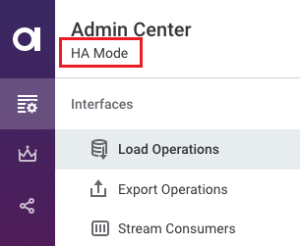
Server status indicators
The navigation panel can display one of the following statuses:
-
HA Mode: MDM is running in high availability mode.
-
HA Mode (Read-Only): MDM is running in high availability mode and the Admin Center has been accessed in a read-only node. You should be redirected to the read-write node automatically.
-
Server in Read-Only Mode: The server is running in read-only maintenance mode.
If none of these are displayed, the server is running in the default, read-write and single-node mode.
Tips
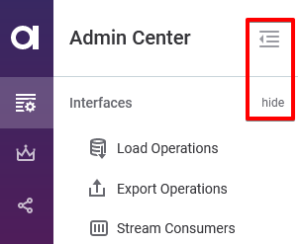
Hide the main navigation to expand the working area by pressing F or by clicking the icon in the header. To collapse a specific section in the navigation, select Hide next to the section name.
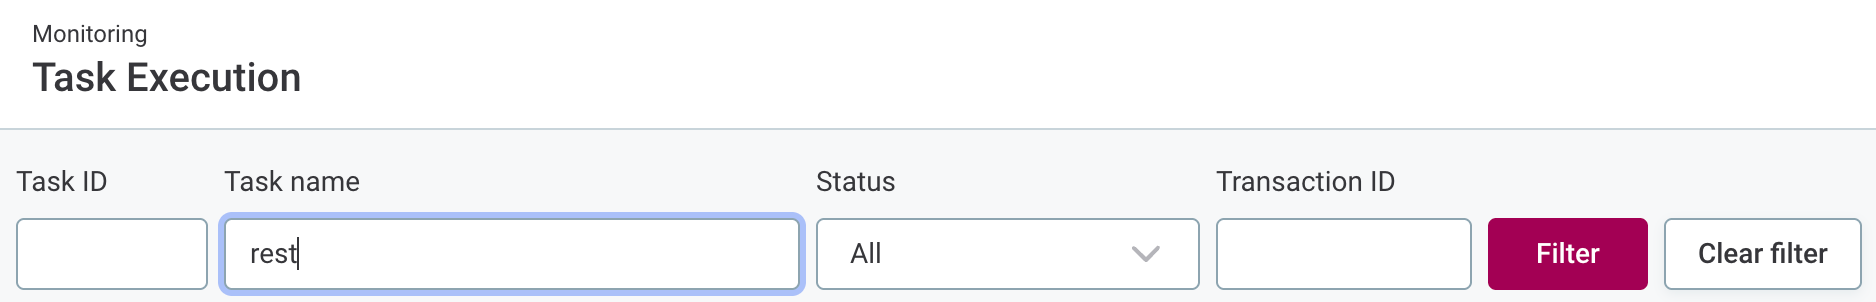
To filter, type three or more characters into the filter input field and press Enter or click Filter. To cancel filtering, select Clear filter.
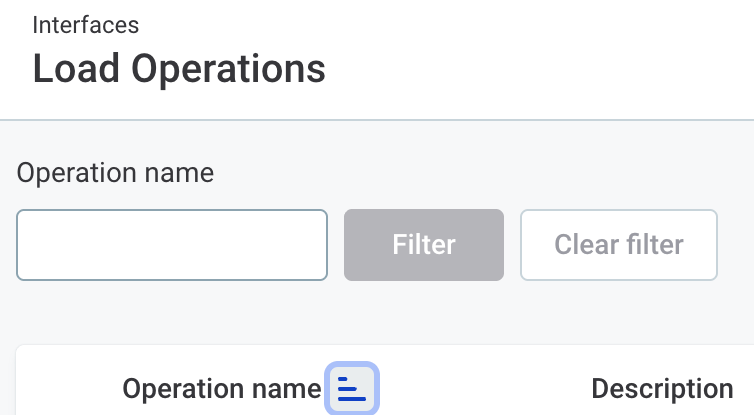
On screens where sorting is available, use the icon next to the column name to switch between ascending and descending sorting.
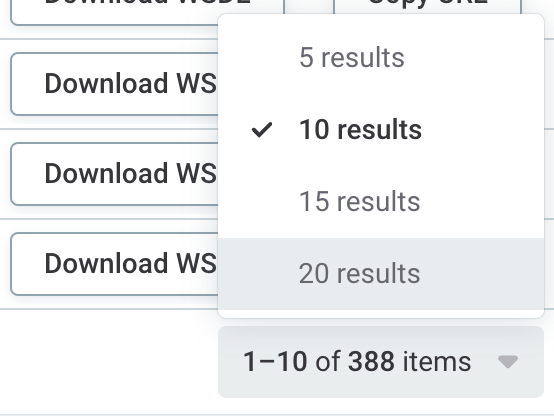
When the number of items shown exceeds the page size, you can customize the page size using the menu in the lower-right corner of the page.
Was this page useful?