
Administration
From the Administration section in the MDM Web App Admin Center, you can:
-
Upload performance configuration and retrieve performance statistics.
-
View and edit MDM-specific runtime parameters.
-
Update logging levels for easier troubleshooting.
-
View the server status and latest configuration, stop and start the server, and manage the MDM repository.
Orchestration
| All actions on the Orchestration screen are displayed regardless of user permissions. If you don’t have the required permissions, clicking an action has no effect. |
For more information about the embedded Runtime Server, including details about the available components and configuration specifics, see Server Setup.
Resources
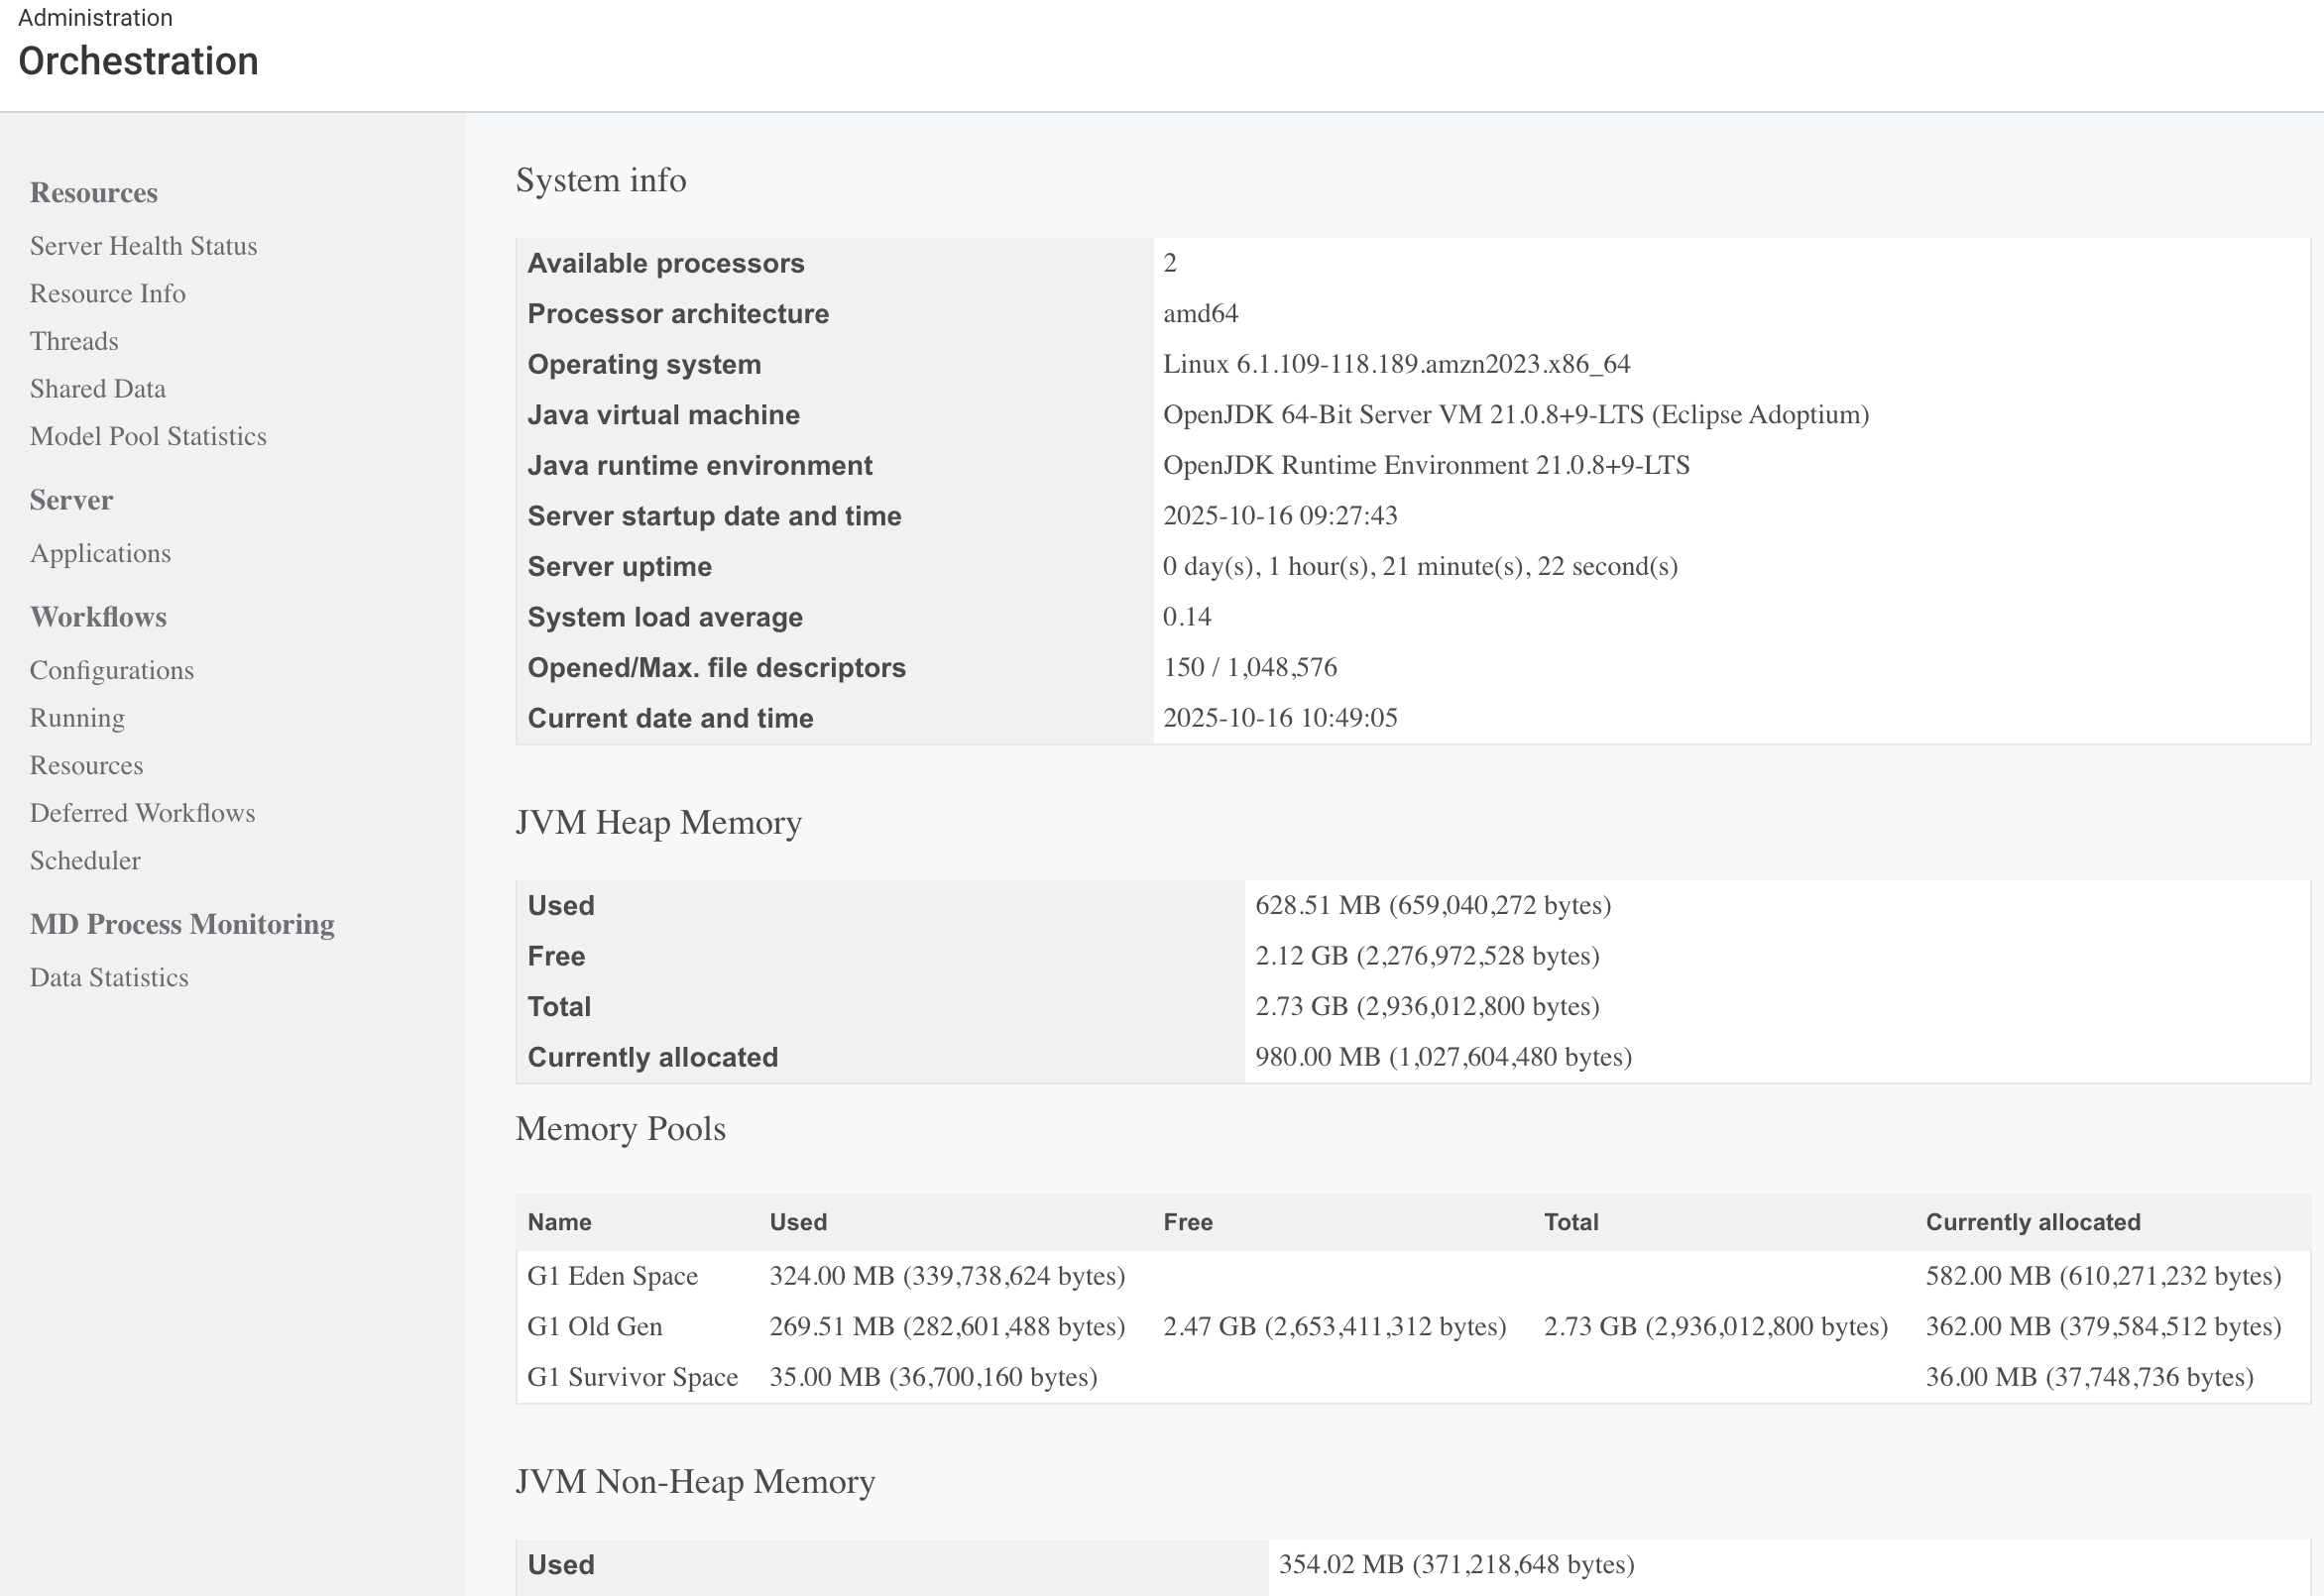
The Resources section displays information about the system, used resources, general health status of the server and its components.
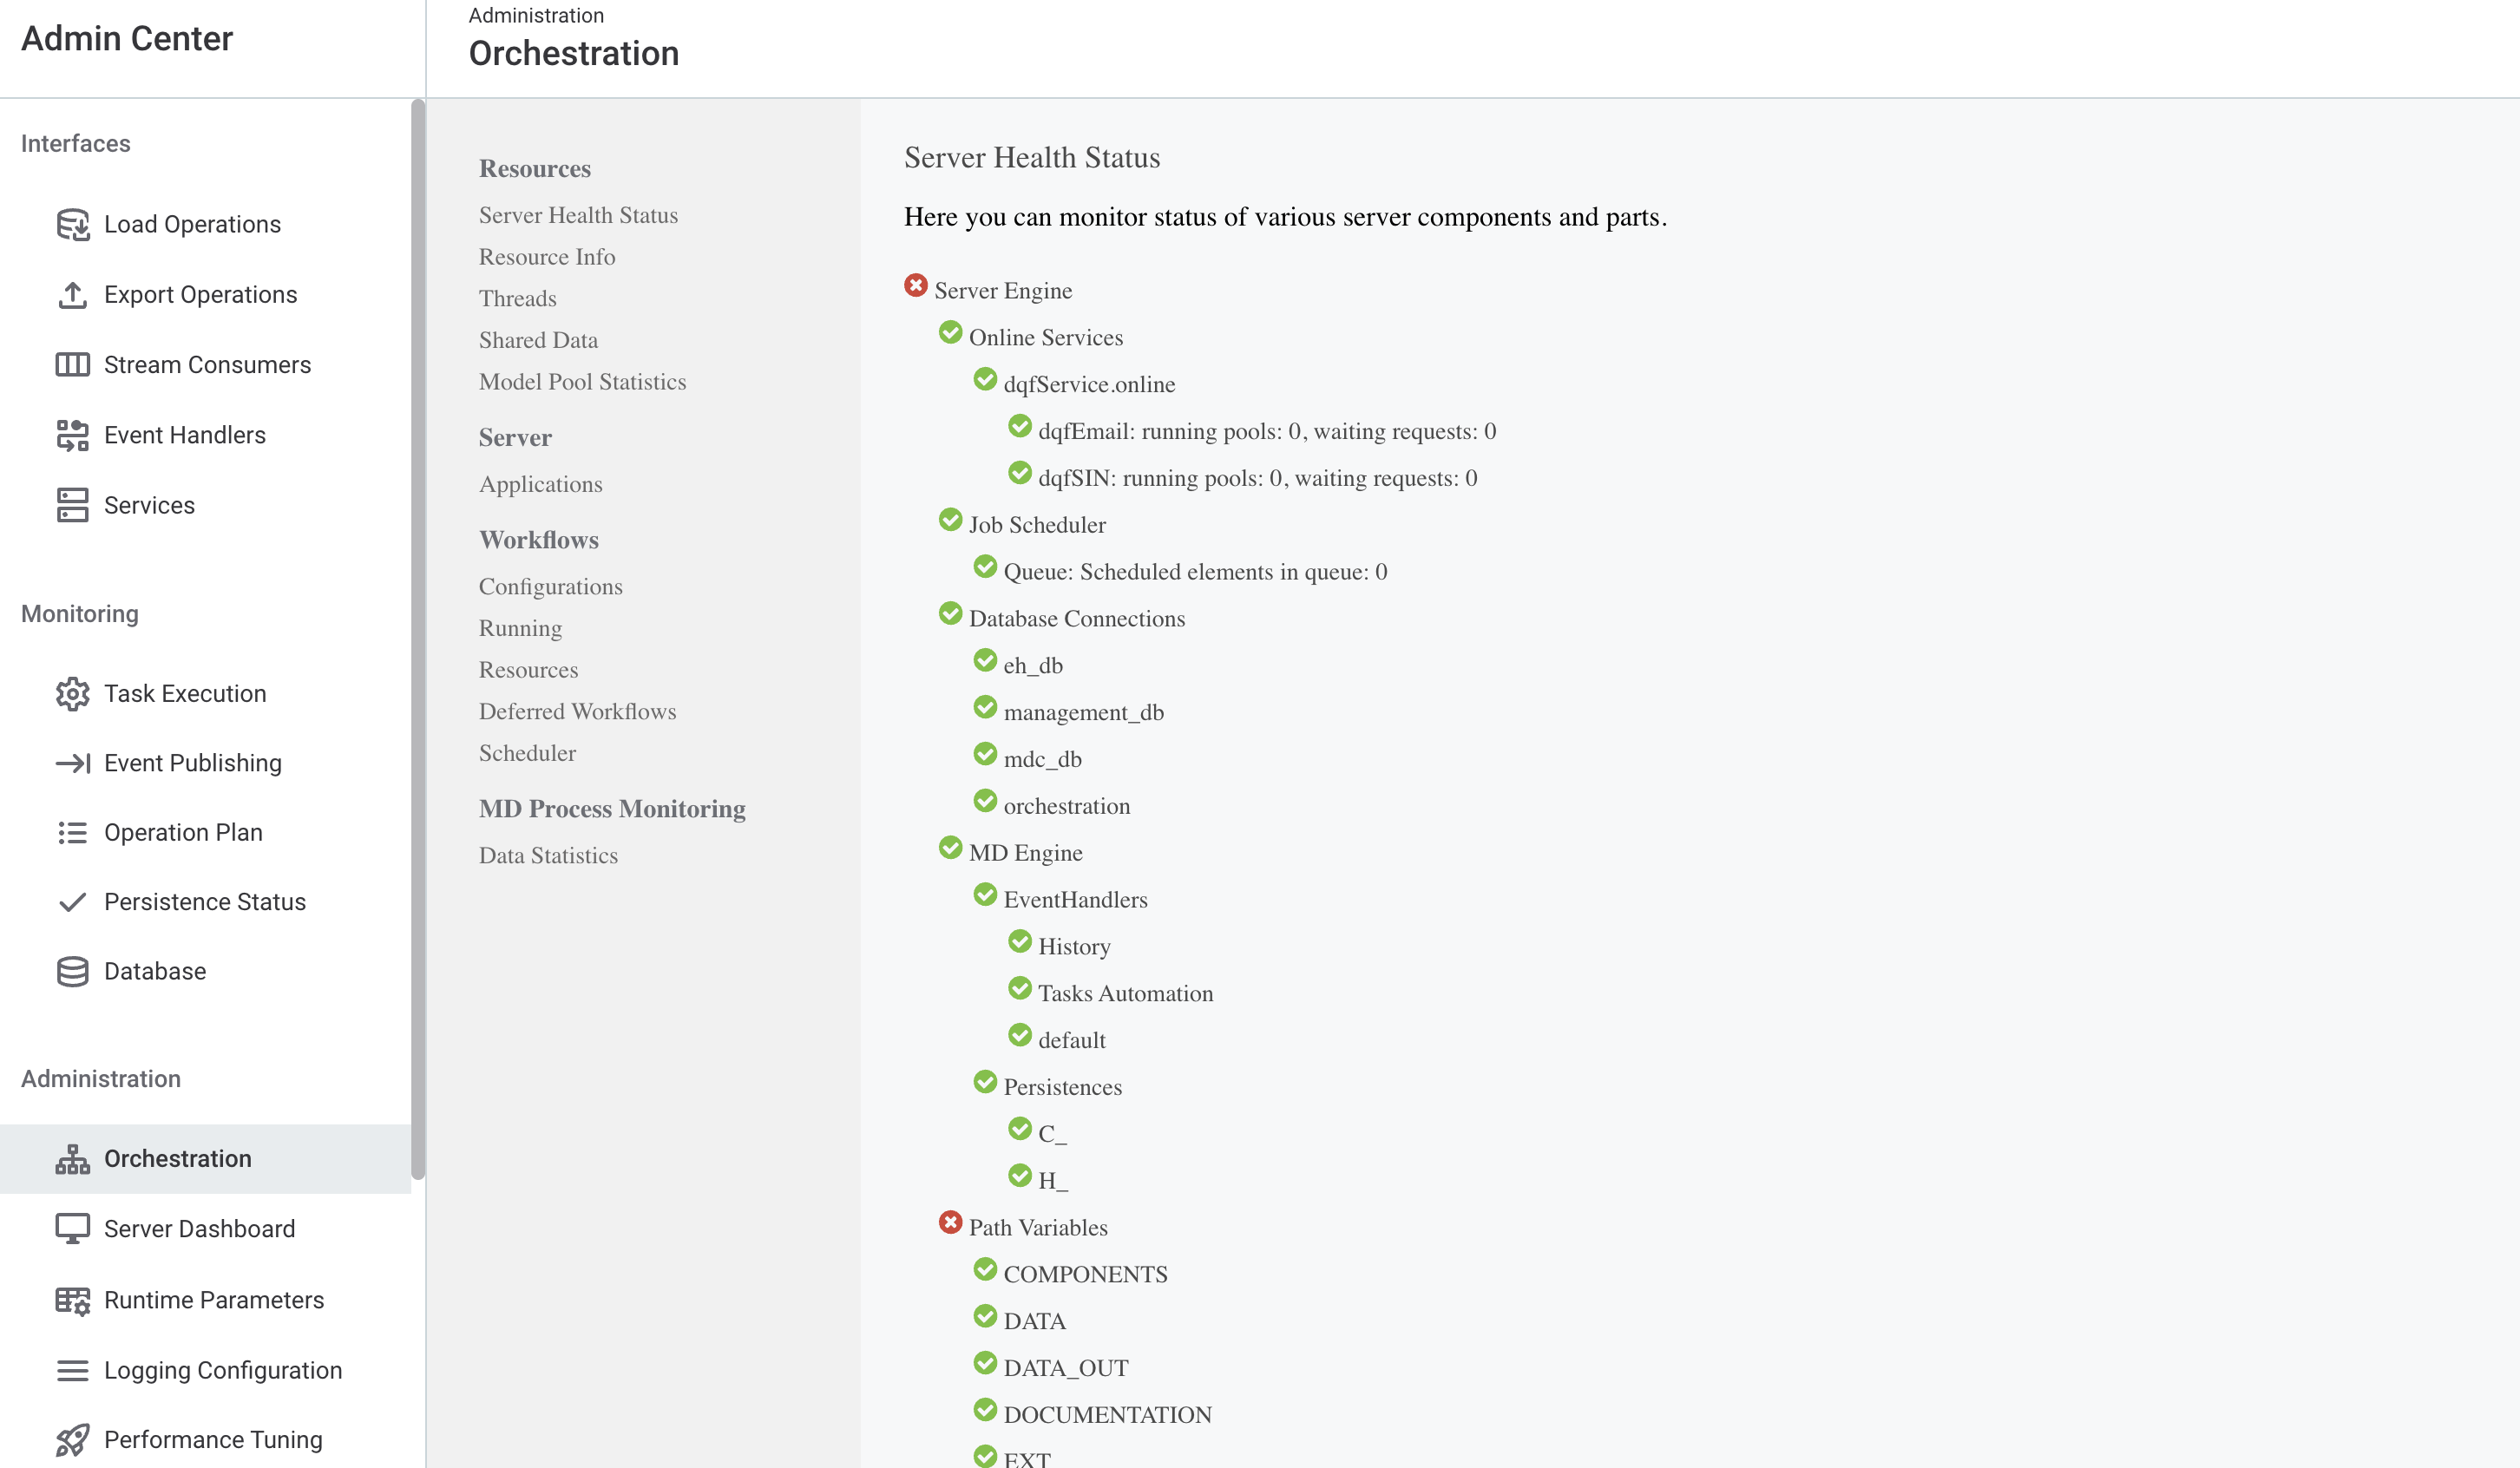
Server Health Status
Provides an overview of the state of the server and its components, such as database connections, scheduler, and more.
To control what’s displayed on this tab, customize the Health State Monitor component.
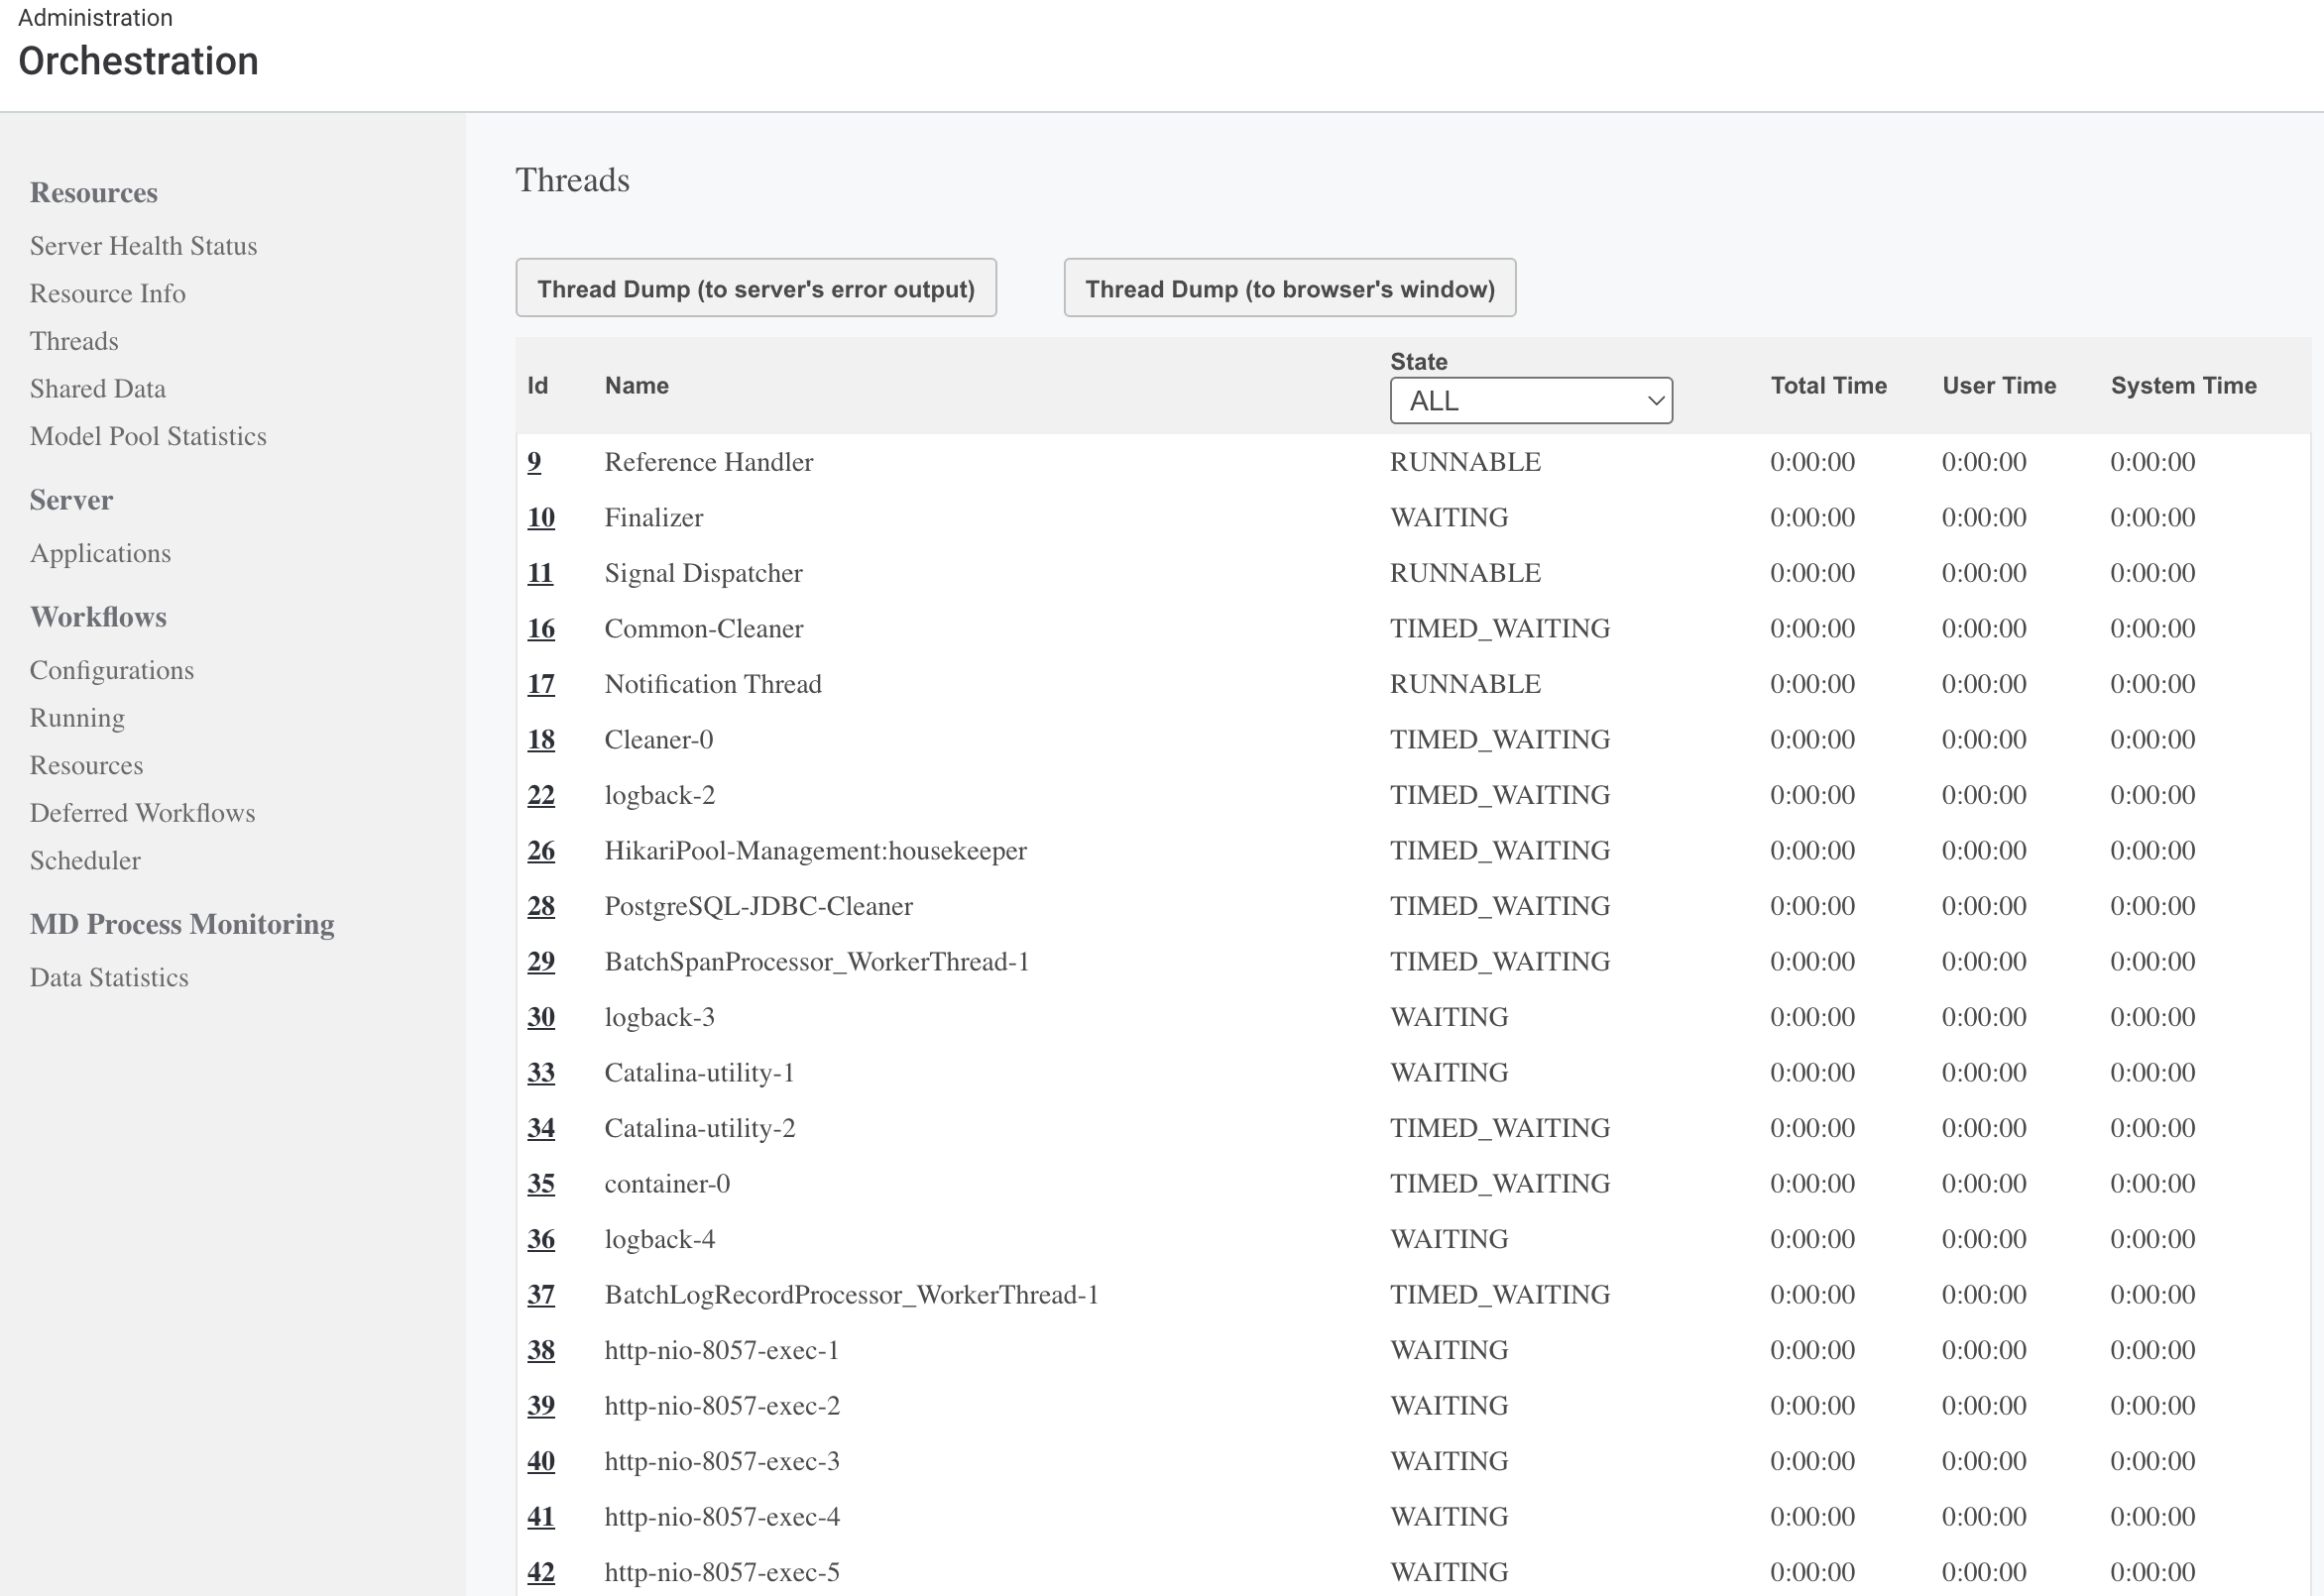
Threads
Provides information about the threads, their state and time used.
The two options (Thread Dump (to server’s error output) and Thread Dump (to browser’s window)) let you create a dump with detailed information about the threads either to the standard output (console) or to the browser window.
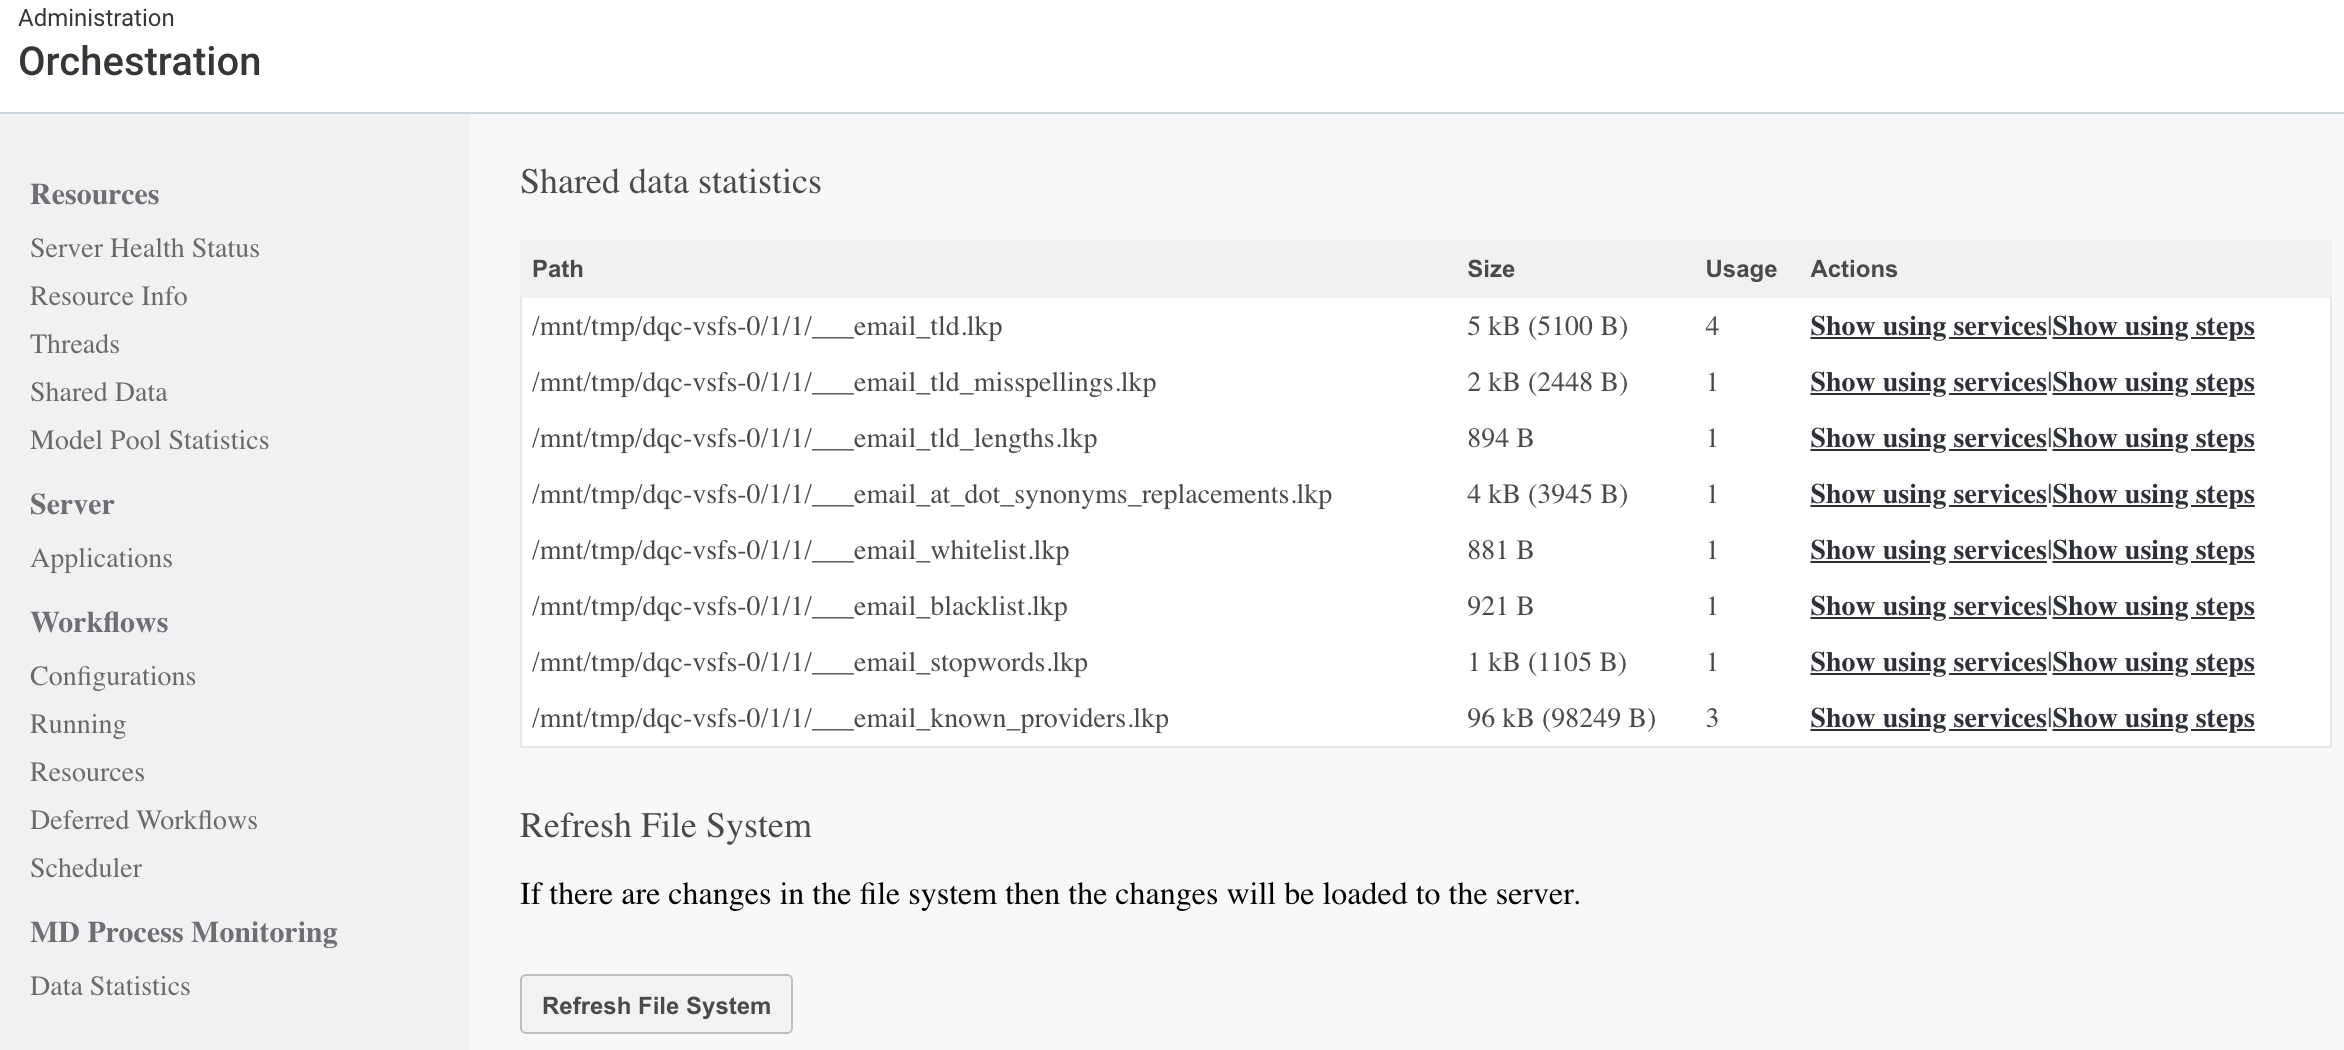
Shared Data
Displays a list of files used by the online services. To track a given file to the specific services and steps it is used in, select Show using services and Show using steps respectively.
When browsing through the steps the file is used in, you can also see information about the connections between the steps.
Server
Applications
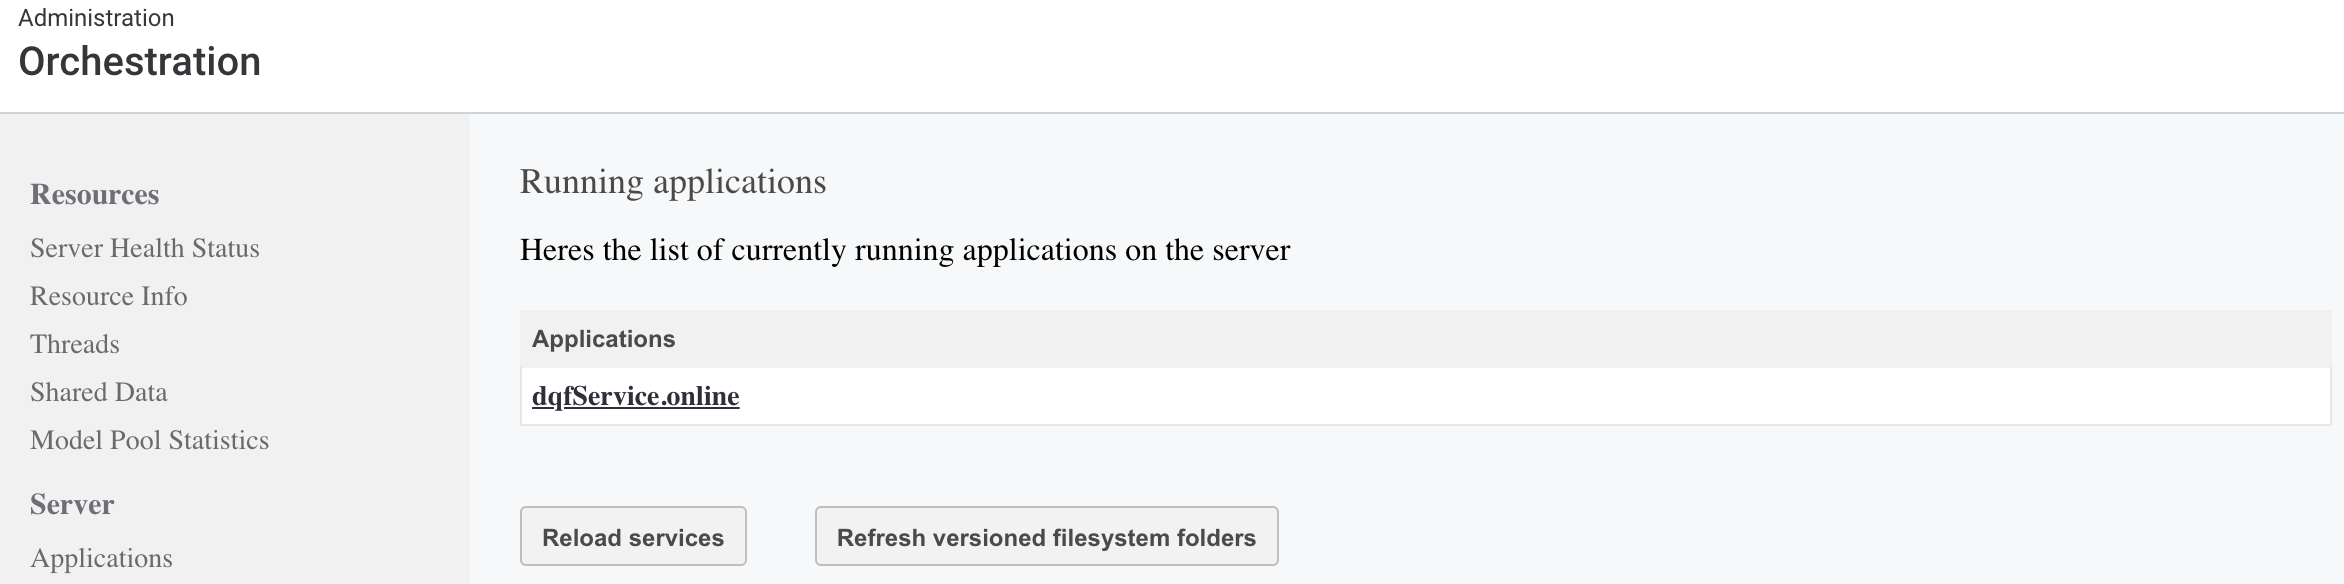
If Online Services Component is configured, the screen lists the available applications that offer online services.
To inspect which services a given application includes, select the application. In addition, you can also:
-
Reload services - Allows updating the service configuration without restarting the server.
-
Refresh versioned filesystem folders - Updates the contents of versioned folders without restarting the server. This is available only if the Versioned File System Component is enabled.
To view the services inside it, select the application.
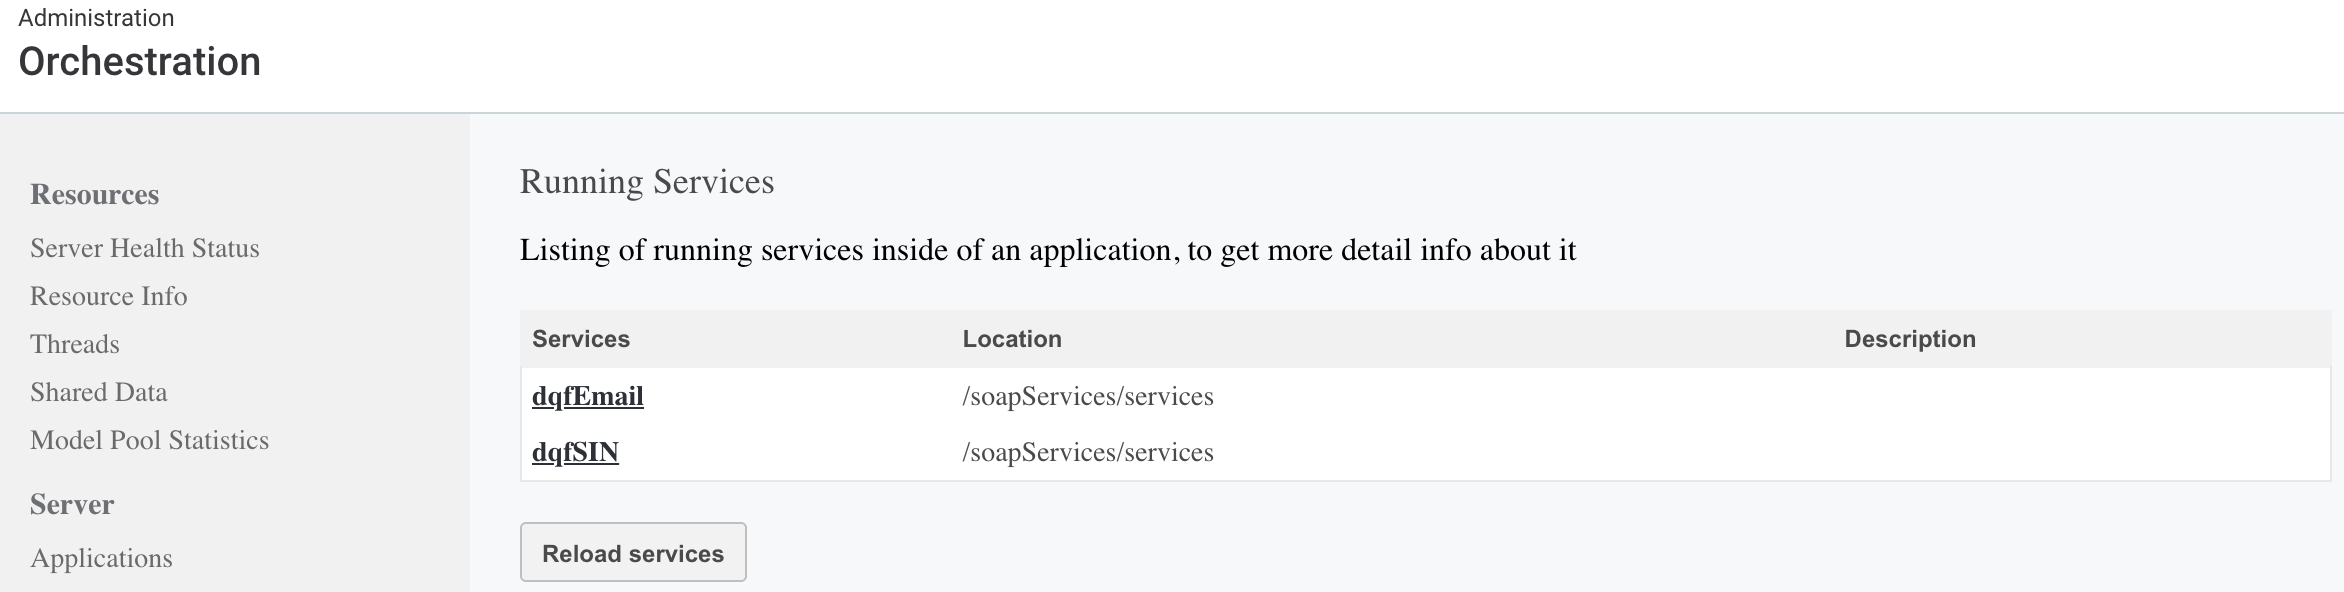
You can also select a service from the table to view more details. At this level there are several options available:
-
Edit Parallelism - This setting overrides the parallelism setting in the runtime configuration for the particular service.
-
Show Steps - Shows all the steps of the given online service.
-
Show Connections - Shows connections between the steps of the online service.
-
Show Shared Data Statistics - Shows a list of files used by the online service.
-
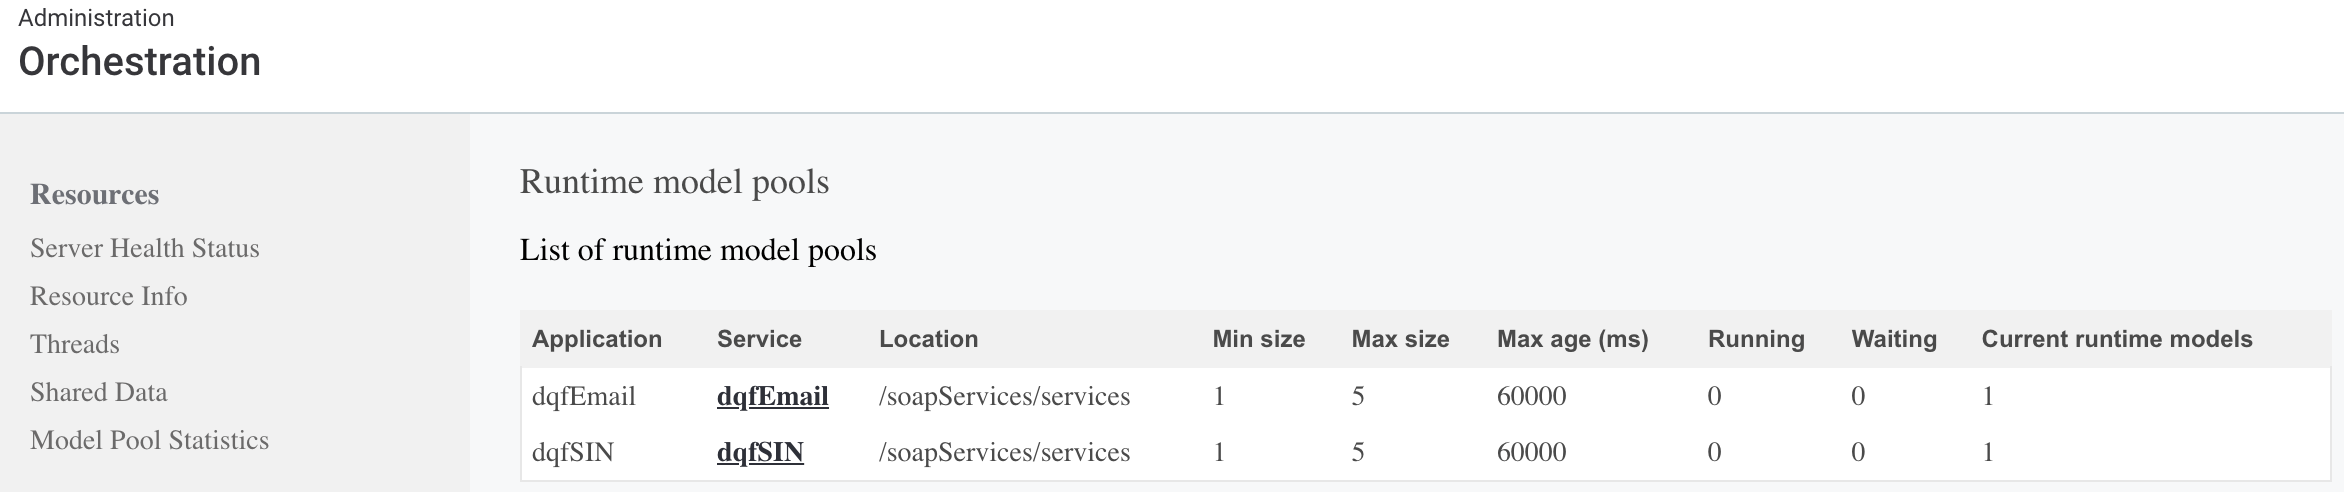
Show Runtime Model Pool - Shows the traffic and statistics for a particular service.

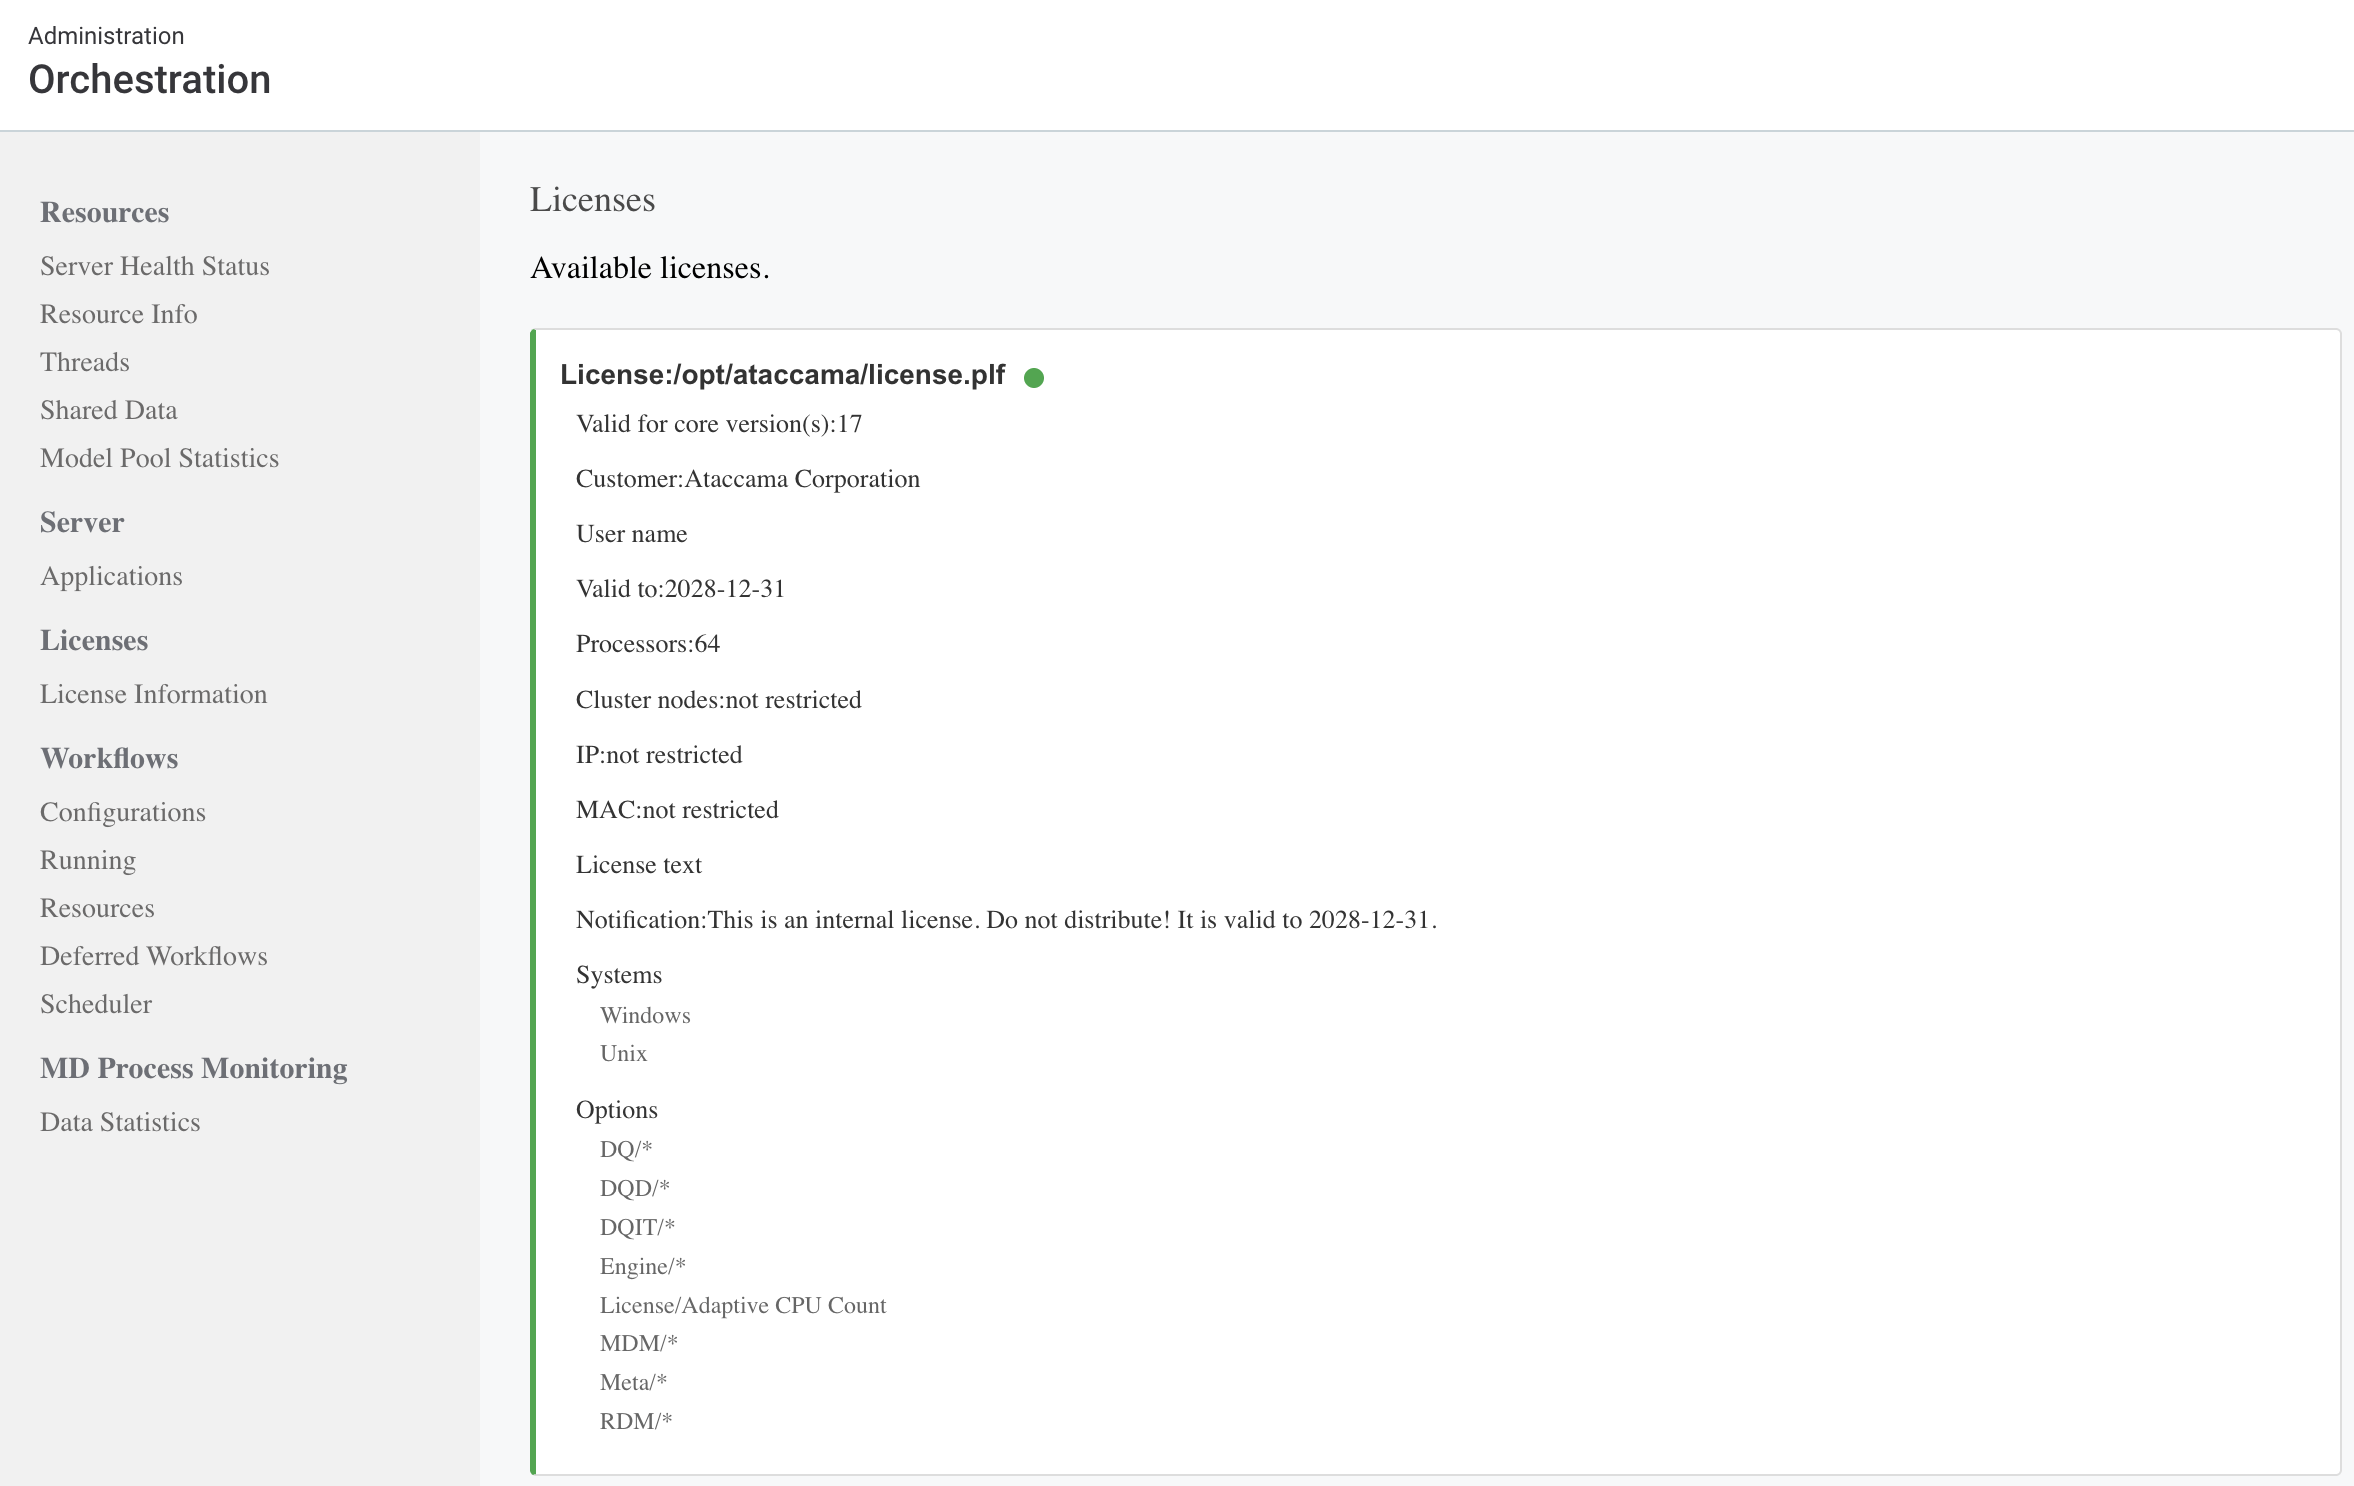
Licenses
The Licenses section shows information about your current license, including the organization name, user, file path and name, validity period, version, IP/MAC address, and description.
Workflows
The Workflows section contains information about the defined workflows and schedules, as well as the option to run them directly from the MDM Web App Admin Center. Available if Workflow Component is used.
Configurations
Shows all configured workflows, lets you filter by the workflow state and running status.
Use the Reload option to reload the workflow configuration without restarting the server.
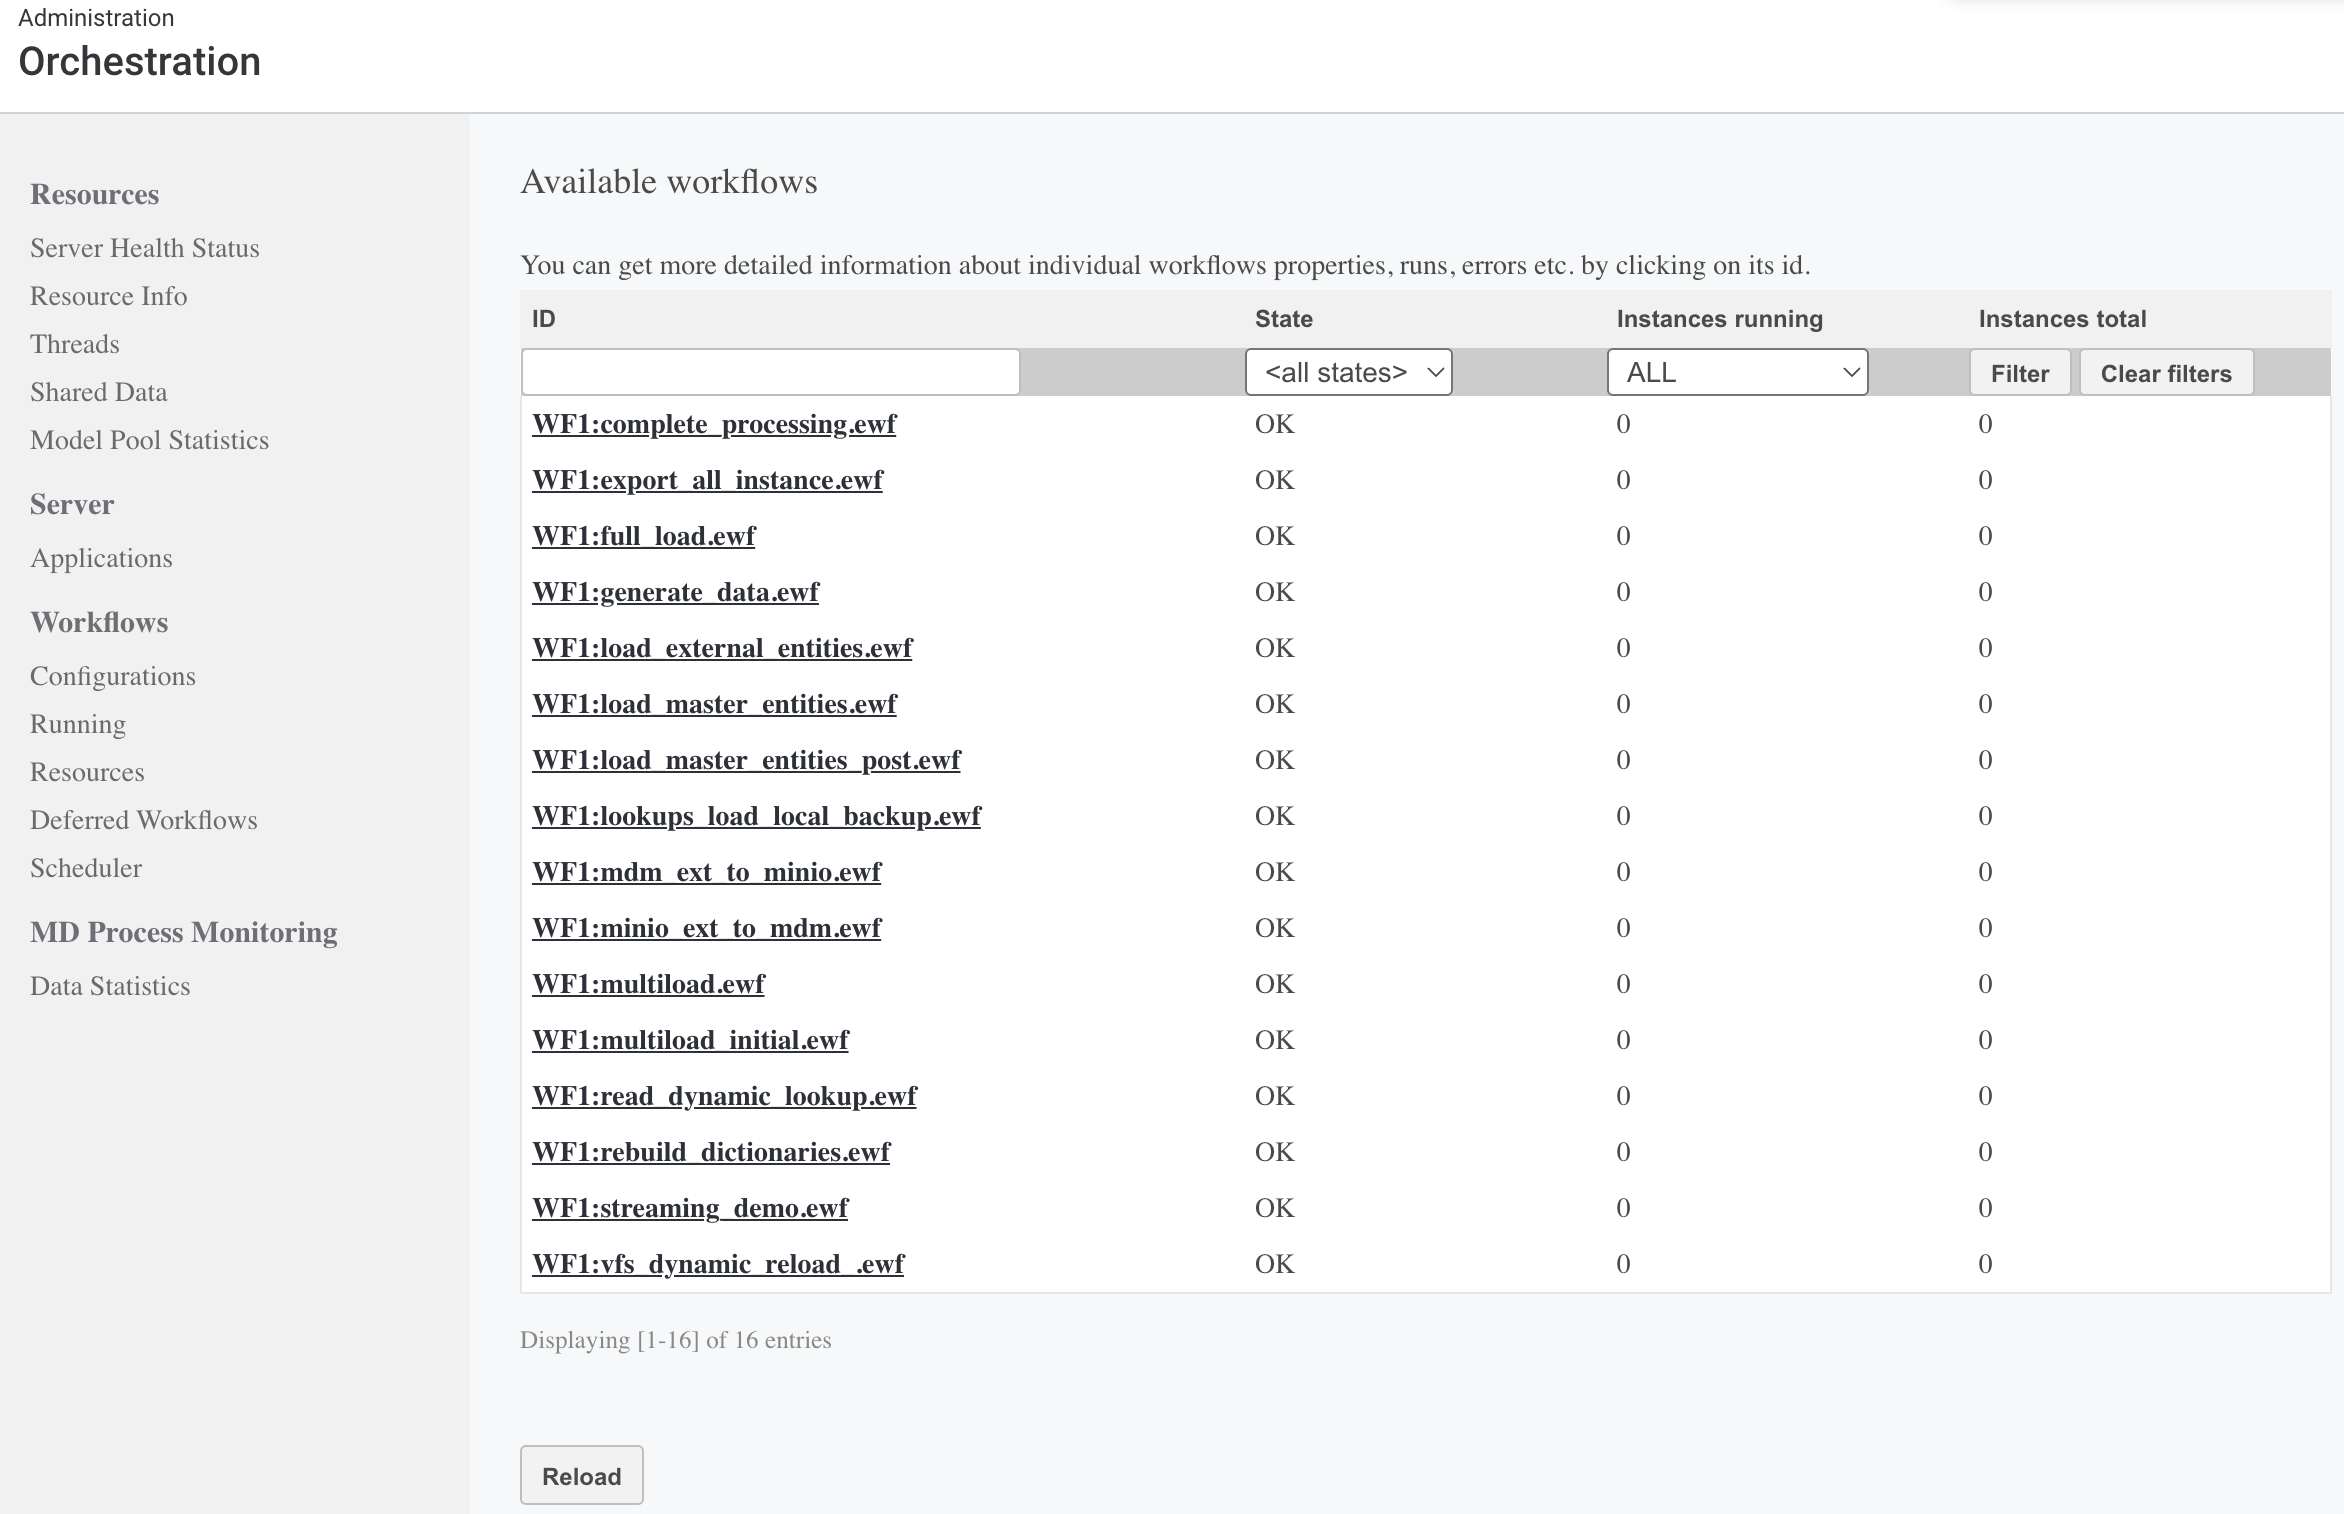
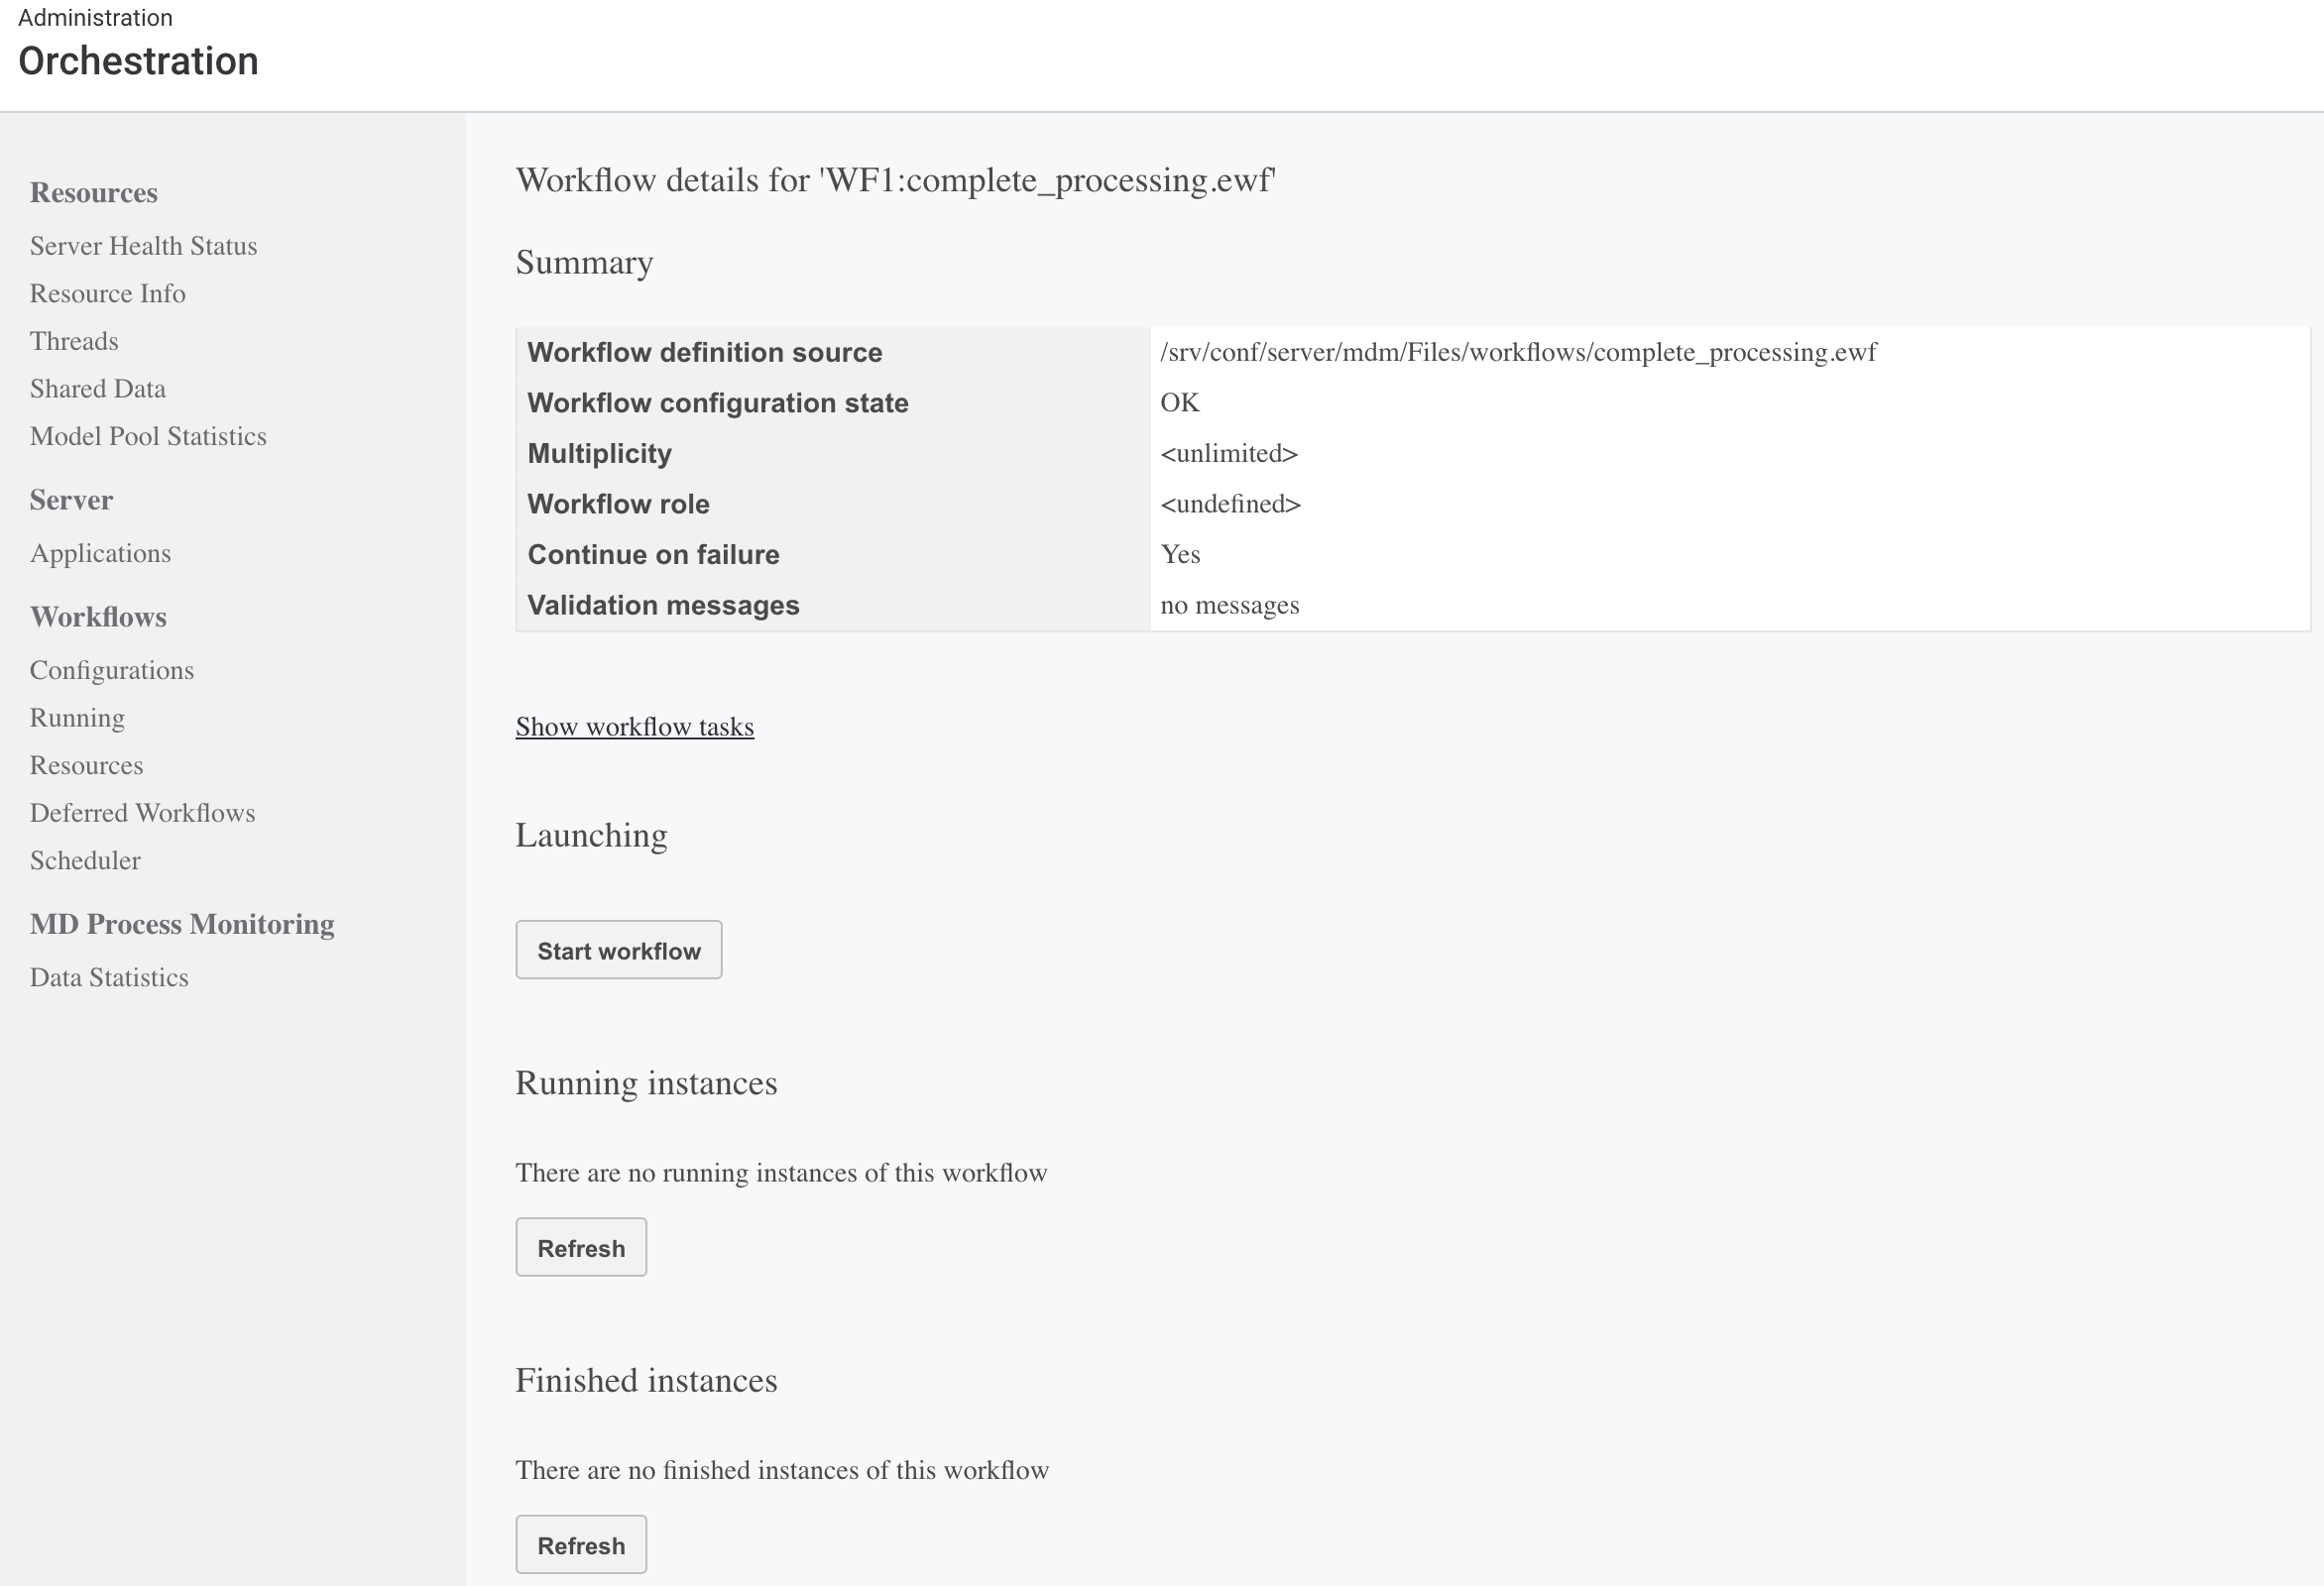
Select one of the workflows in the ID column to view more details:
Deferred workflows
Shows the workflow instances deferred due to the multiplicity limitation (that is, the number of instances of a given workflow running at the same time).
Scheduler
Contains information about the configured schedules. Available if Scheduler Server Component is configured.
You can filter schedules by specifying the name (or a part of it) in the Job Definition field and selecting Filter. It is also possible to filter by status.
From here, you can also run and deactivate schedules manually.
To change a schedule, edit the relevant .sch file in the filesystem and select Reload definitions.
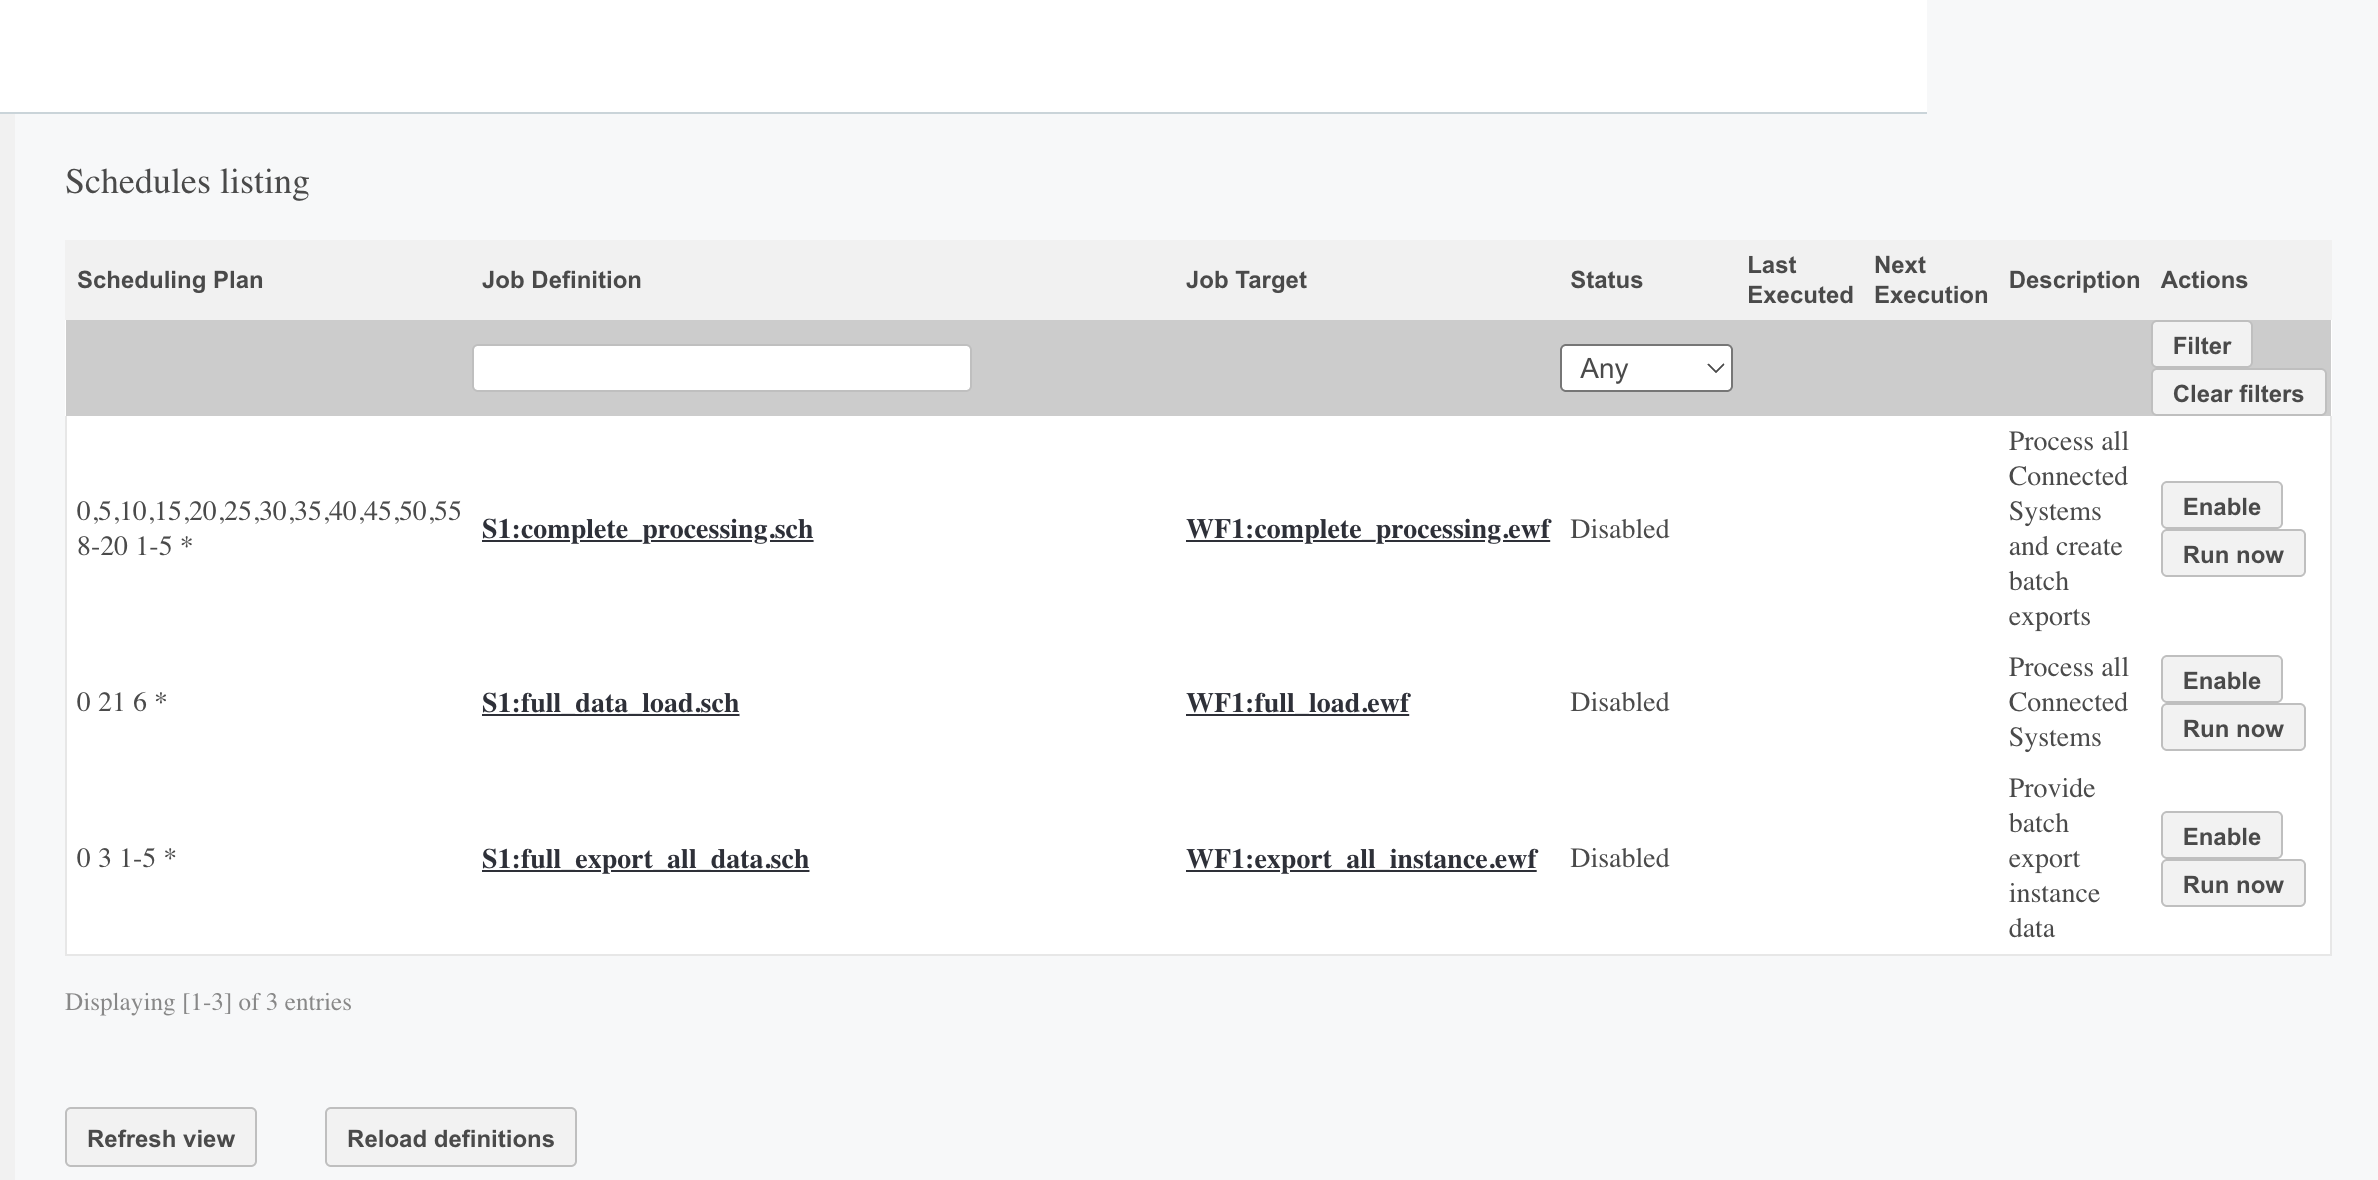
To view the schedule details and execution history, select a schedule name.
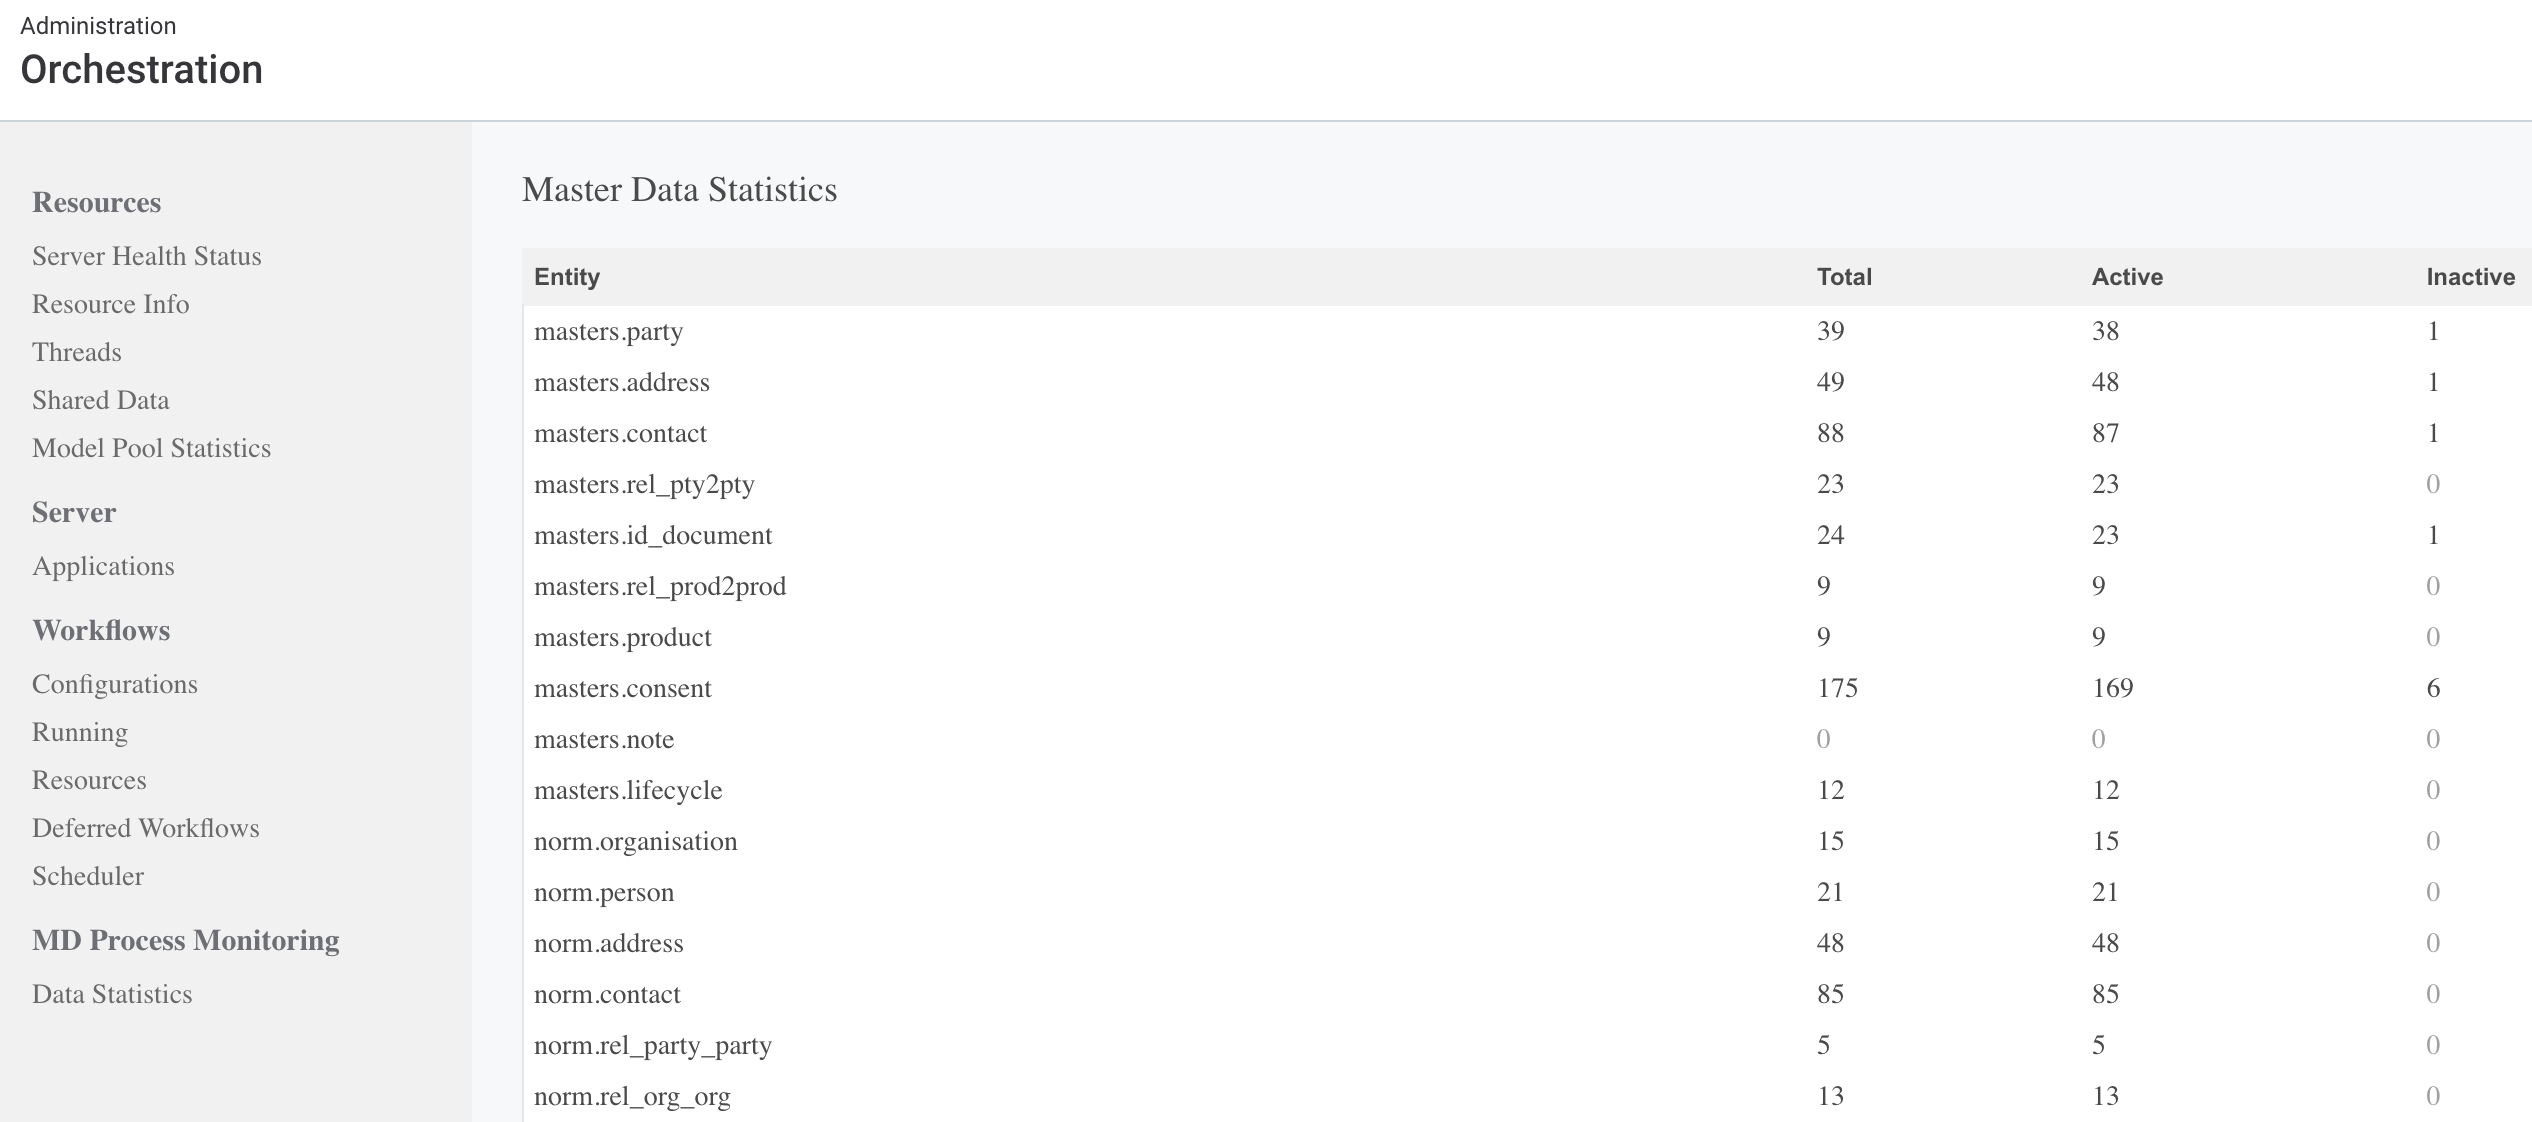
MD Process Monitoring
Data Statistics
Shows detailed statistics on data in the MDM storage. This includes:
-
Master Data Statistics - Shows a number of active and inactive (logical delete) records per each master entity.
-
Instance Data Statistics - Shows a number of active and inactive (logical delete) records per each instance entity.
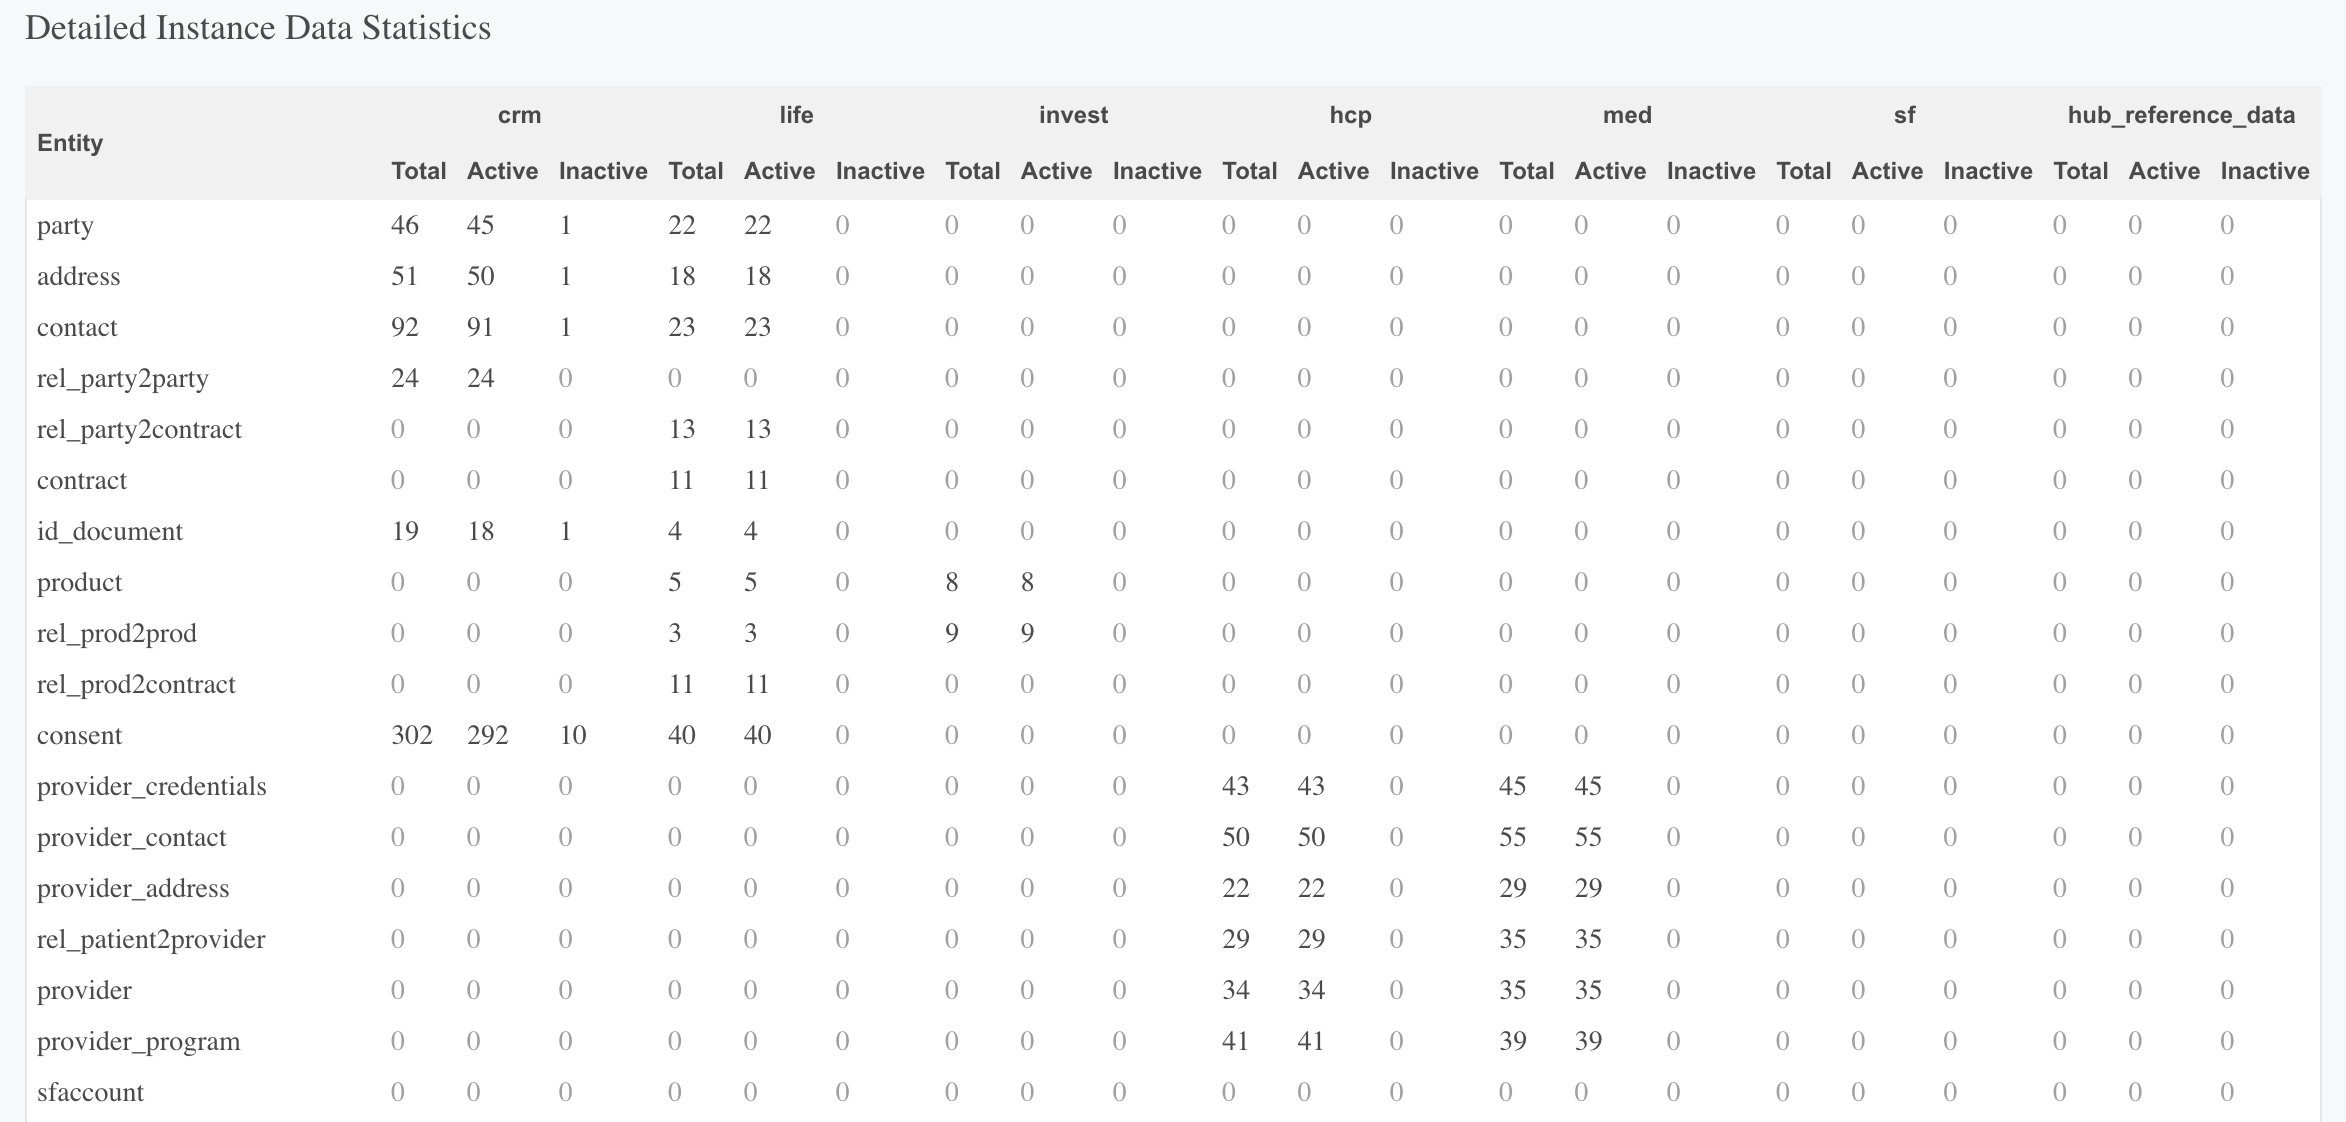
-
Detailed Instance Data Statistics - Shows instance data numbers per each source system and instance entity.
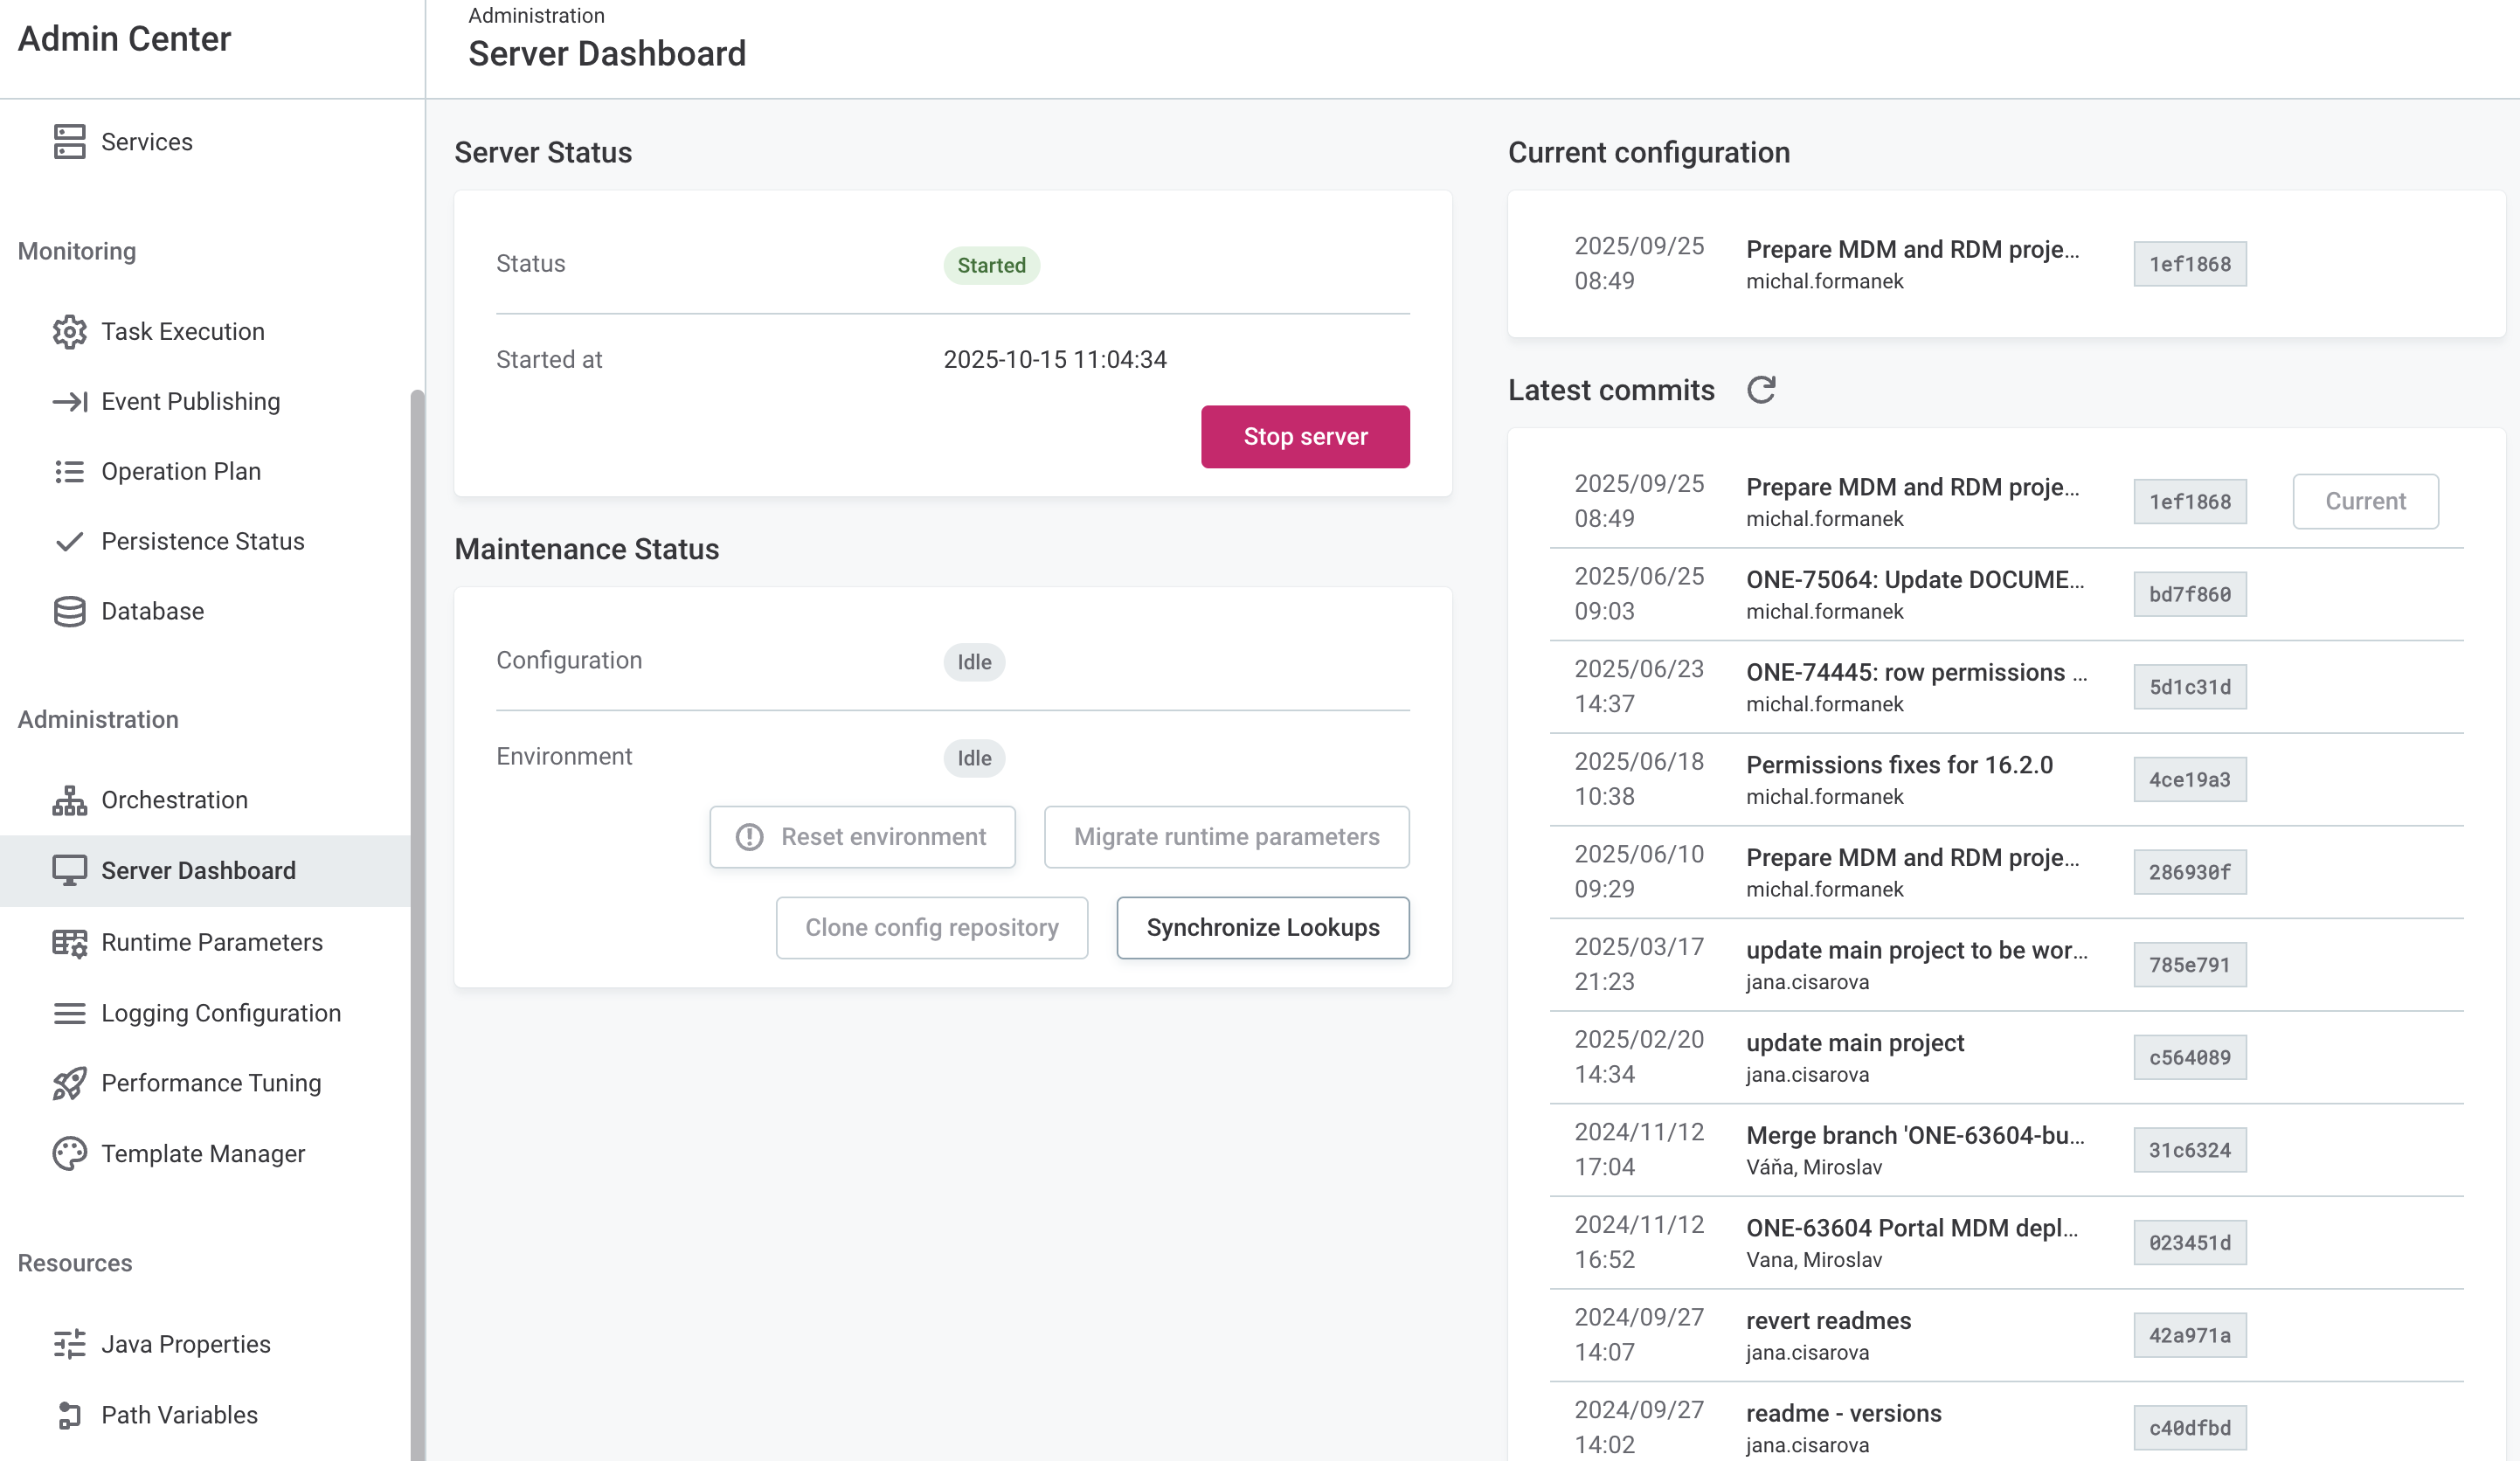
Server Dashboard
This section provides information about the MDM Server status, current MDM configuration, and latest commits. In addition, it allows you to:
-
Stop and start the server.
-
Perform Git operations:
To be able to perform Server Dashboard actions, you must have the role defined by the ataccama.one.mdm.admin-center.manager.required-roles MDM Server application property.
See MDM Admin Center permissions.
|
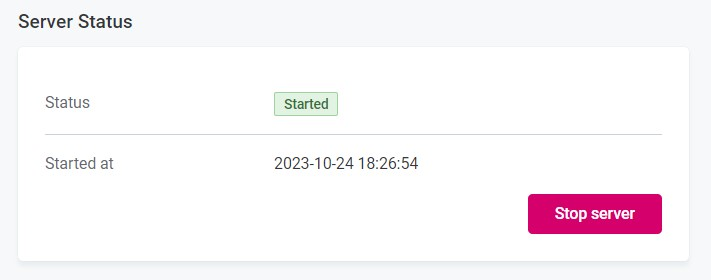
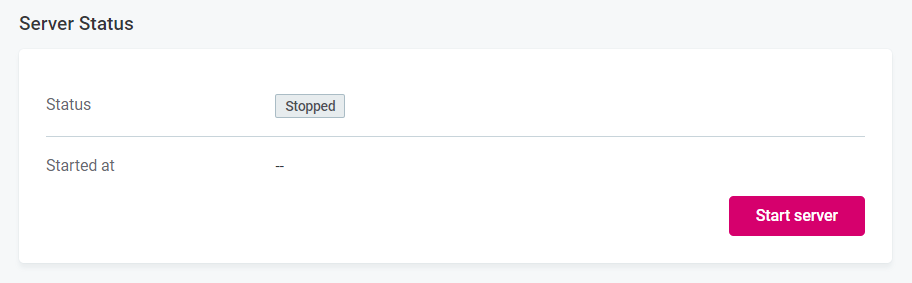
Server Status
This section provides information about the MDM Server status and the time when the server was started. It also allows you to stop and start the server and reset the environment.
| The ability to start and stop the server cannot be restricted for roles with manager access. |
Possible server statuses are:
| Status | Description |
|---|---|
Starting |
The server is starting. |
Started |
The server started and is running. |
Stopping |
The server is stopping. |
Stopped |
The server stopped and is no longer running. |
Failed |
Starting the server failed. |
Stop MDM Server
If the MDM Server is running, the information about the status and the server start time is displayed.
You can stop the server when the server status is Started or Starting.
To stop MDM Server, select Stop server and confirm your choice in the modal that opens. The modal also reports the number of running operations: continue if no running operations are found. The server status changes to Stopping and then to Stopped.
| For production environments, it is not possible to stop the server. |
Stopping the server in self-managed deployments
If your instance of MDM is running in a self-managed, on premise deployment, you have two options for restarting the server. You can either:
-
Restart the system service (or execute the
start_server.shscript). -
Stop and start the server through the MDM Web App Admin Center, as described in this article.
To decide which option to use and when, consider the following:
-
Using the first option, all application components are restarted, including the MDM engine, REST and SOAP APIs, schedulers, workflows.
While the downtime can be longer, we recommend this approach for substantial configuration changes (for example, after editing application properties or Java parameters), as it ensures all changes are fully propagated to all components.
-
Using the second option, some components keep running during restart to ensure the application can start again. For example, this includes the database connection pool, a GraphQL endpoint for Admin Center which enables the restart, health probes.
As such, it is best suited for quickly reloading the server after smaller configuration changes, with minimal downtime for users.
Start MDM Server
The option to start the server is available when the server status is Stopped or Failed. To start the server, select Start server.
The server status changes to Starting. In this state, the option to stop the server is available.
If the server fails to start, the status changes to Failed. After fixing the issue, you can start the server again. If the server successfully started, the status changes to Started.
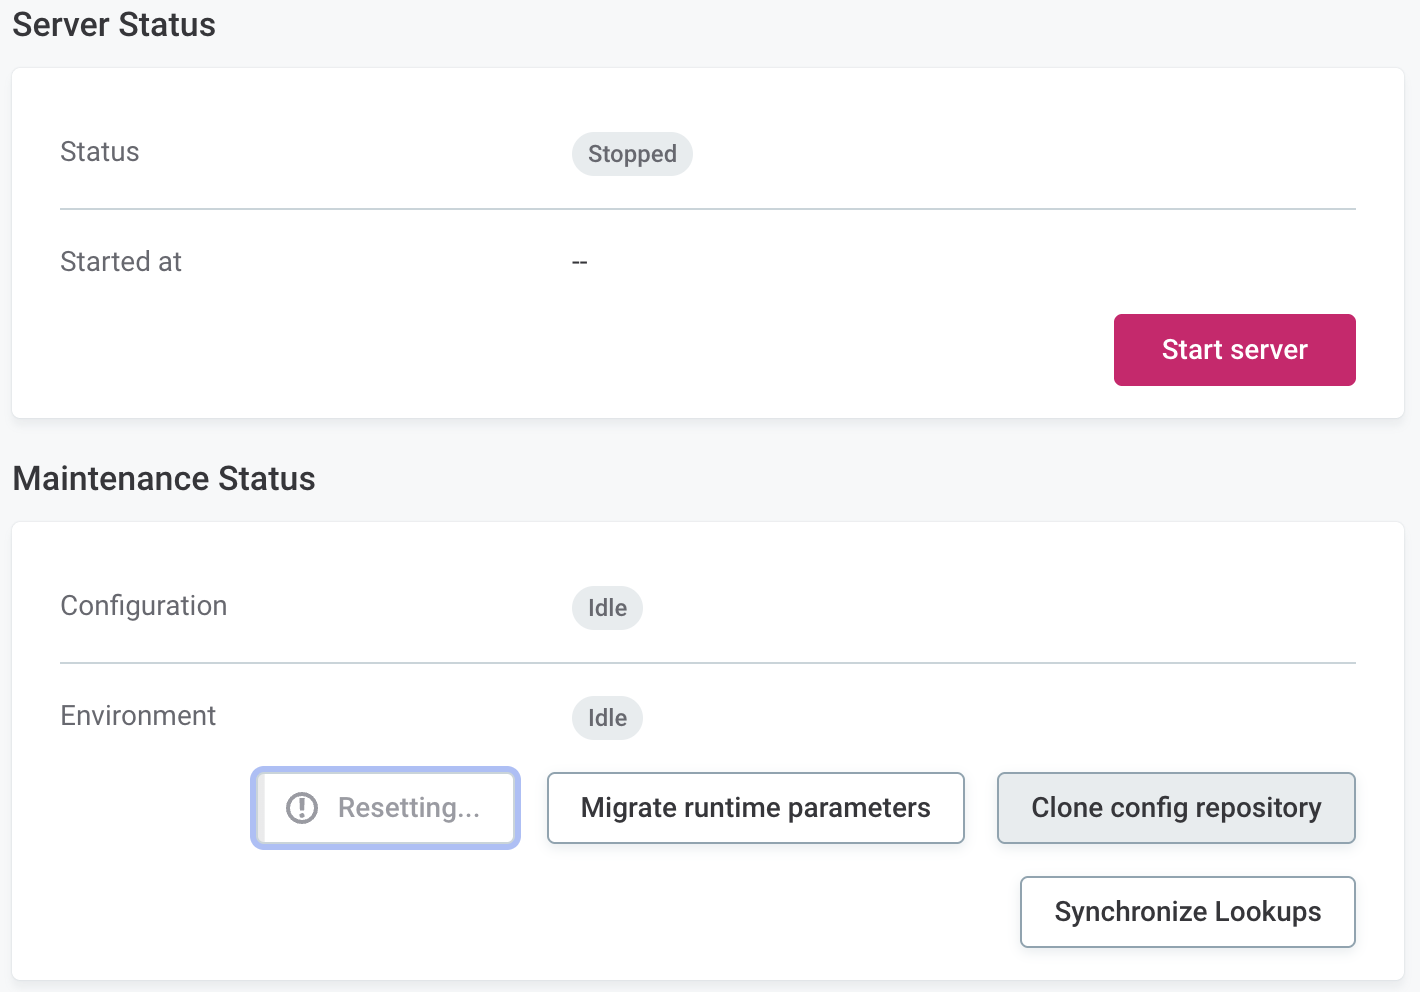
Maintenance Status
In this section, you can view the information about the configuration and environment status. Additionally, from here you can:
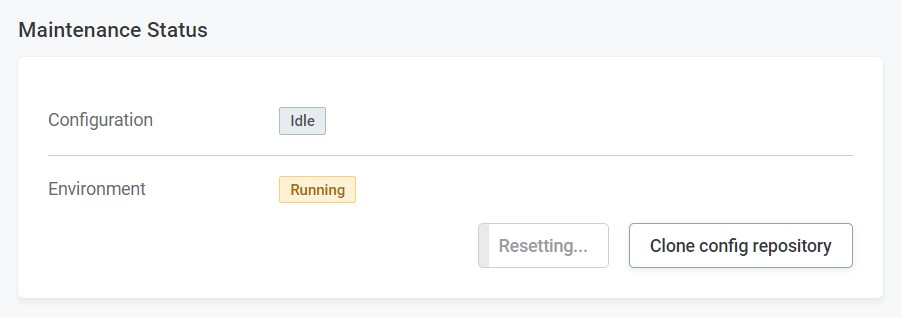
Environment status
Here you can find information about the status of the Reset environment operation.
| Status | Description |
|---|---|
Idle |
No operation is currently running. |
Failed |
The operation failed. |
Running |
The operation is running. |
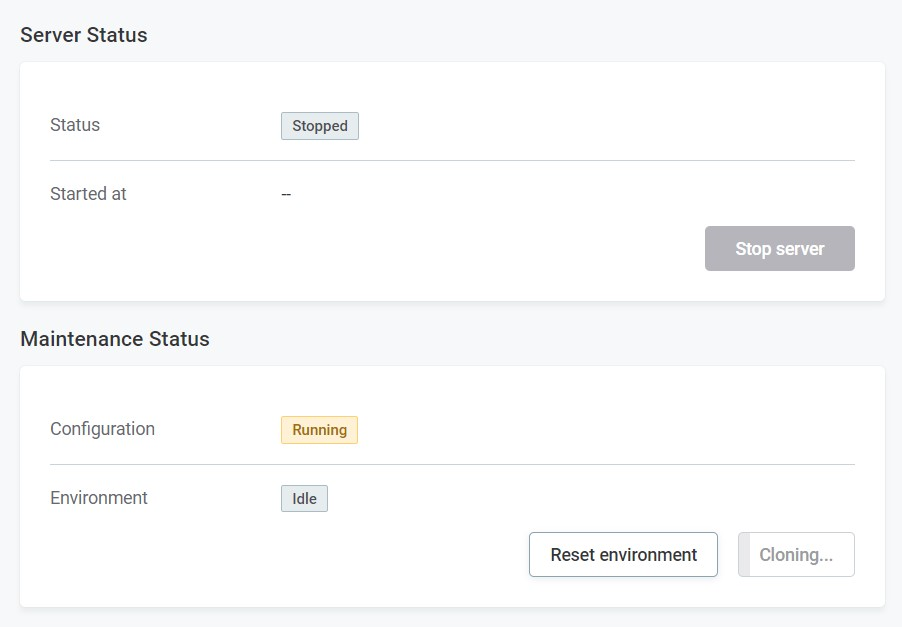
Reset environment
Resetting the environment includes clearing all database tables and deleting resource files (specified in the ataccama.one.mdm.server.refresh.dirs-to-delete application property, see MDM Server Application Properties > MDM features).
The action does not affect the configuration. This functionality can be useful for development and testing purposes.
|
In production environments, we recommend keeping this option turned off. See Turn off Reset environment option for details. In addition, the feature can only be used for PostgreSQL databases, otherwise an error is thrown. |
To reset the environment:
-
Make sure the server status is Stopped or Failed. Otherwise, stop the server by selecting Stop server in the Server Status section.
-
In Maintenance Status, select Reset environment.
-
Confirm your choice. The environment status now changes to Running.
In this state, the option to stop the server is available.
-
Once the resetting is finished, the environment status is changed to Idle. You can now start the server.
Turn off Reset environment option
To turn off the functionality, set these properties to false in the following configuration files:
-
ataccama.one.mdm.features.environment.reset.enabled=falsein MDM Server application.properties. -
ataccama.one.mda.features.environment.reset.enabled=falsein MDM Web Application application.properties.
This also removes the Reset environment option from the MDM Web App Admin Center.
Migrate runtime parameters
Use this option to make sure the runtime parameters are up to date.
|
Manual migration is intended to be used as a last resort option in cases where the configuration must be reset to a previous version and no other options are available. Once the initial migration is completed, which is done automatically after upgrading, we strongly recommend editing MDM-specific runtime properties only in the MDM Web App Admin Center. |
For example, you can run migration after resetting your environment or after changing your configuration in the repository. This overwrites the runtime parameters with the latest configuration. If you reset your environment but skip the migration, the default configuration values are used instead.
If you changed configuration in the repository, fetch the latest changes first and then run the migration.
In case the migration fails due to incorrect configuration, check the log to find the root cause of the issue. Fix the issue in the configuration file, then fetch the latest changes and rerun the migration.
To migrate runtime parameters:
-
Make sure the server status is Stopped. Otherwise, stop the server by selecting Stop server in the Server Status section.
-
In Maintenance Status, select Migrate runtime parameters.
-
Confirm your choice and wait for the migration to complete. The environment status now changes to Running.
-
Once the migration is finished, the environment status changes to Idle.
You can now start the server.
Configuration status
In this subsection, the status of the following operations is displayed:
Only one operation can be run at a time.
| Status | Description |
|---|---|
Idle |
No operation is currently running. |
Failed |
An operation failed. |
Running |
An operation is running. |
Clone repository
It is possible to clone the repository from MDM Web App. Manual cloning can be useful if initial cloning process during startup failed.
To clone the repository:
-
Make sure the server status is Stopped or Failed. Otherwise, stop the server by selecting Stop server in the Server Status section.
-
In Maintenance Status, select Clone config repository.
-
Confirm your choice. The configuration status now changes to Running.
-
Once the status changes to Idle, you can start the server.
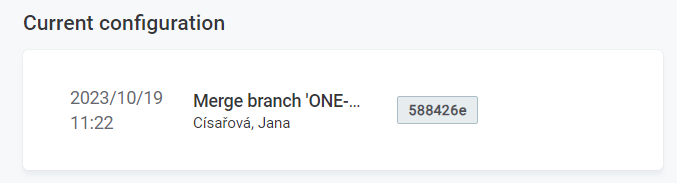
Current configuration
In this section, the following information about the last applied configuration change is displayed:
-
Date and time
-
Commit message
-
Commit identifier
-
Commit author
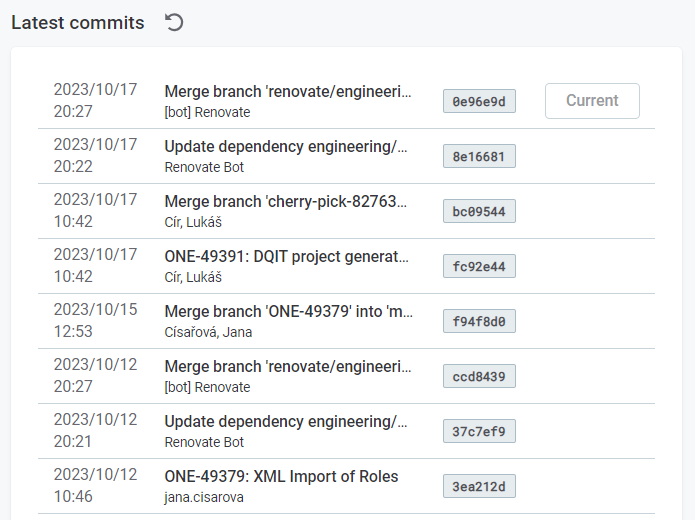
Latest commits
In the Latest commits section, the information about 20 latest commits is displayed. In addition, from this section you can perform the following operations: fetch changes and apply a specific commit.
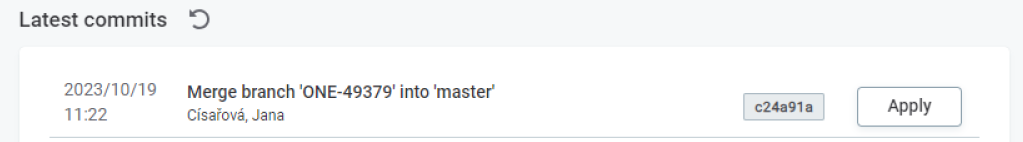
Fetch changes
You can run the fetch operation regardless of the current server status.
To see the latest changes made to the Git remote repository:
-
Select the circular arrow icon next to the section name. The configuration status changes to Running.
-
Once the operation is complete, the configuration status changes to Idle. The information about newer commits is now displayed at the top of the commit list with the Apply option (see Apply commit).
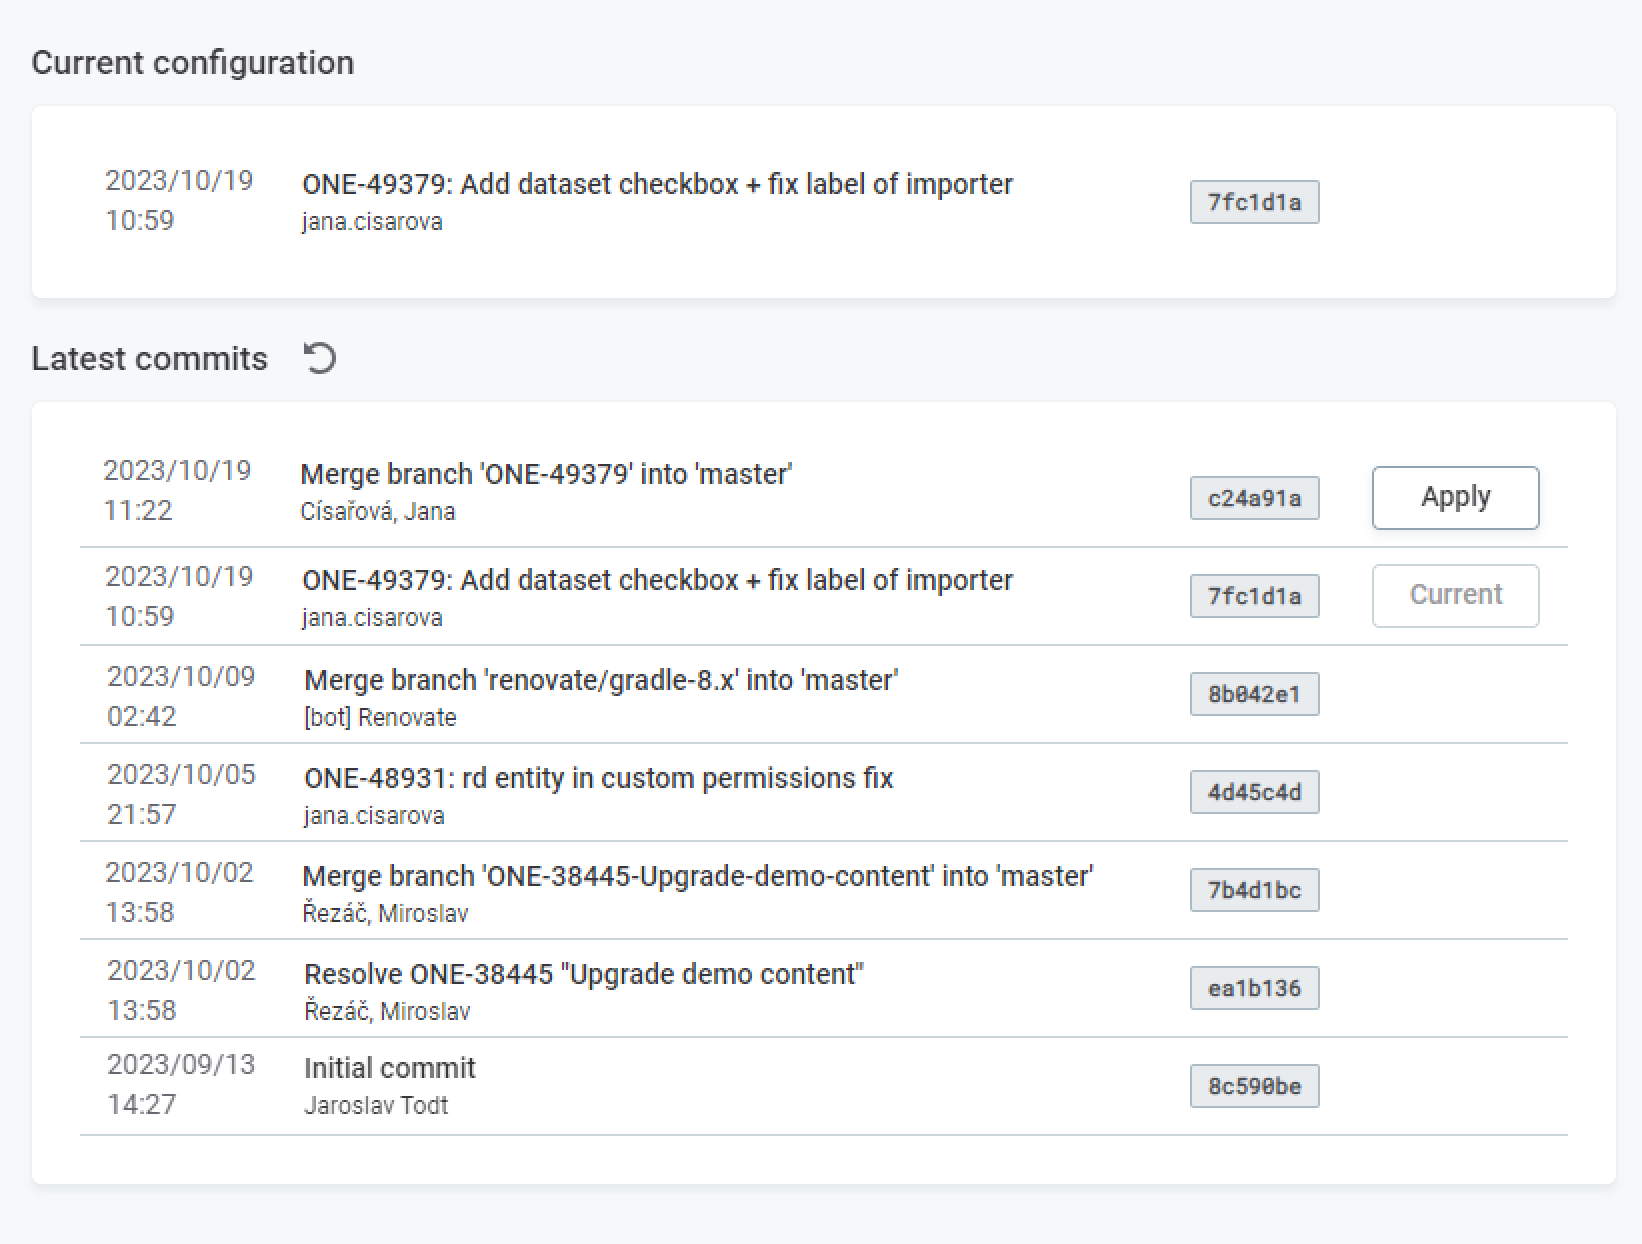
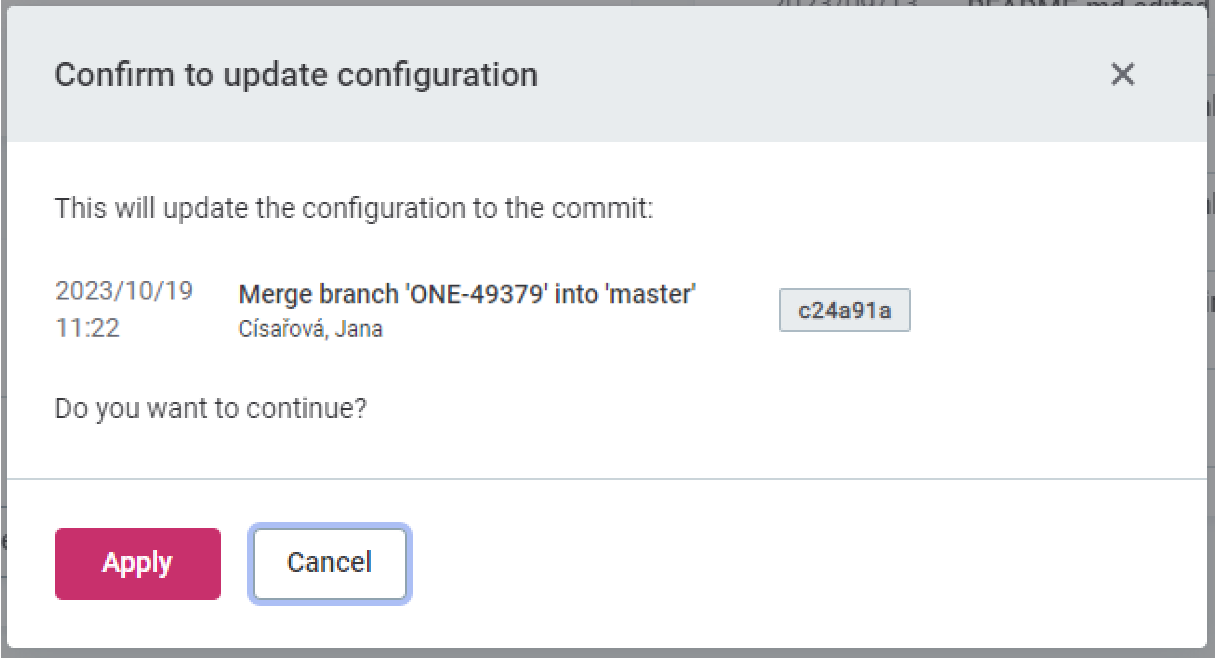
Apply commit
Only the commits that are newer than the one displayed in the Current configuration section can be applied.
To apply the changes:
-
Make sure the server status is Stopped or Failed. Otherwise, stop the server by selecting Stop server in the Server Status section.
-
Select Apply in the corresponding row.
-
Confirm your choice by selecting Apply. The configuration status changes to Running.
Once the changes are applied, the configuration status changes to Idle. The corresponding commit is now displayed in the Current configuration section.
-
You can now start the server.
To turn off the functionality, use ataccama.one.mdm.server.git.enabled property (see MDM Server Application Properties > Git operations).
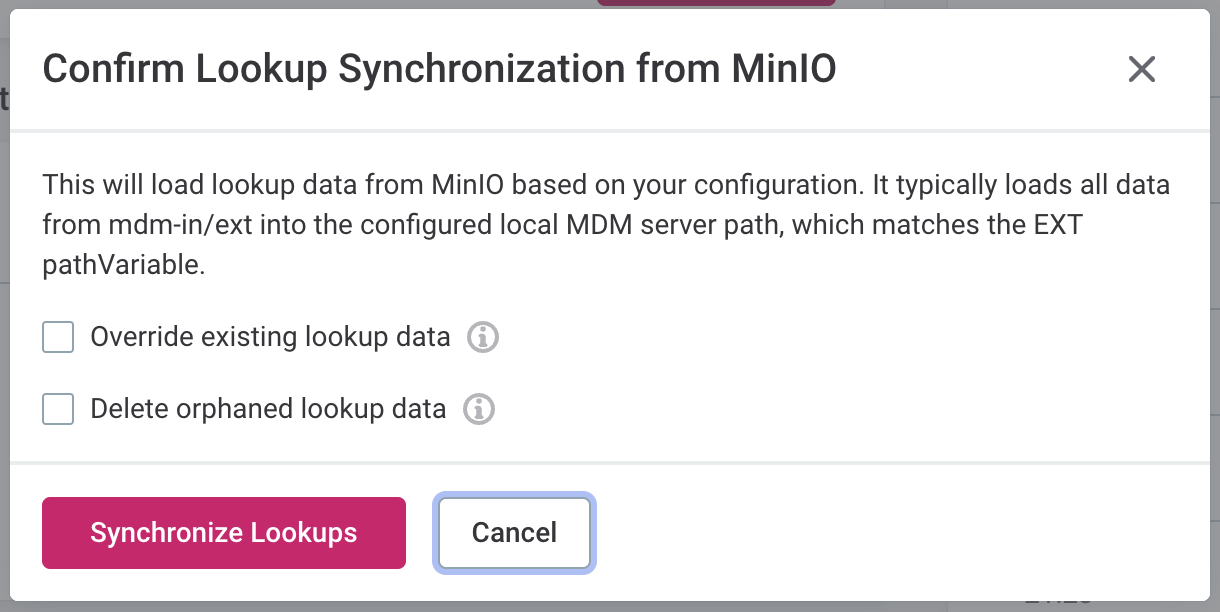
Synchronize lookups
Use it to run the lookup initialization process. This is a required step after restarting the MDM Server from the Admin Center or if you replaced some corrupt or missing lookup files during runtime.
Select Synchronize Lookups and apply additional options as needed. Confirm your choice and wait for the action to finish.
Your refreshed lookup files are now ready to use in plans.
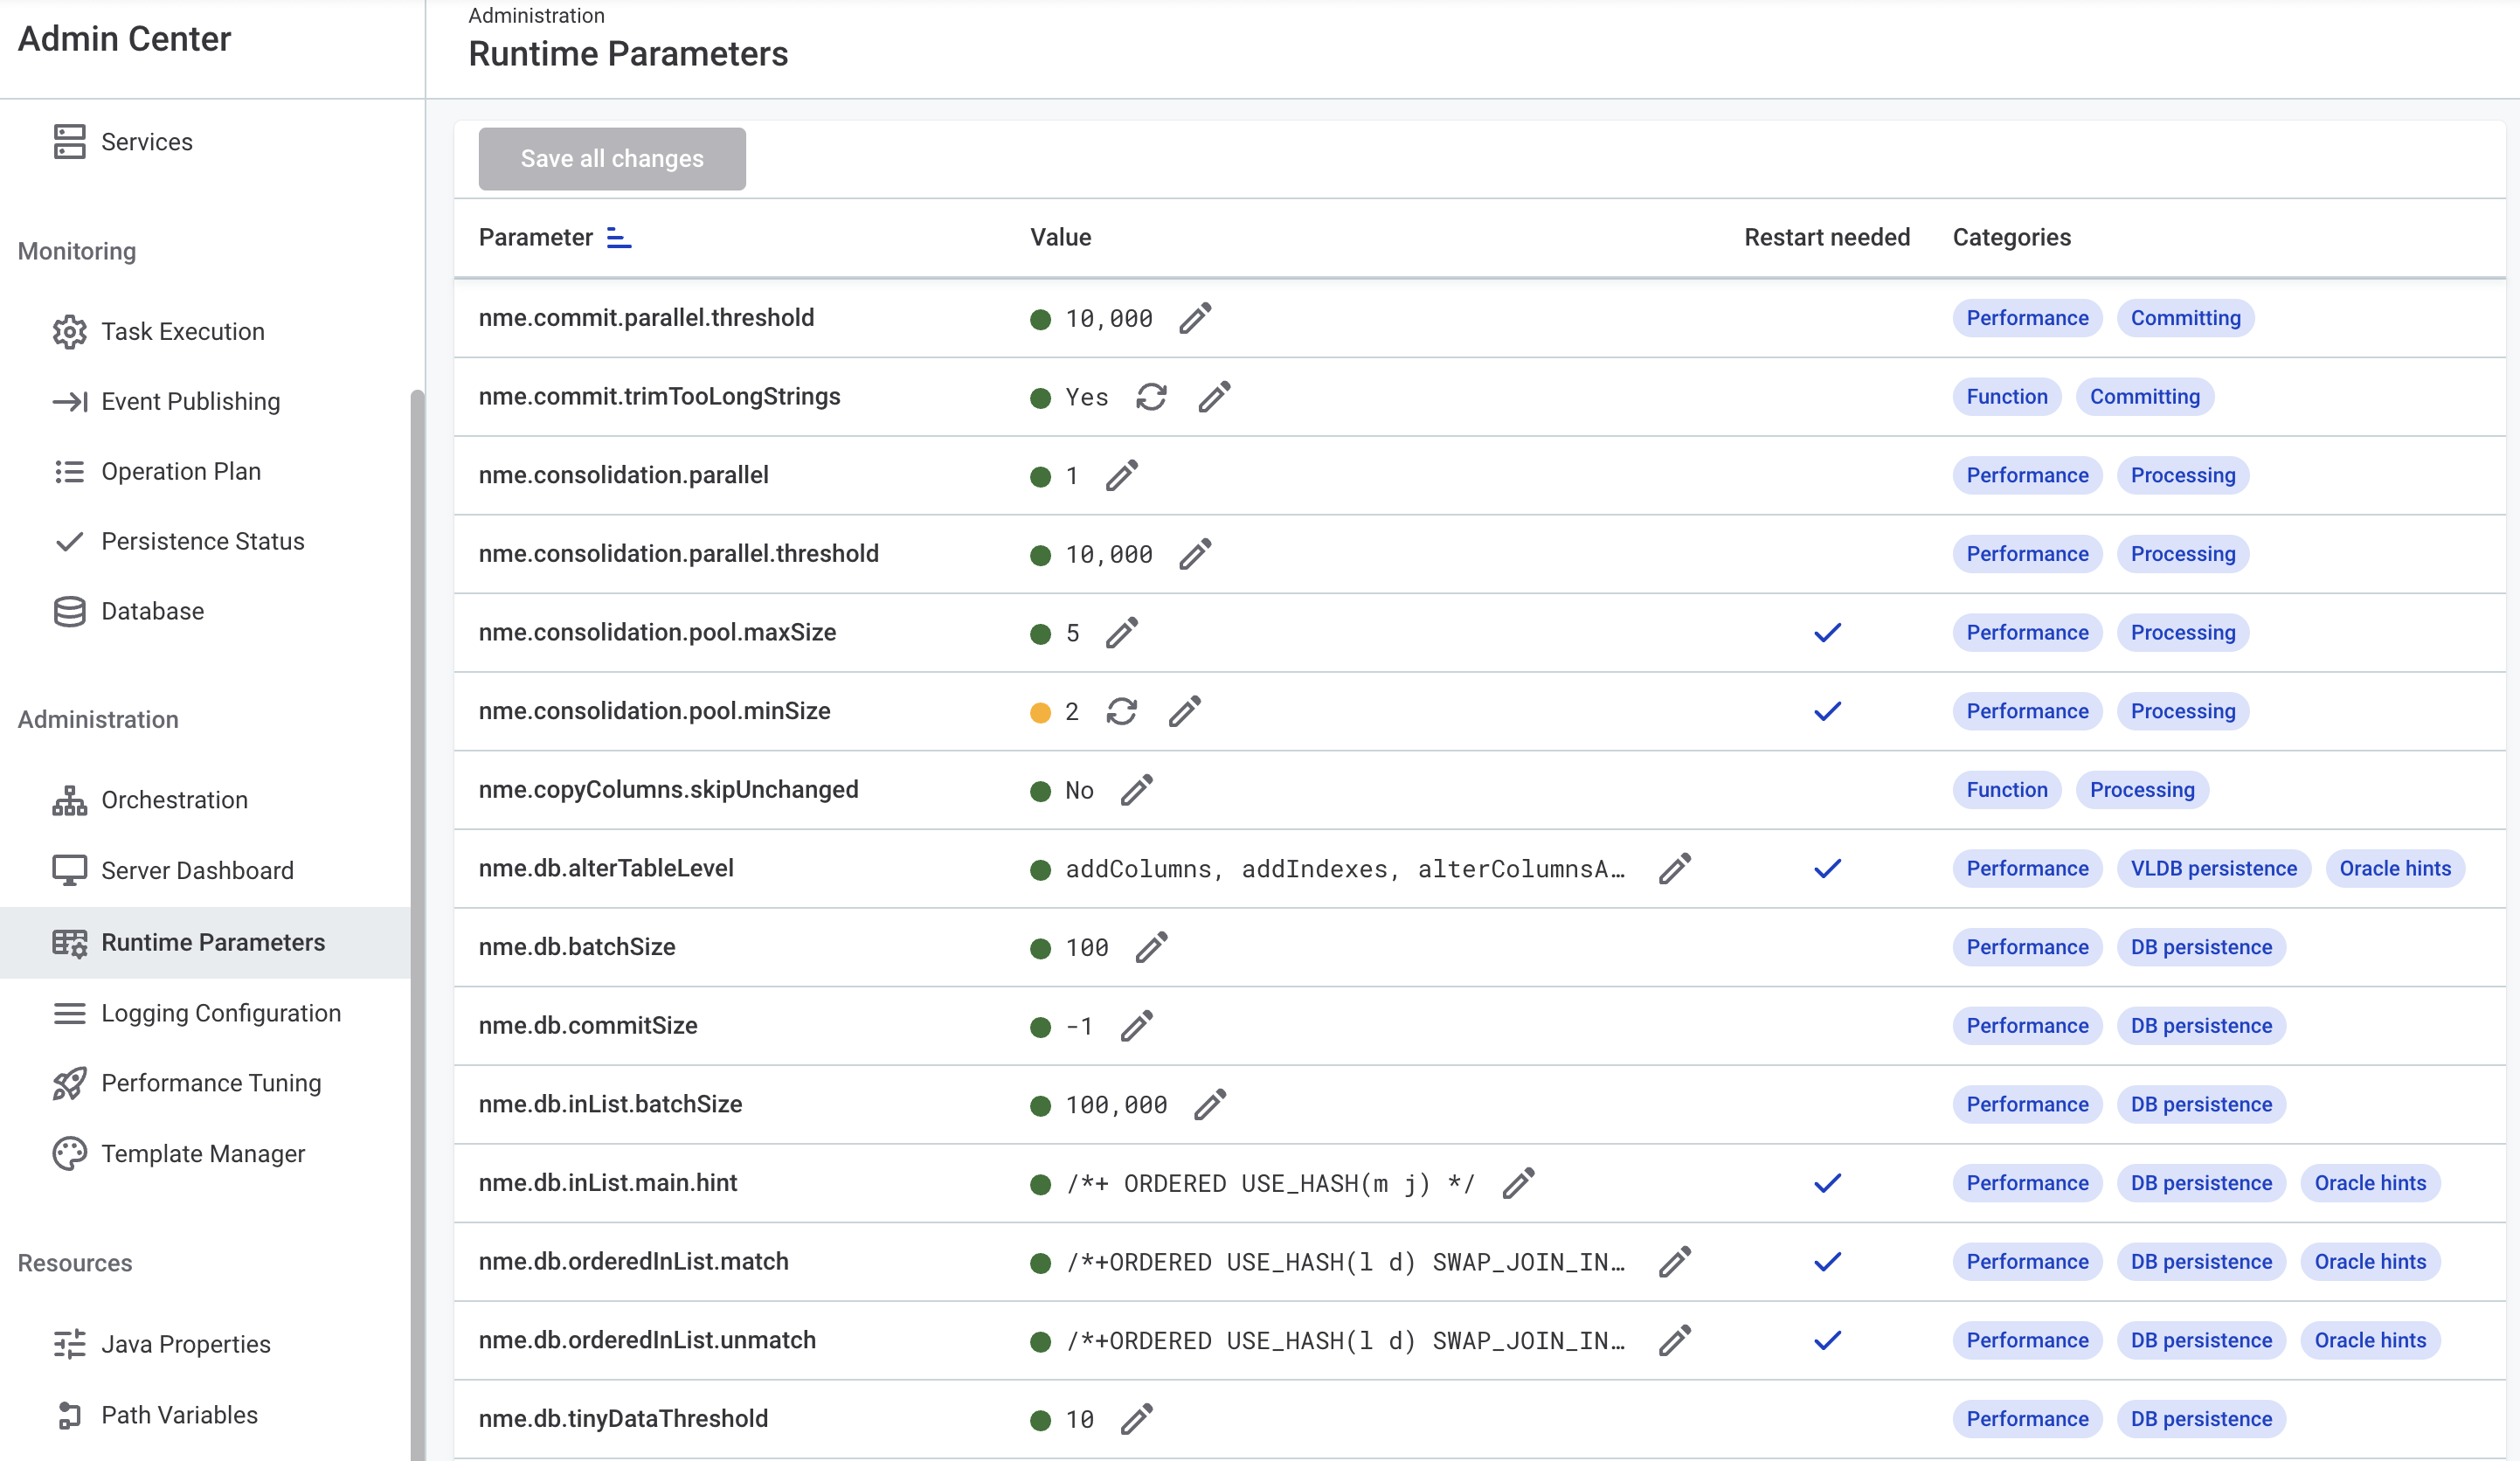
Runtime Parameters
This section shows the MDM-specific runtime parameters that are used by the engine.
To be able to perform Runtime Parameters actions, you must have the role defined by the ataccama.one.mdm.admin-center.manager.required-roles MDM Server application property.
See MDM Admin Center permissions.
|
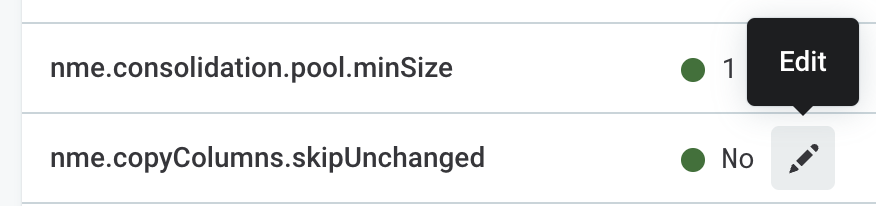
To edit a value, select the pencil icon next to the value.
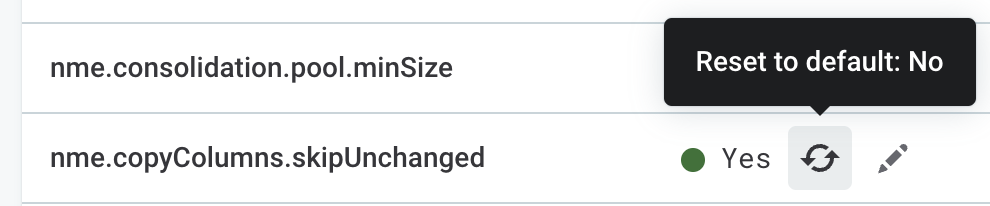
After you edit a parameter, an undo option becomes available. Select the icon to revert the parameter to the previous value.
| After you save your changes, you can also revert the new value to the default one. |
Once you’re done editing, select Save all changes to have your changes applied at once.
Similarly to committing configuration changes, try to save changes once per session, especially if you are modifying several properties related to the same functionality. This helps ensure consistency and prevent issues due to potentially incompatible configuration.
Note that some parameters require a server restart to take effect. This is indicated in the Restart needed column.
A dot next to the parameter value helps you keep track of the configuration history:
-
A green dot means that the current value is already in use.
-
A yellow dot means that the current value is saved but not yet applied. In that case, a server restart is required.
To export the current runtime parameters as a runtime.parameters file, select Download.
Use this to back up your configuration before making changes, compare settings across environments, keep a copy under version control, or share your current configuration when reporting issues or troubleshooting.
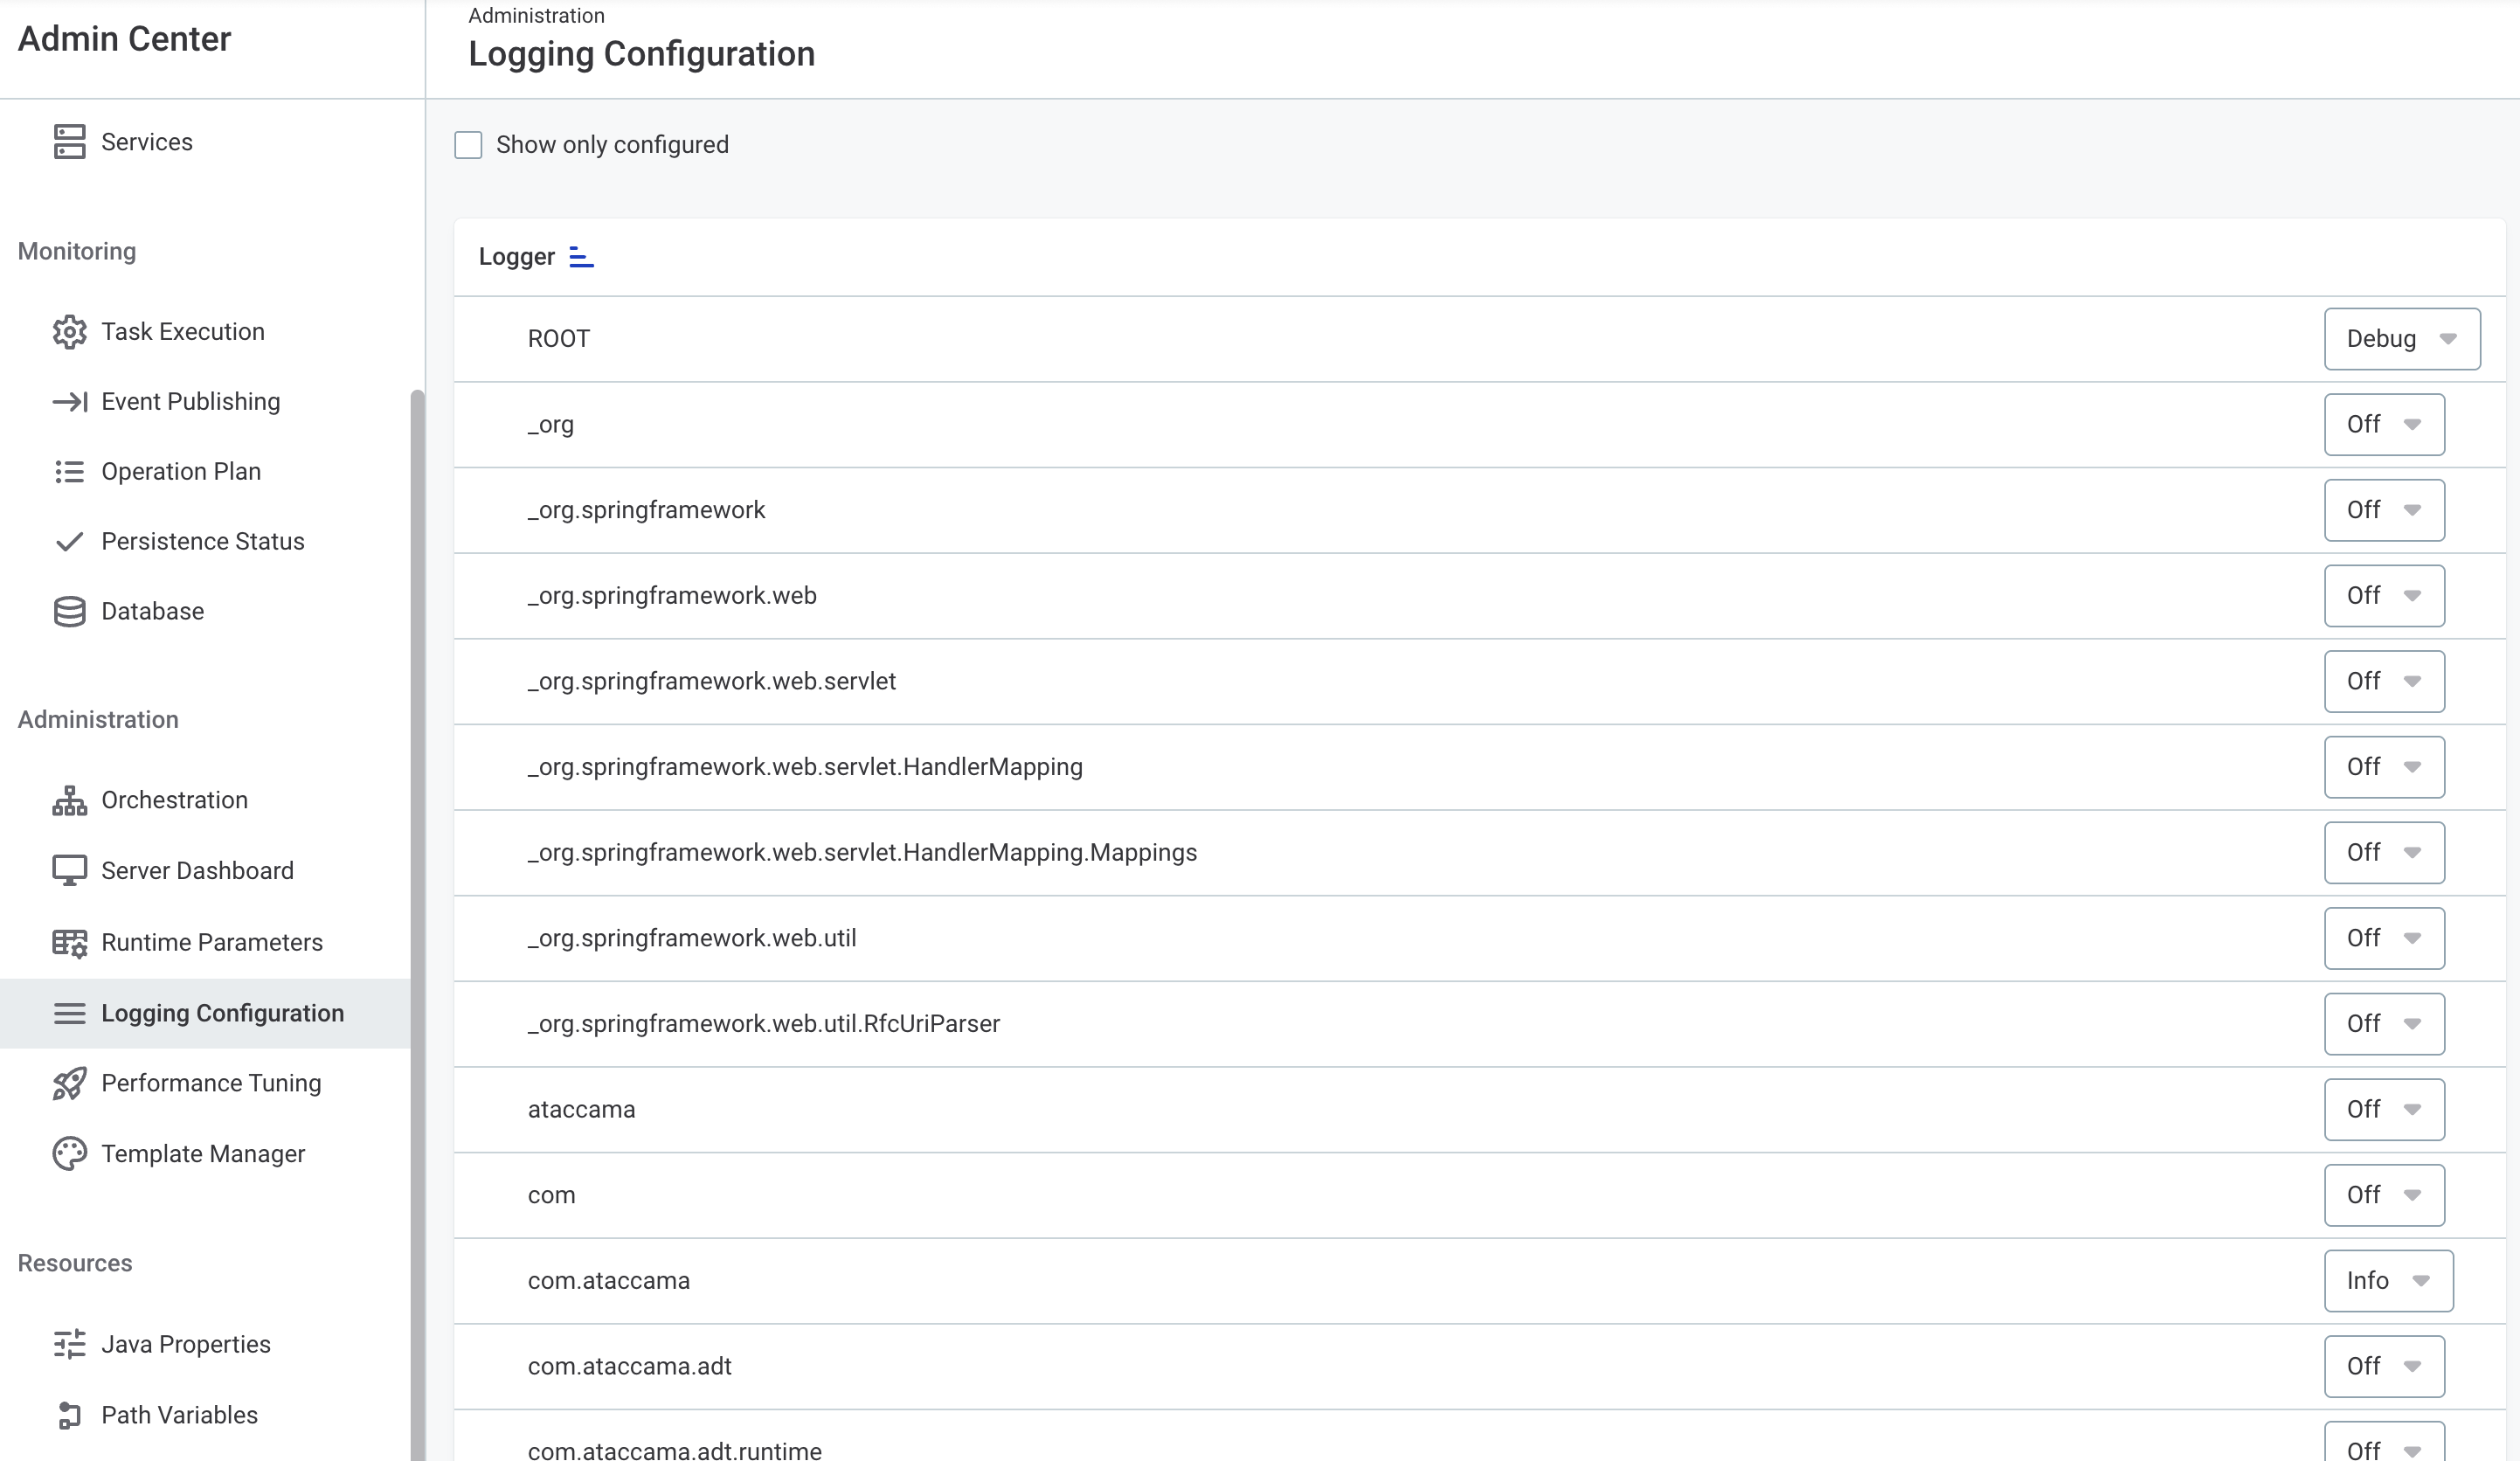
Logging Configuration
This section allows you to dynamically adjust logging levels for issue identification and debugging purposes. These changes are temporary and are not kept after the application is restarted.
To filter the currently applied settings, select Show only configured.
To be able to perform Logging Configuration actions, you must have the role defined by the ataccama.one.mdm.admin-center.manager.required-roles MDM Server application property.
See MDM Admin Center permissions.
|
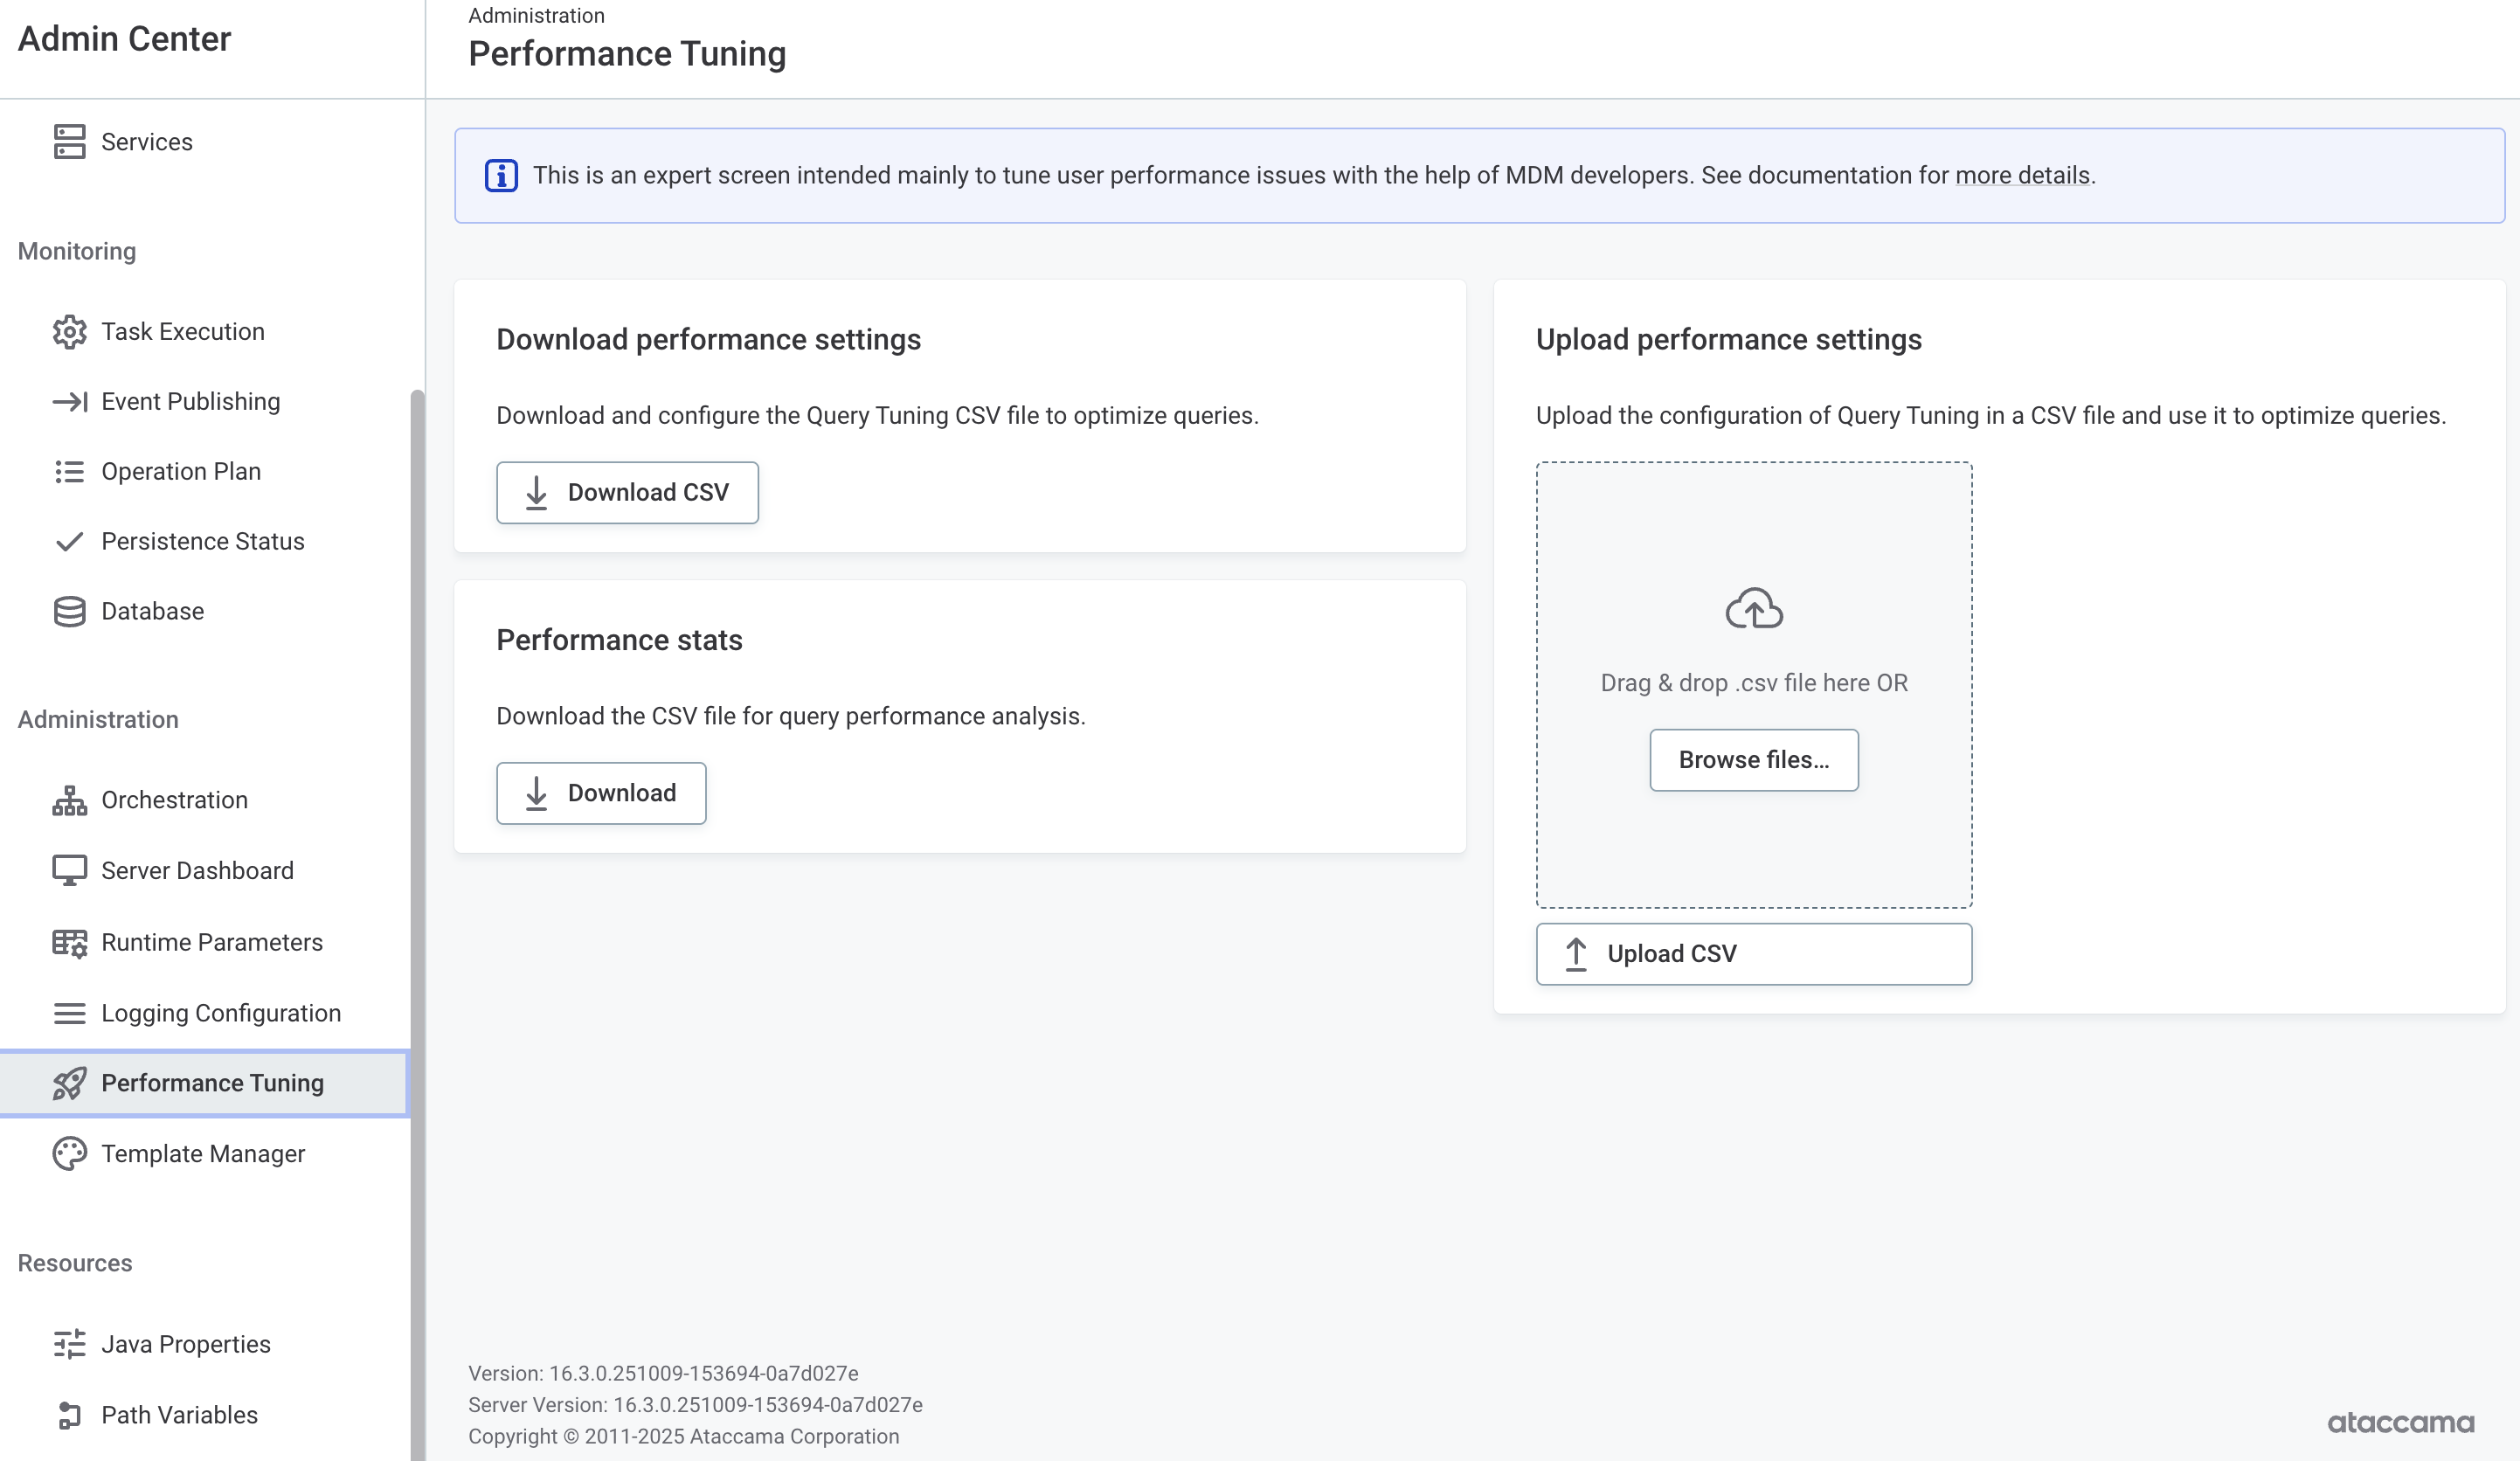
Performance Tuning
This section allows you to download and upload performance settings as well as download performance statistics. It helps optimize and monitor the performance of SQL queries in the application, allowing developers to make the necessary adjustments to enhance overall performance.
| Performance tuning is only available for PostgreSQL databases. |
To optimize the performance of SQL queries:
-
Select Download CSV to download performance settings.
Optionally, to detect queries that cause performance issues, download performance statistics as well: select Download under Performance stats.
-
Adjust the settings as needed in the CSV file.
-
In Upload performance settings section, drag and drop the modified file or use the Browse files option. To confirm your choice, select Upload CSV.
The configuration is now updated with the new settings.
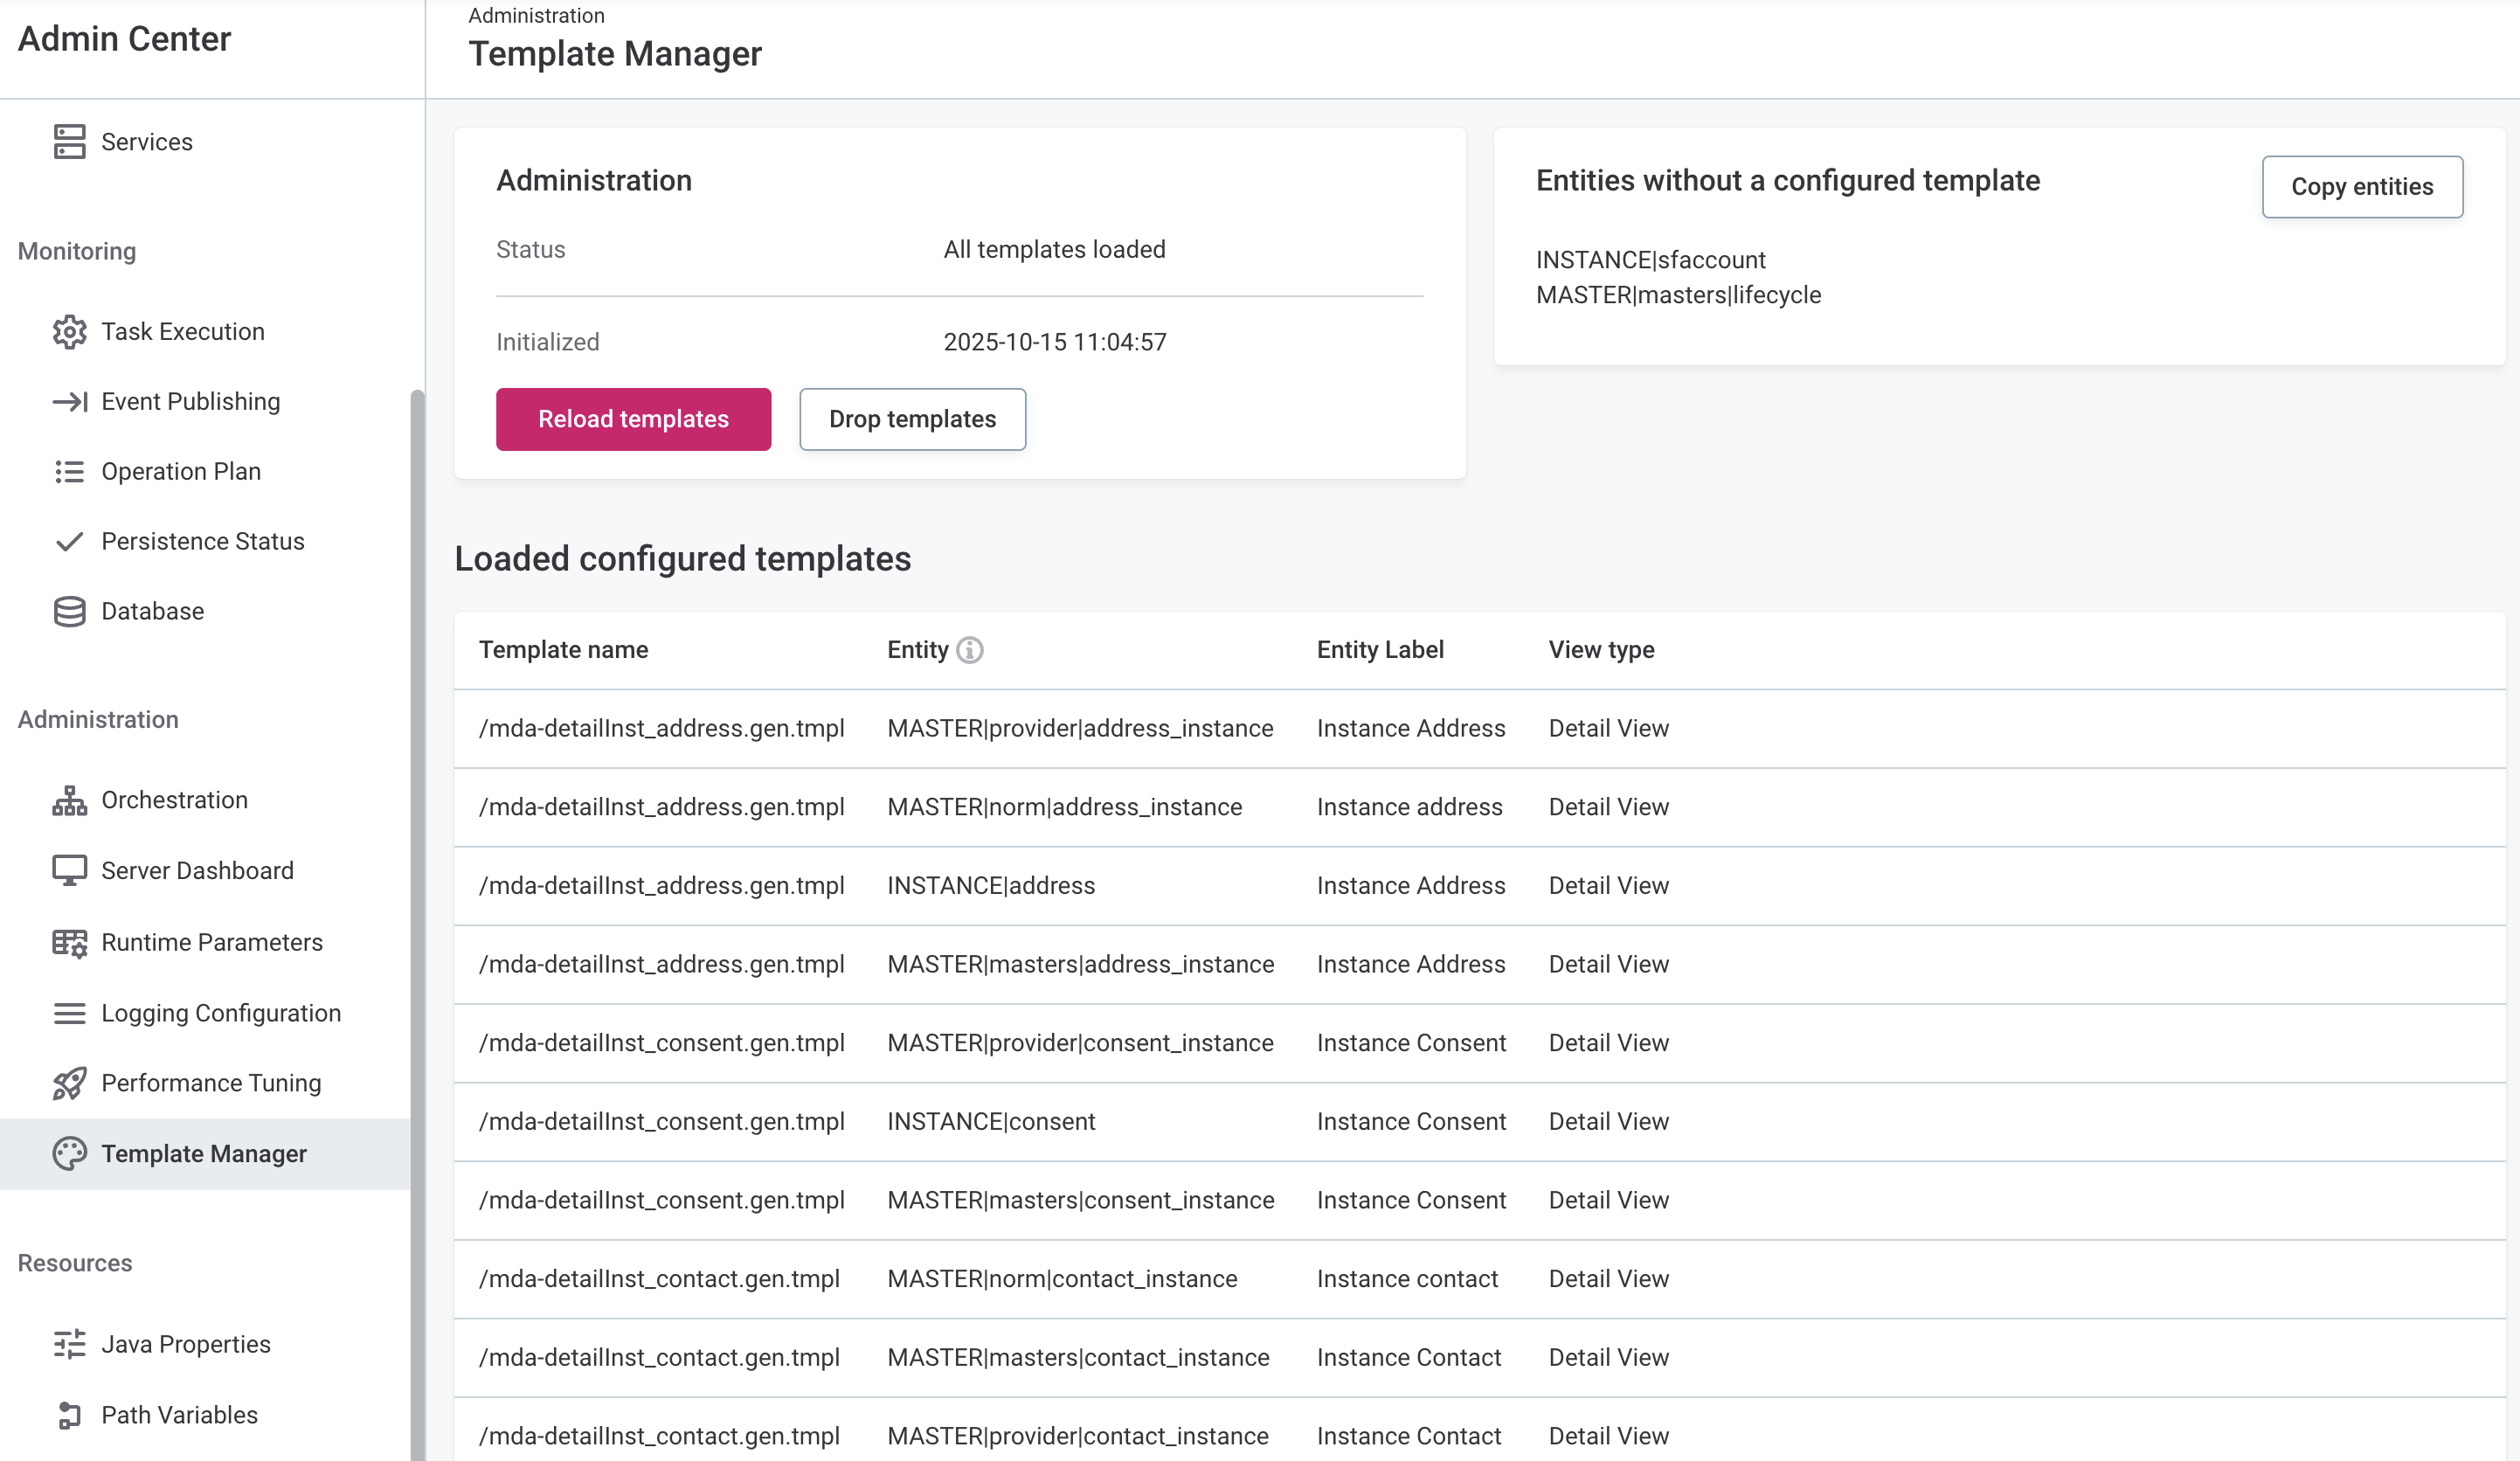
Template Manager
This section displays the template status, error log, a list of loaded templates, and a list of entities without a template.
Select Reload Templates to refresh templates, or Drop Templates to revert to standard templates.
You can also copy entities without a configured template (Copy Entities).
Was this page useful?