
Monitoring
The Monitoring section in the MDM Web App Admin Center allows you to:
-
Browse the details of task execution, event publishing, and load operations.
-
Download logs related to the database and database configuration.
-
Change several logging settings.
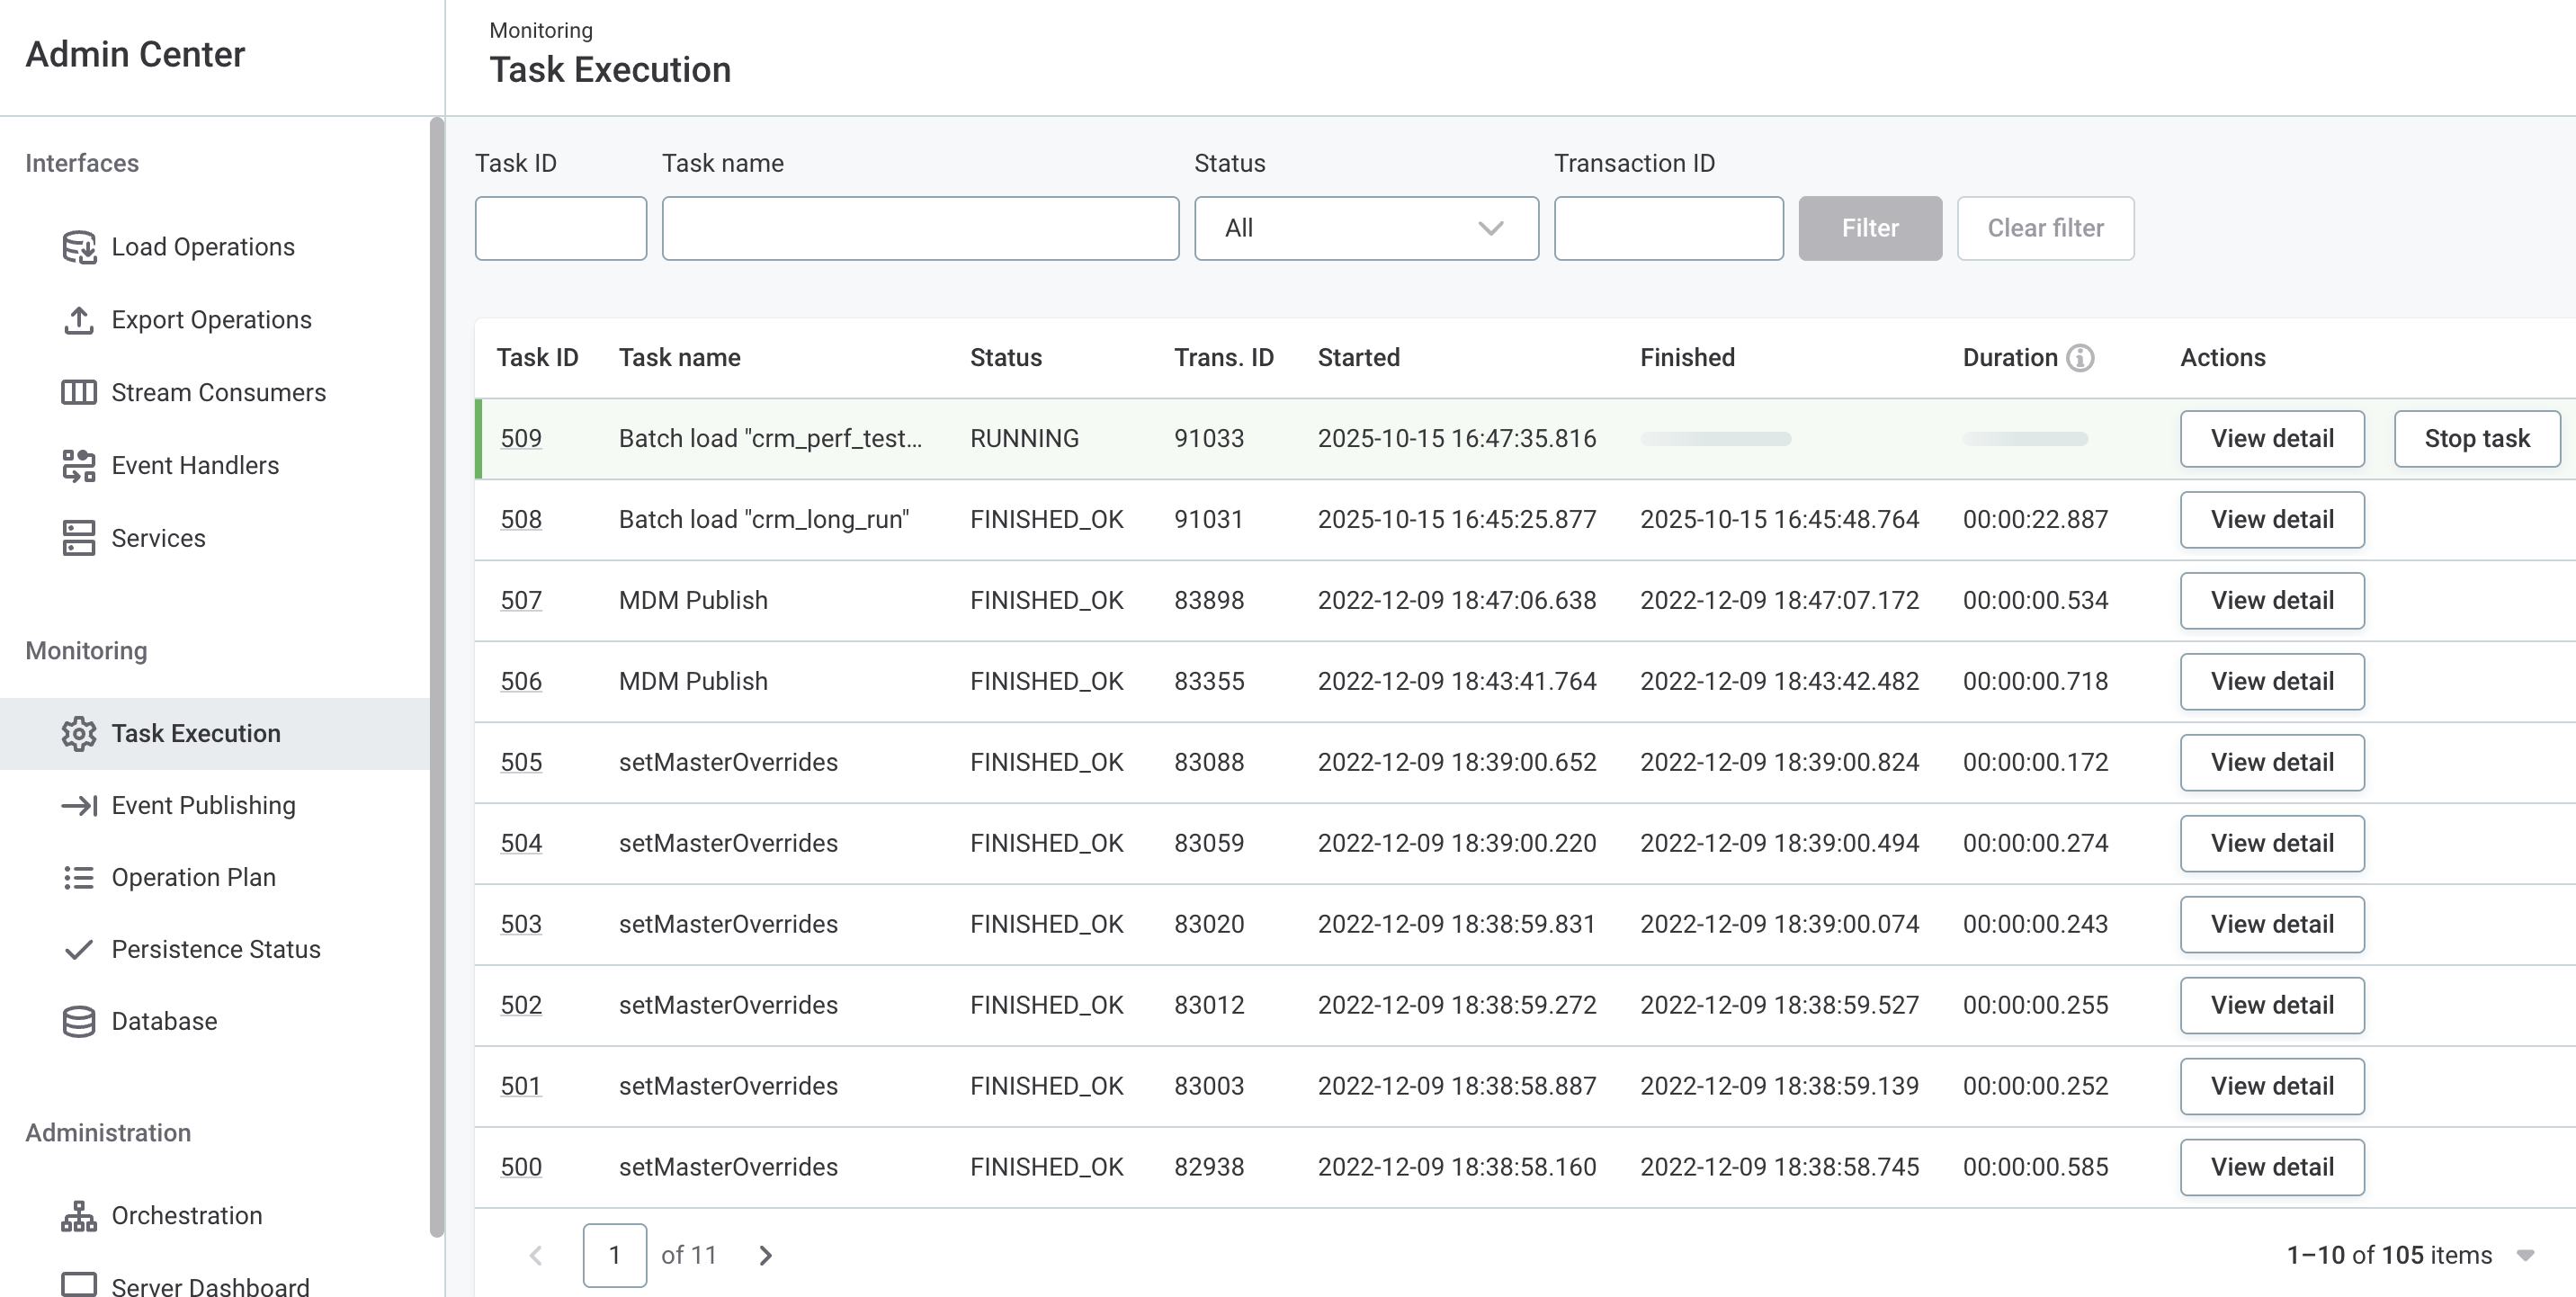
Task Execution
Displays a list of all running, queued, and finished data processing actions, including user actions.
From here you can cancel or stop a task, or view task details. For task details, select the task ID or View Detail.
Cancel task
From the Task Execution tab, you can also cancel a queued task (task status WAITING).
This removes the task from the queue and updates the task status first to CANCELING and then to CANCELED.
Select Cancel, then confirm your choice when prompted.
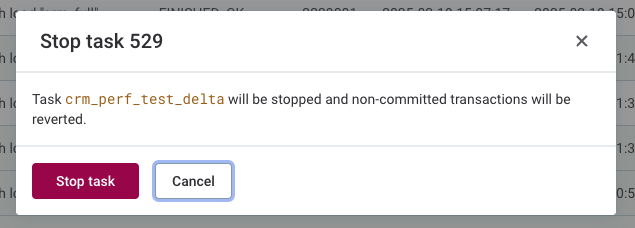
Stop task
To stop a running task, select Stop task, then confirm your choice when prompted.
This reverts all transactions that have not yet been committed and updates the task status first to STOPPING and then to STOPPED.
In addition, it also stops any running transformation plans and database interactions related to the given task.
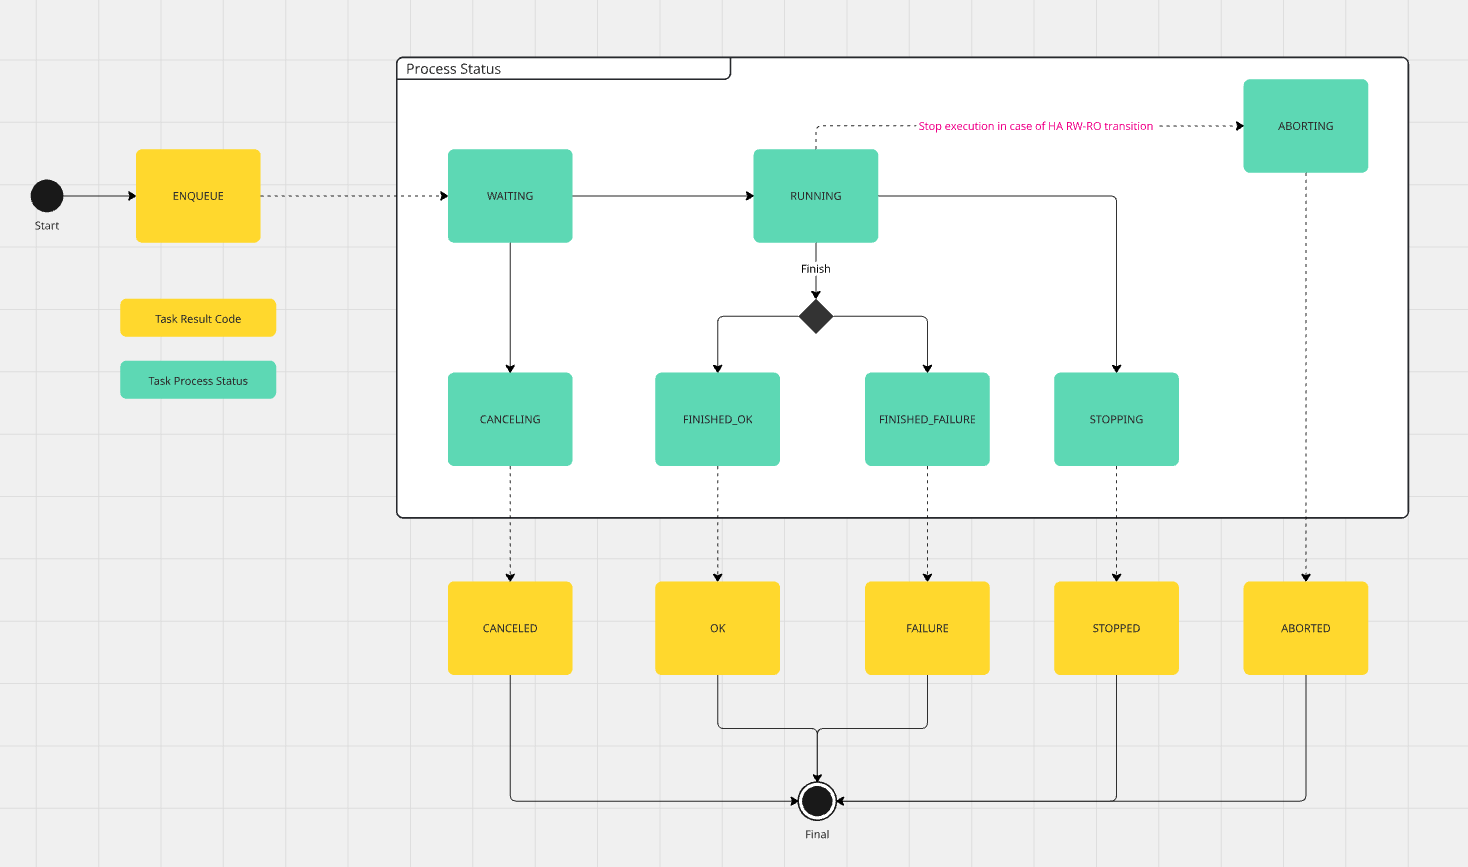
Task status
A task can be in one of the following states.
| Status | Description |
|---|---|
WAITING |
Waiting in the processing queue. |
RUNNING |
Currently being executed. |
FINISHED_OK |
Successfully completed. |
FINISHED_FAILURE |
Completed with a failure. |
ABORTING |
In the process of being stopped but not yet fully terminated. Occurs when high availability (HA) RW-RO mode is used. |
ABORTED |
Successfully stopped and no longer running. Occurs when high availability (HA) RW-RO mode is used. |
STOPPING |
In the process of being stopped but not yet fully terminated. |
STOPPED |
Successfully stopped and no longer running. |
CANCELING |
In the process of being canceled by a user before it could be executed. |
CANCELED |
Canceled by a user before it could be executed. |
To get a better idea of how tasks transition between different statuses, see the following diagram. The Task Result Code in the diagram represents the final status of the task, while Task Process Status refers to the status of the process that is executing the task.
Task details
The task detail screen provides further information, including the list of subtasks, their start and finish times, the number of processed records per second, and the subtask result.
Any subtasks that are in progress are shown expanded by default, including nested subtasks. This gives you a better overview of the tasks in progress and their execution details at a glance.
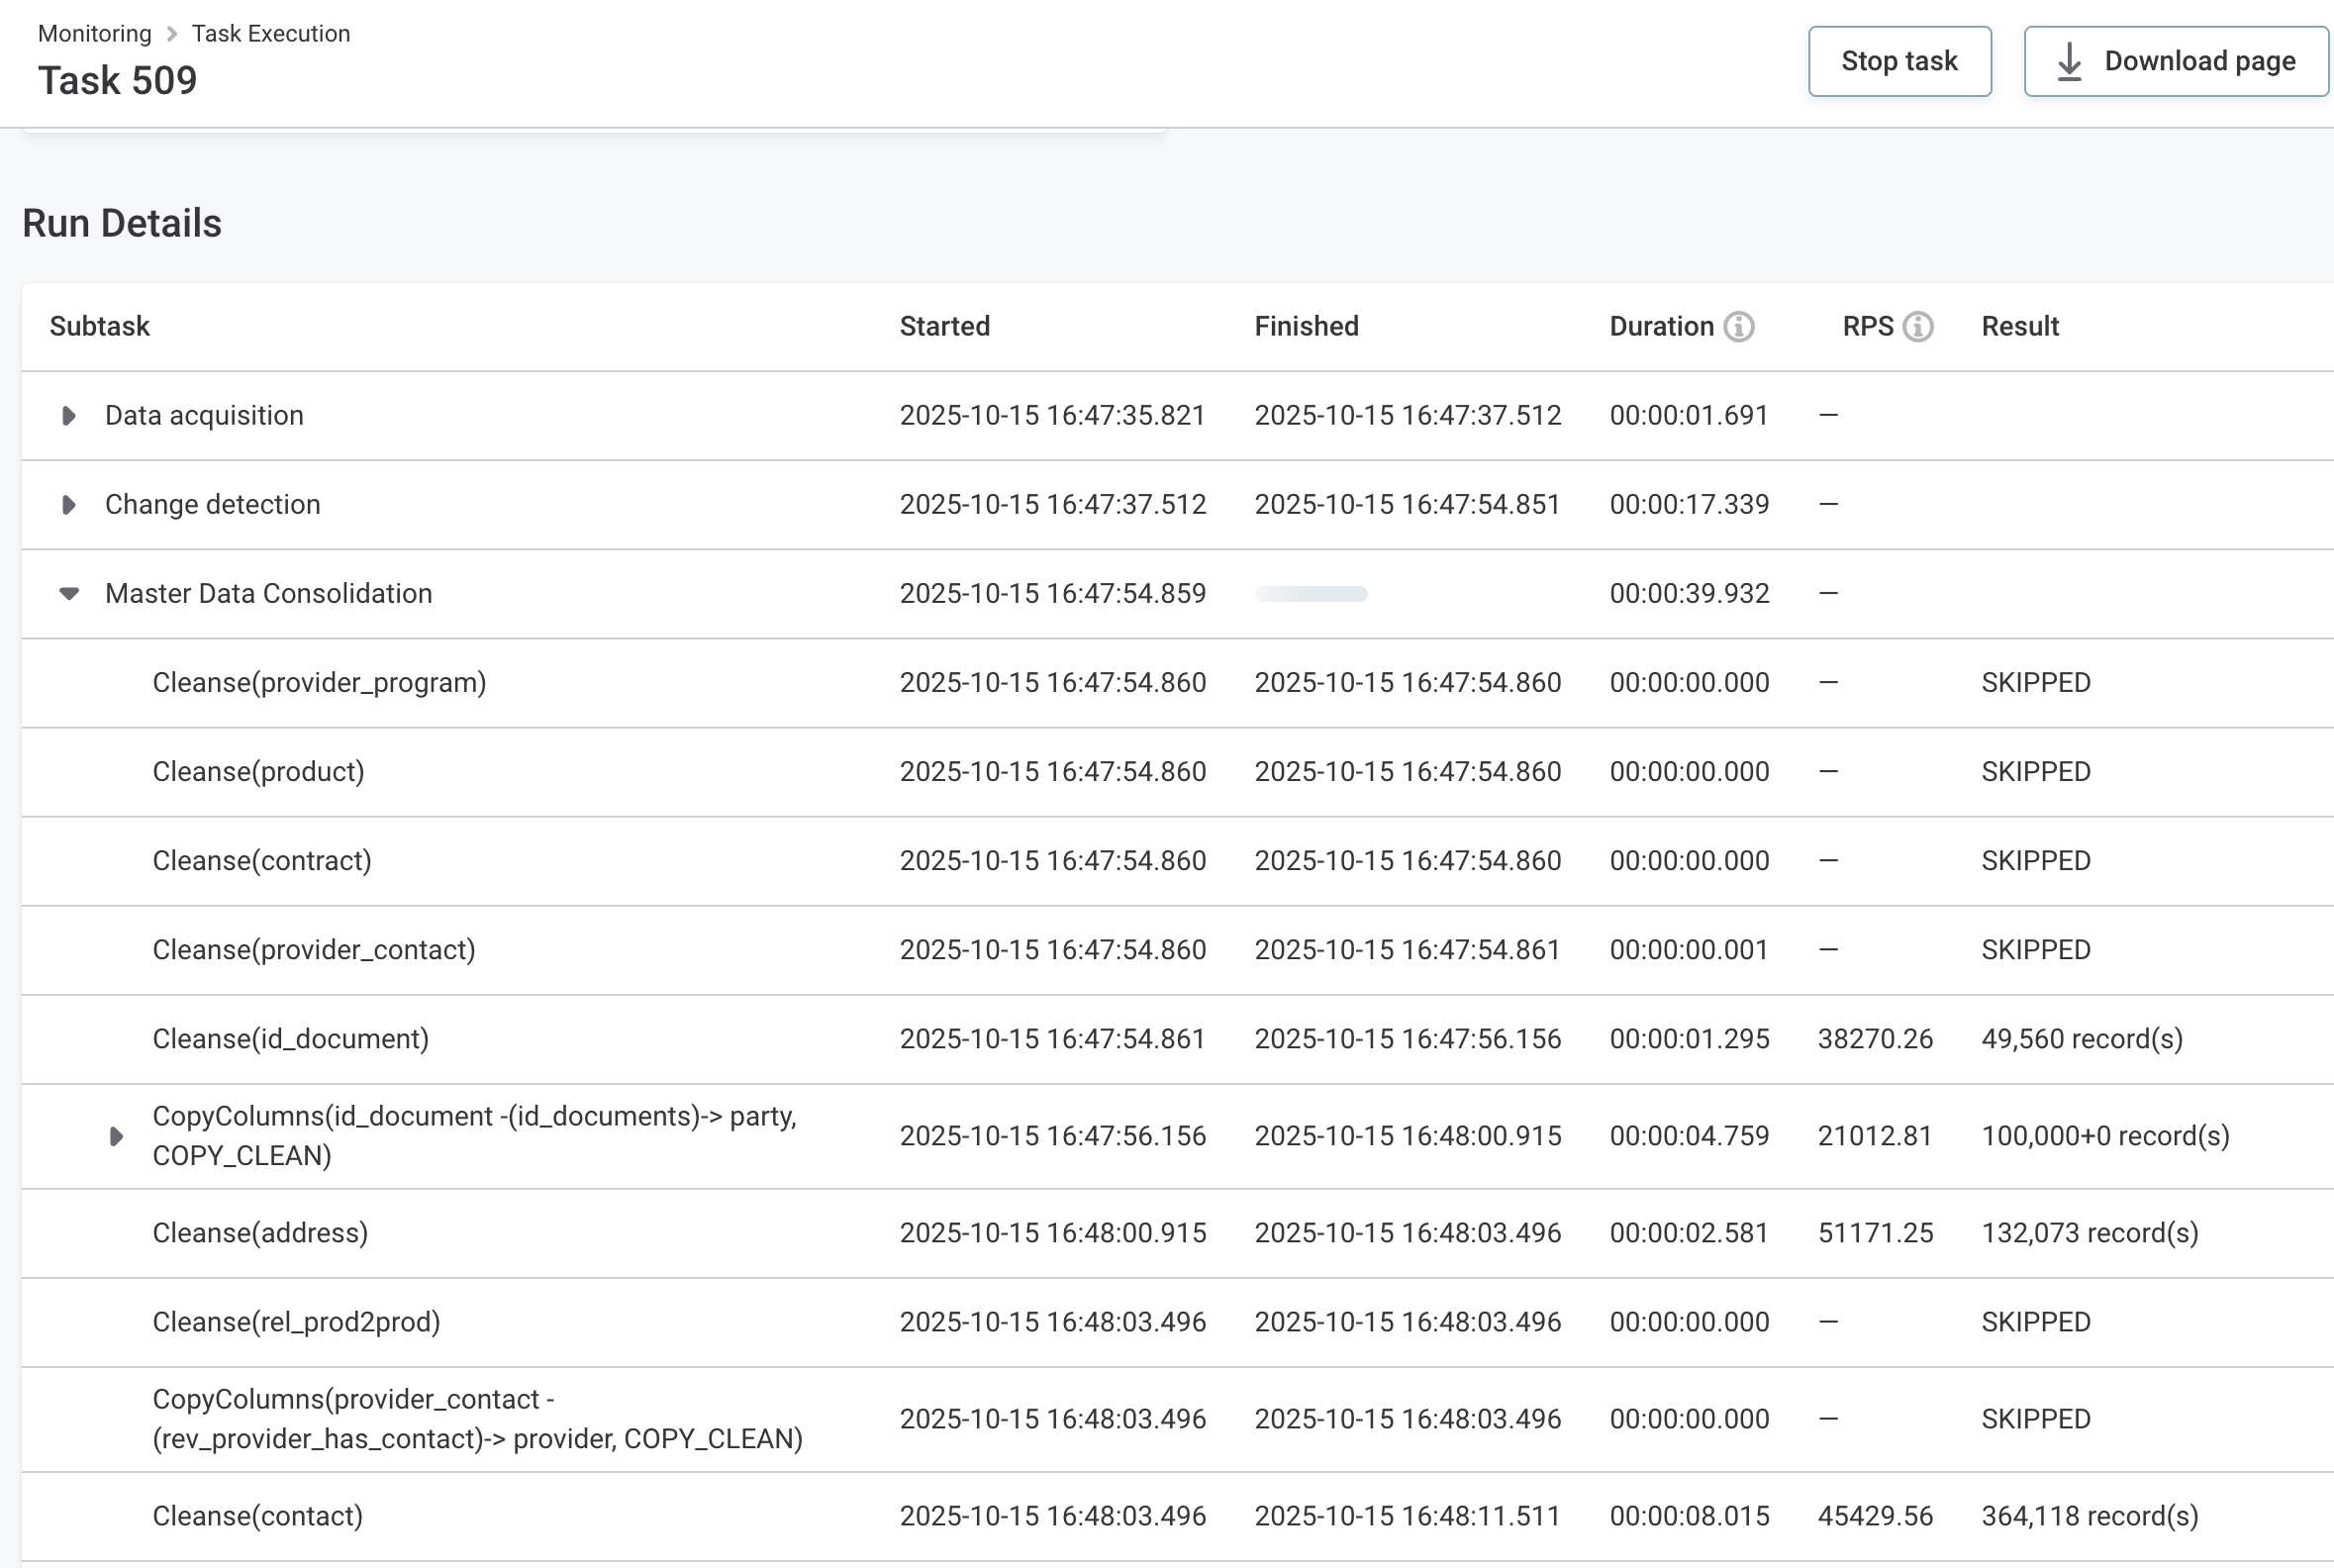
From here, you can also export and save the task execution details in a single HTML file.
Select Download this page.
The file name is nme-task-report-{taskID}.html.
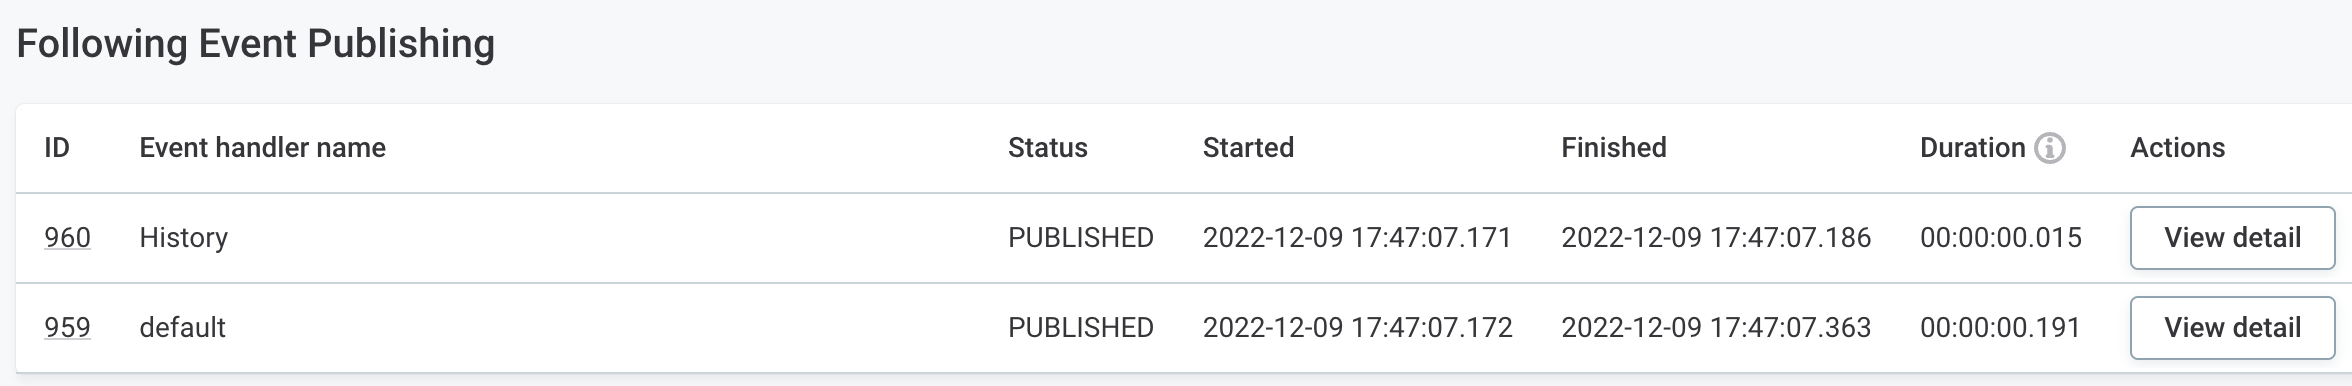
At the end of the page, you can find a list of related instances of event publishing.
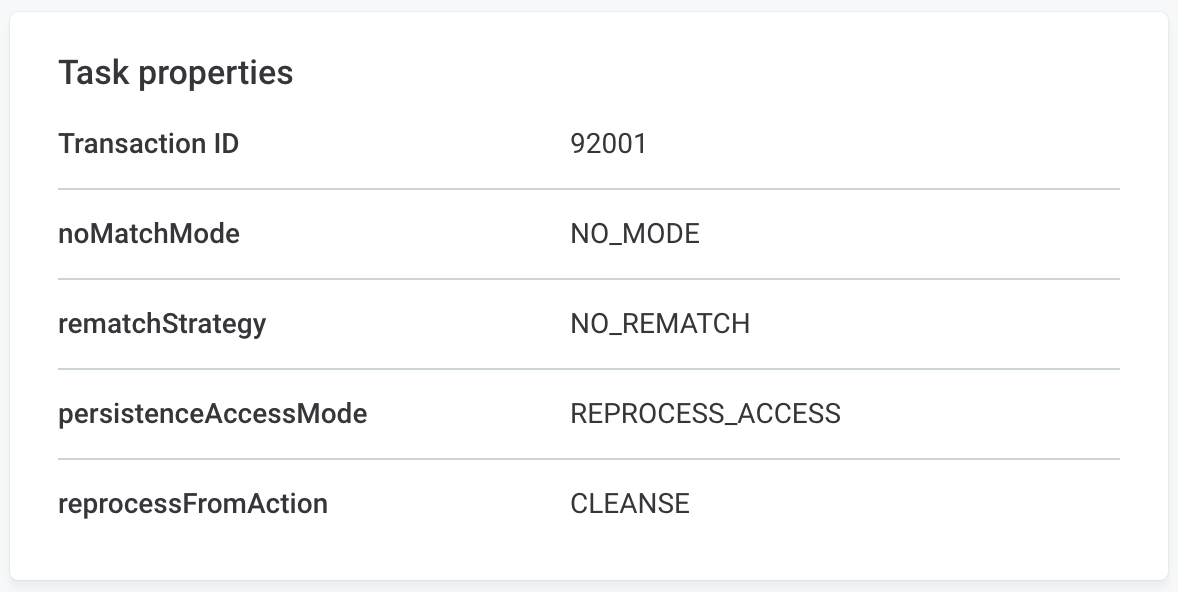
The task detail also includes a Task Properties section that records any settings used when the task was started, such as overrides applied before running a reprocess operation (see Load Operations).
Subtask result examples
| Result | Description |
|---|---|
|
Number of changed records, total number of incoming records (change detection). |
|
Number of records at the start of a task (cleanse, validate, commit). |
|
Related records processing. |
|
Number of records at the start of a task + number of records affected by processing (match, aggregate, copyColumns). |
|
Number of records at the start of a task + number of records affected by processing → number of record at the end of the task (merge). |
|
Task was not executed. |
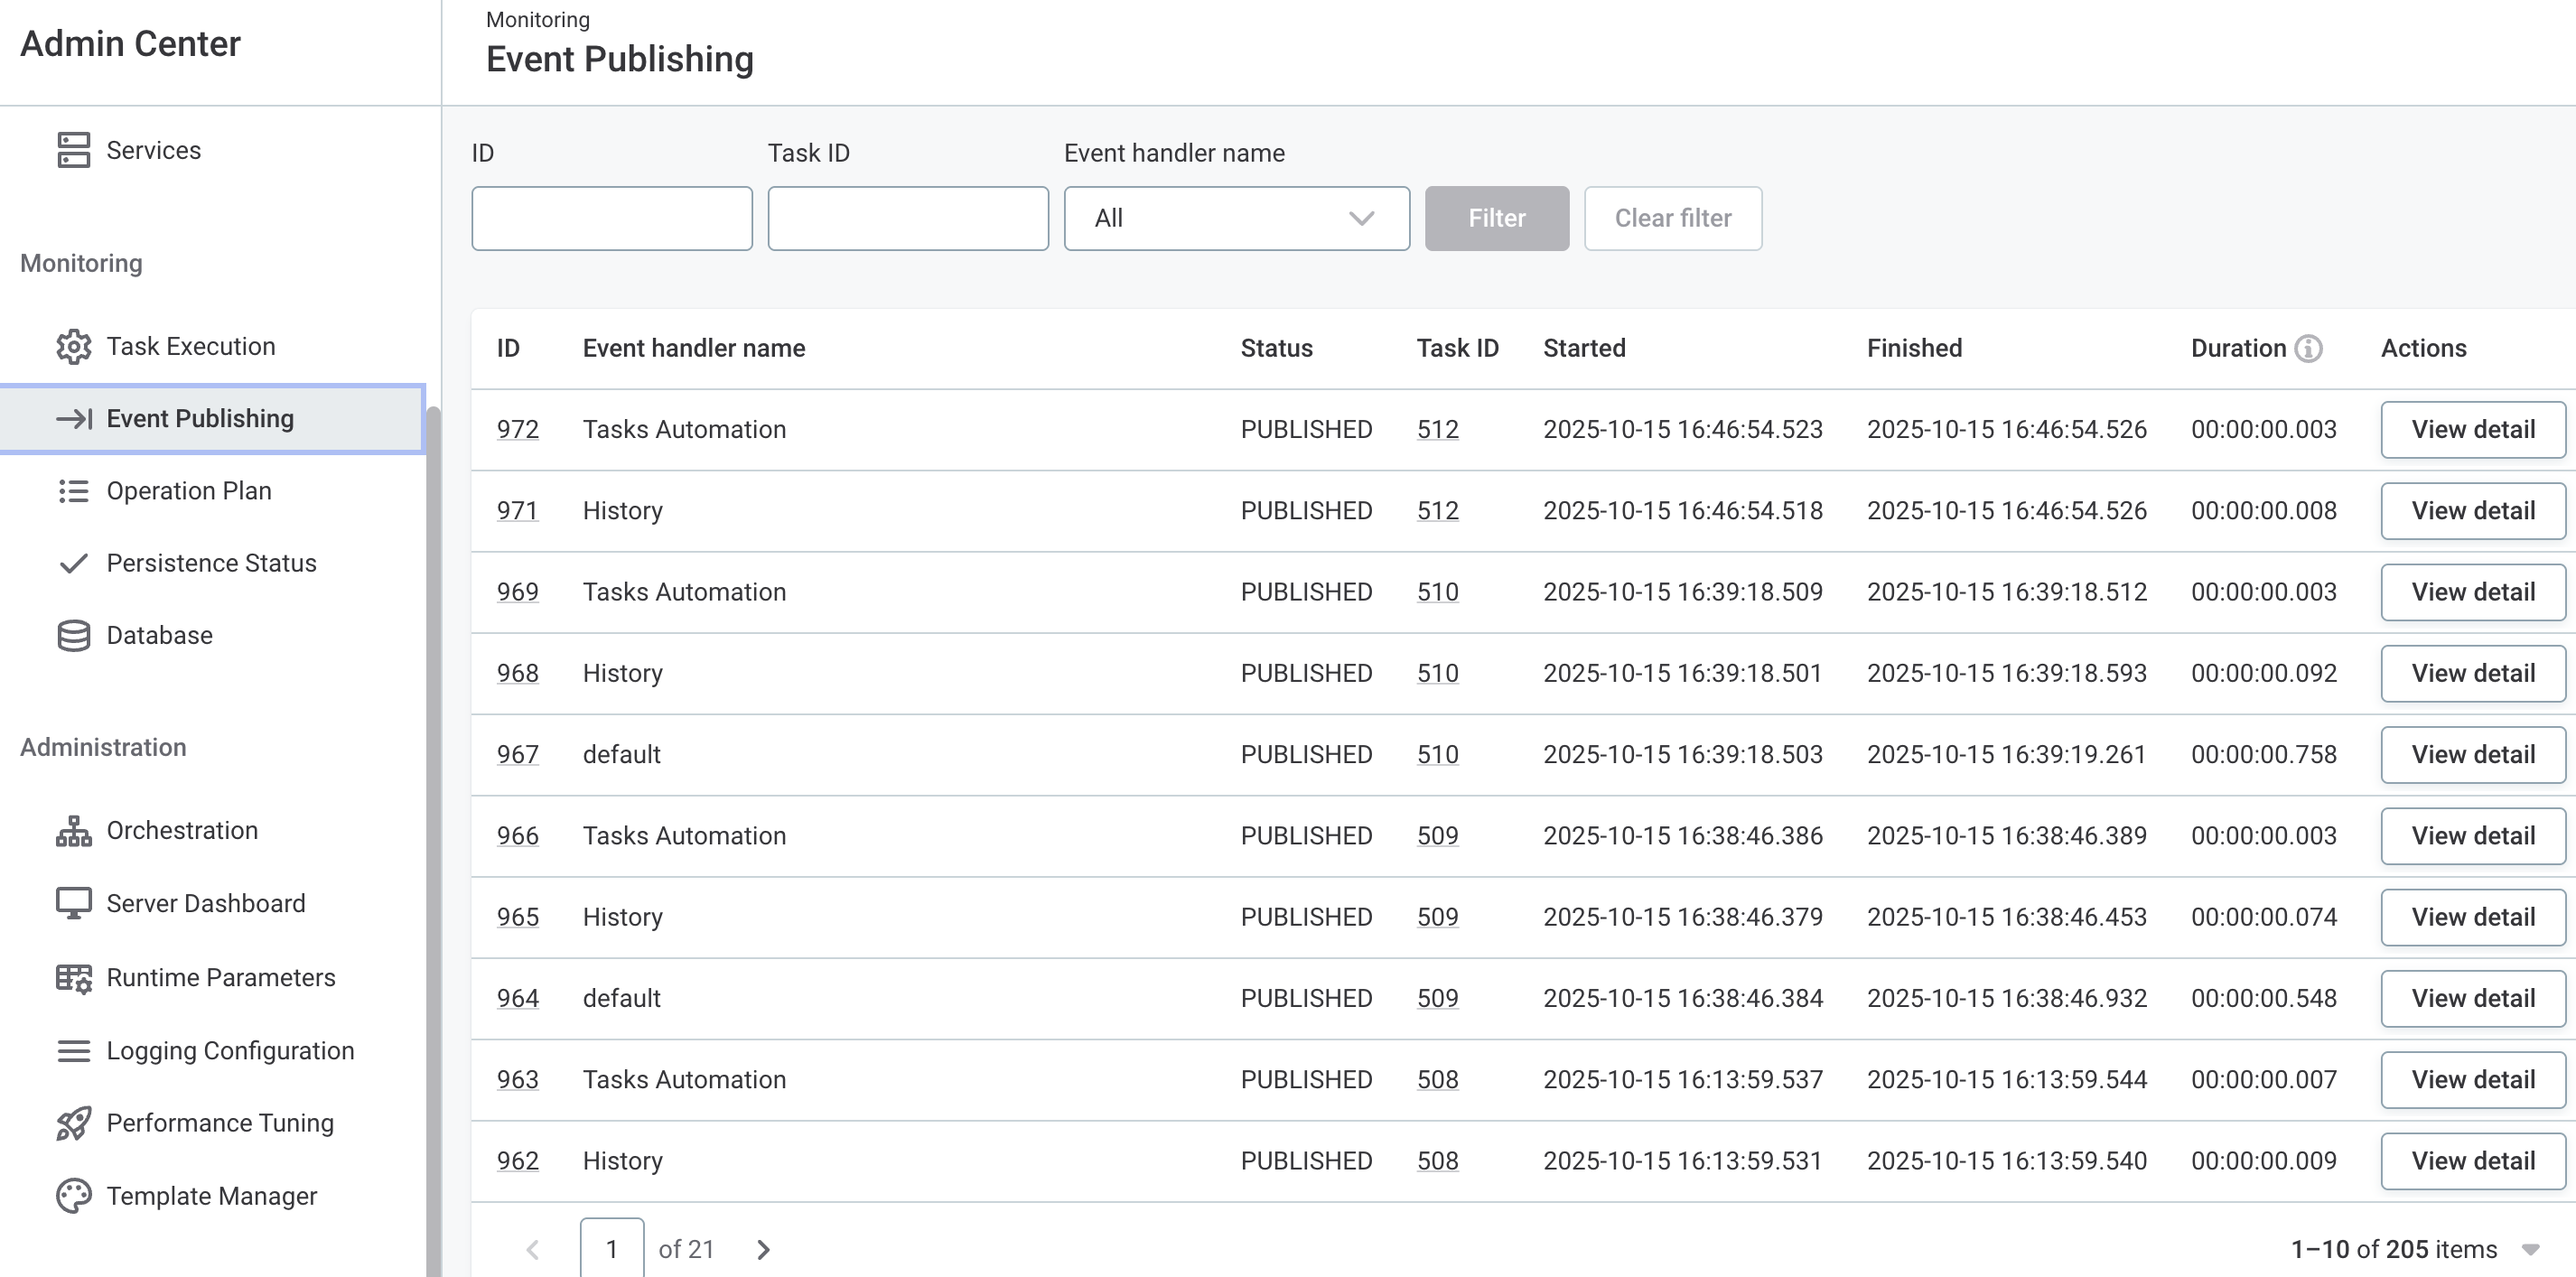
Event publishing
Displays a list of running and previously executed instances of event handler publishing. For details, select the processing ID in the first column or View Detail.
To view the parent task, select the Task ID.
Event publishing status
| Status | Description |
|---|---|
RECEIVING |
Receiving events from an ongoing transaction. |
READY |
Ready for publishing. When streaming is used, this indicates the events are saved in the database queue and are waiting for the publishing trigger (size or time). |
PUBLISHING |
Ongoing publishing process. |
PUBLISHED |
Publishing is finished. |
CORRUPTED |
Temporary files are corrupted. |
CRASHED_RECEIVING |
MDM processing or Event Handler failed - temporary files will be removed. |
CRASHED_PUBLISHING |
Publishing was not successful. When the publisher is activated, publishing continues. |
Event publishing detail
To view details of a specific event publishing run, select the run from the event publishing list.
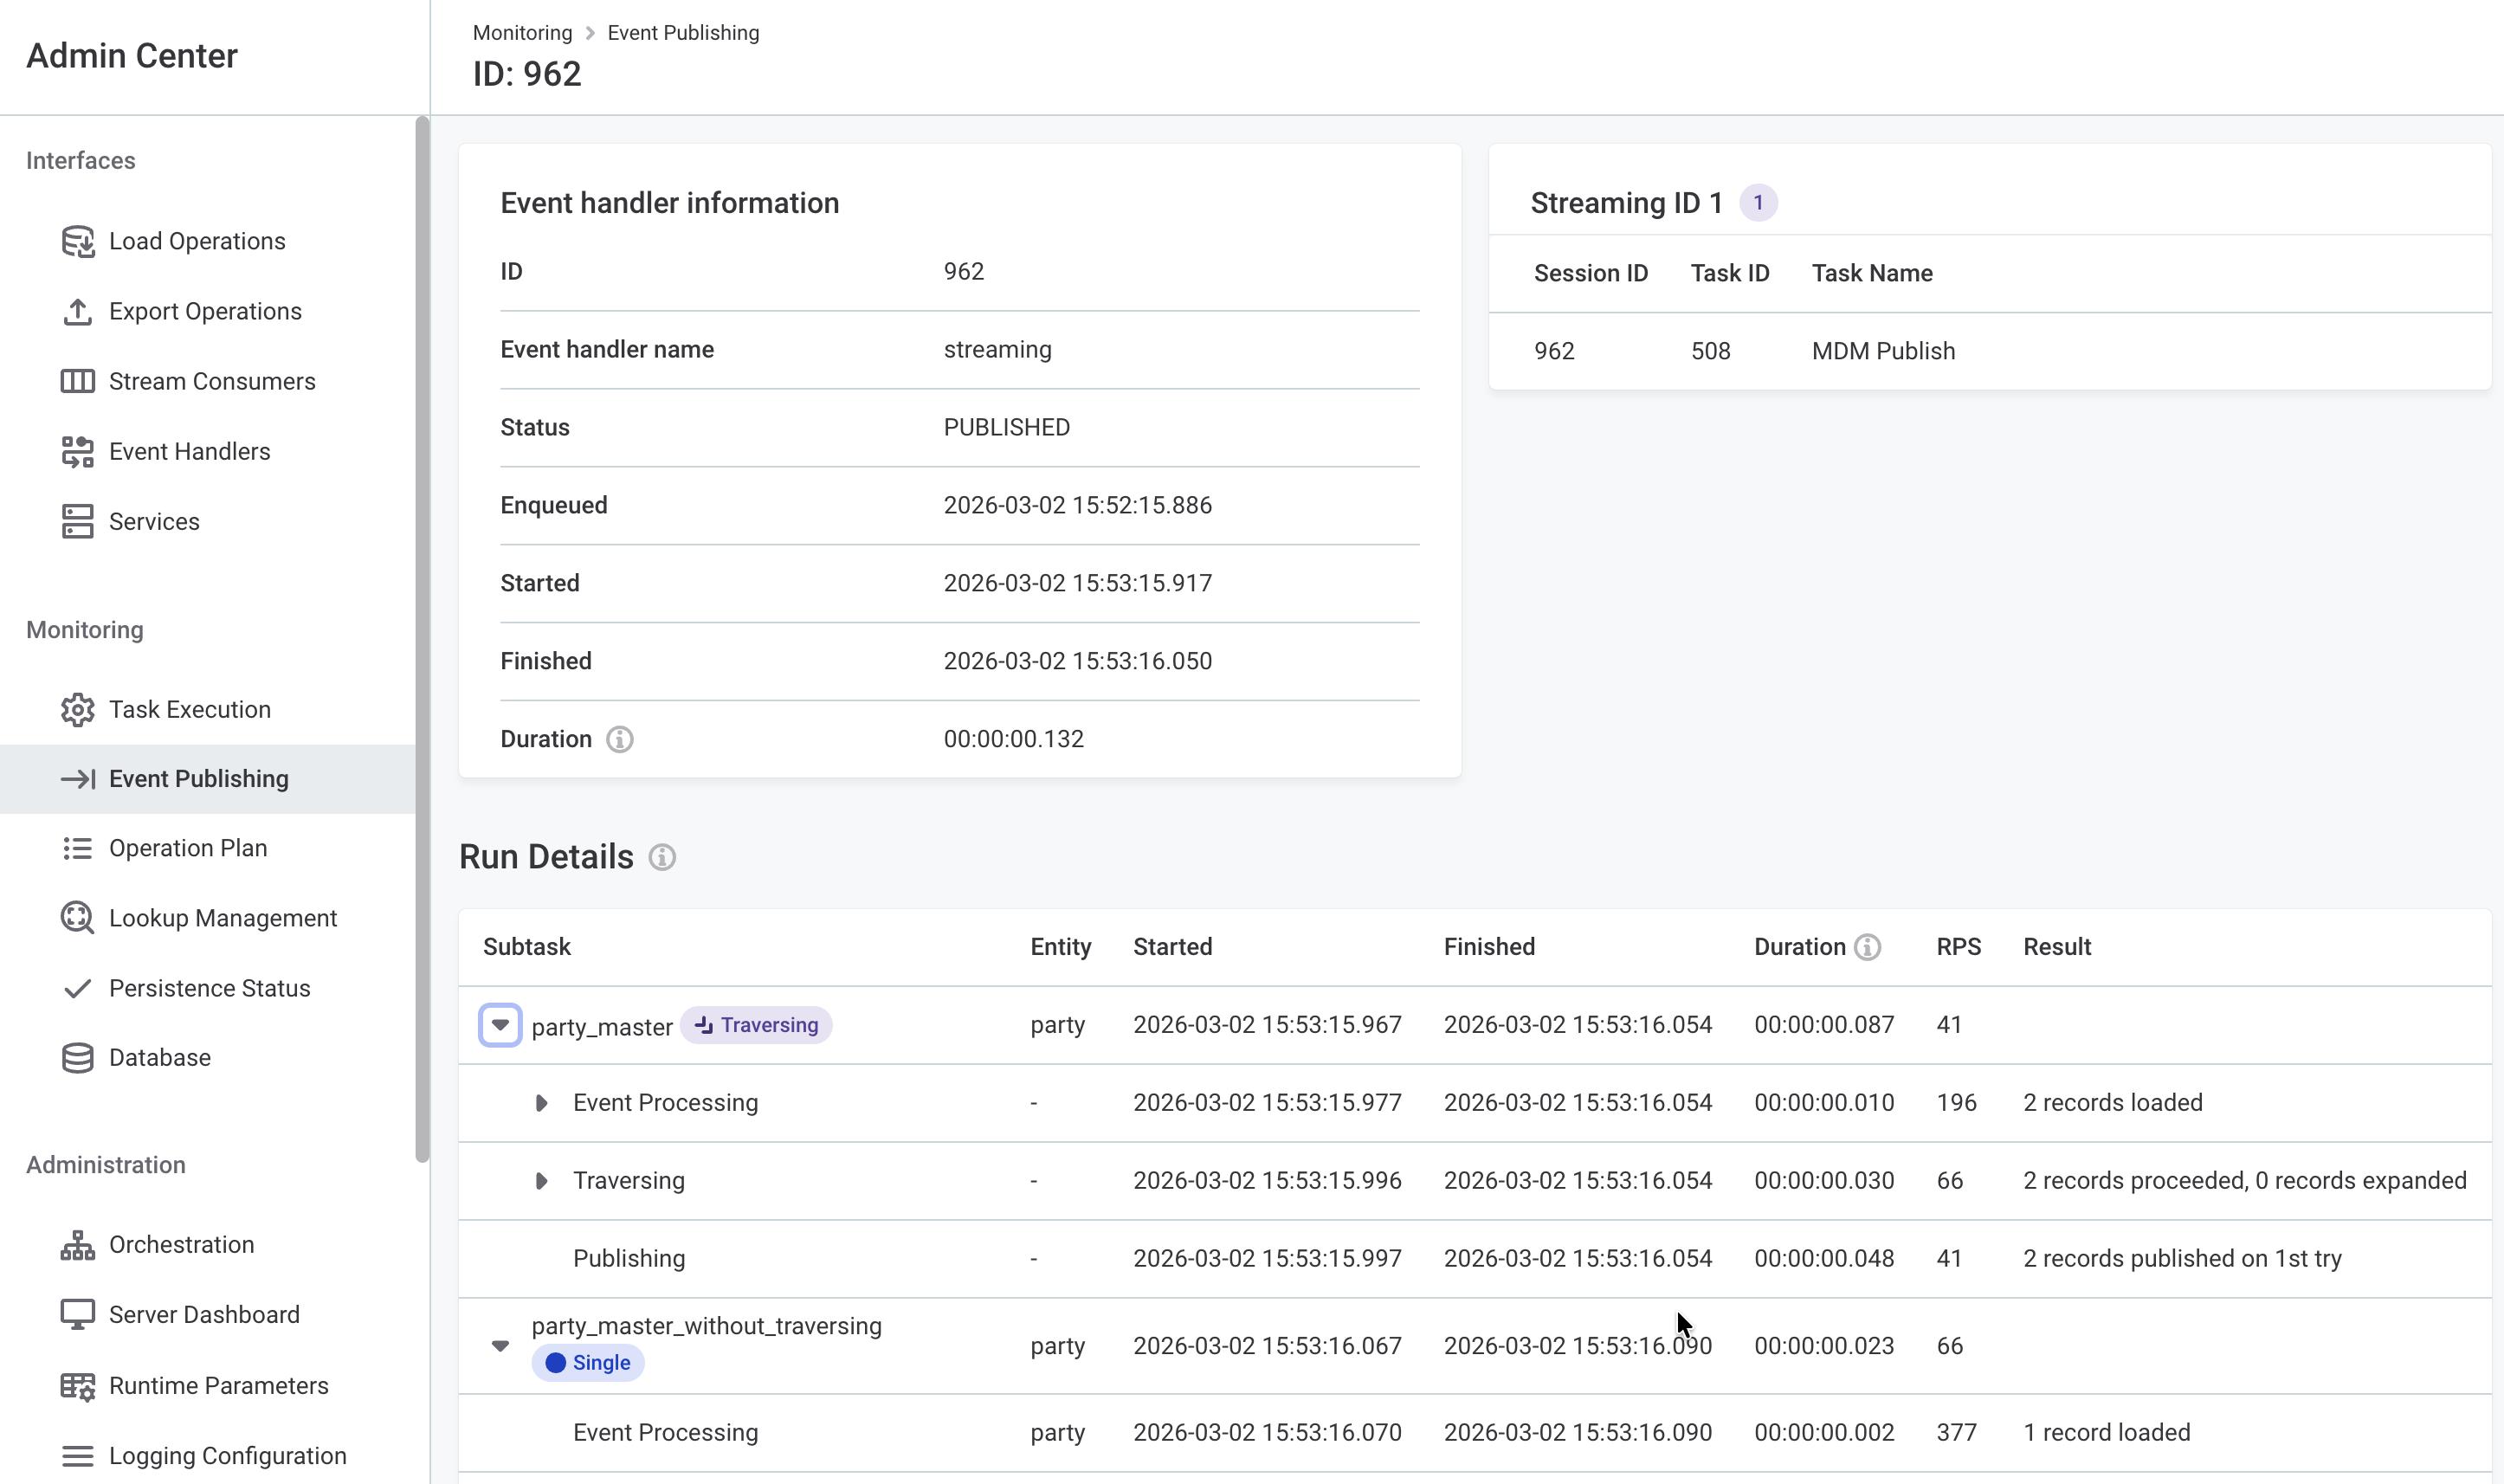
The detail view shows event handler information, timestamps, and processing results.
When streaming is configured, the detail view also includes a Streaming ID panel showing which sessions were grouped in the same batch. Multiple sessions from different transactions can appear under a single streaming ID if they were collected within the same streaming window.
The difference between the enqueued and finished timestamps represents the streaming latency.
| For more information about streaming concepts, see Streaming Event Handler > Monitoring and observability. |
The Run Details section shows a per-publisher breakdown of processing steps. Publishers are labeled as Traversing (configured with a data model that assembles complete data trees) or Single (processes individual entity records without traversing).
Each publisher can be expanded to show individual steps: event processing, traversing (if applicable), and publishing.
Operation Plan
Shows the order of load operations defined in the Model used as an internal workflow of the MDM engine. You can also download the operations list for use in Executor by clicking the link at the top of the page.
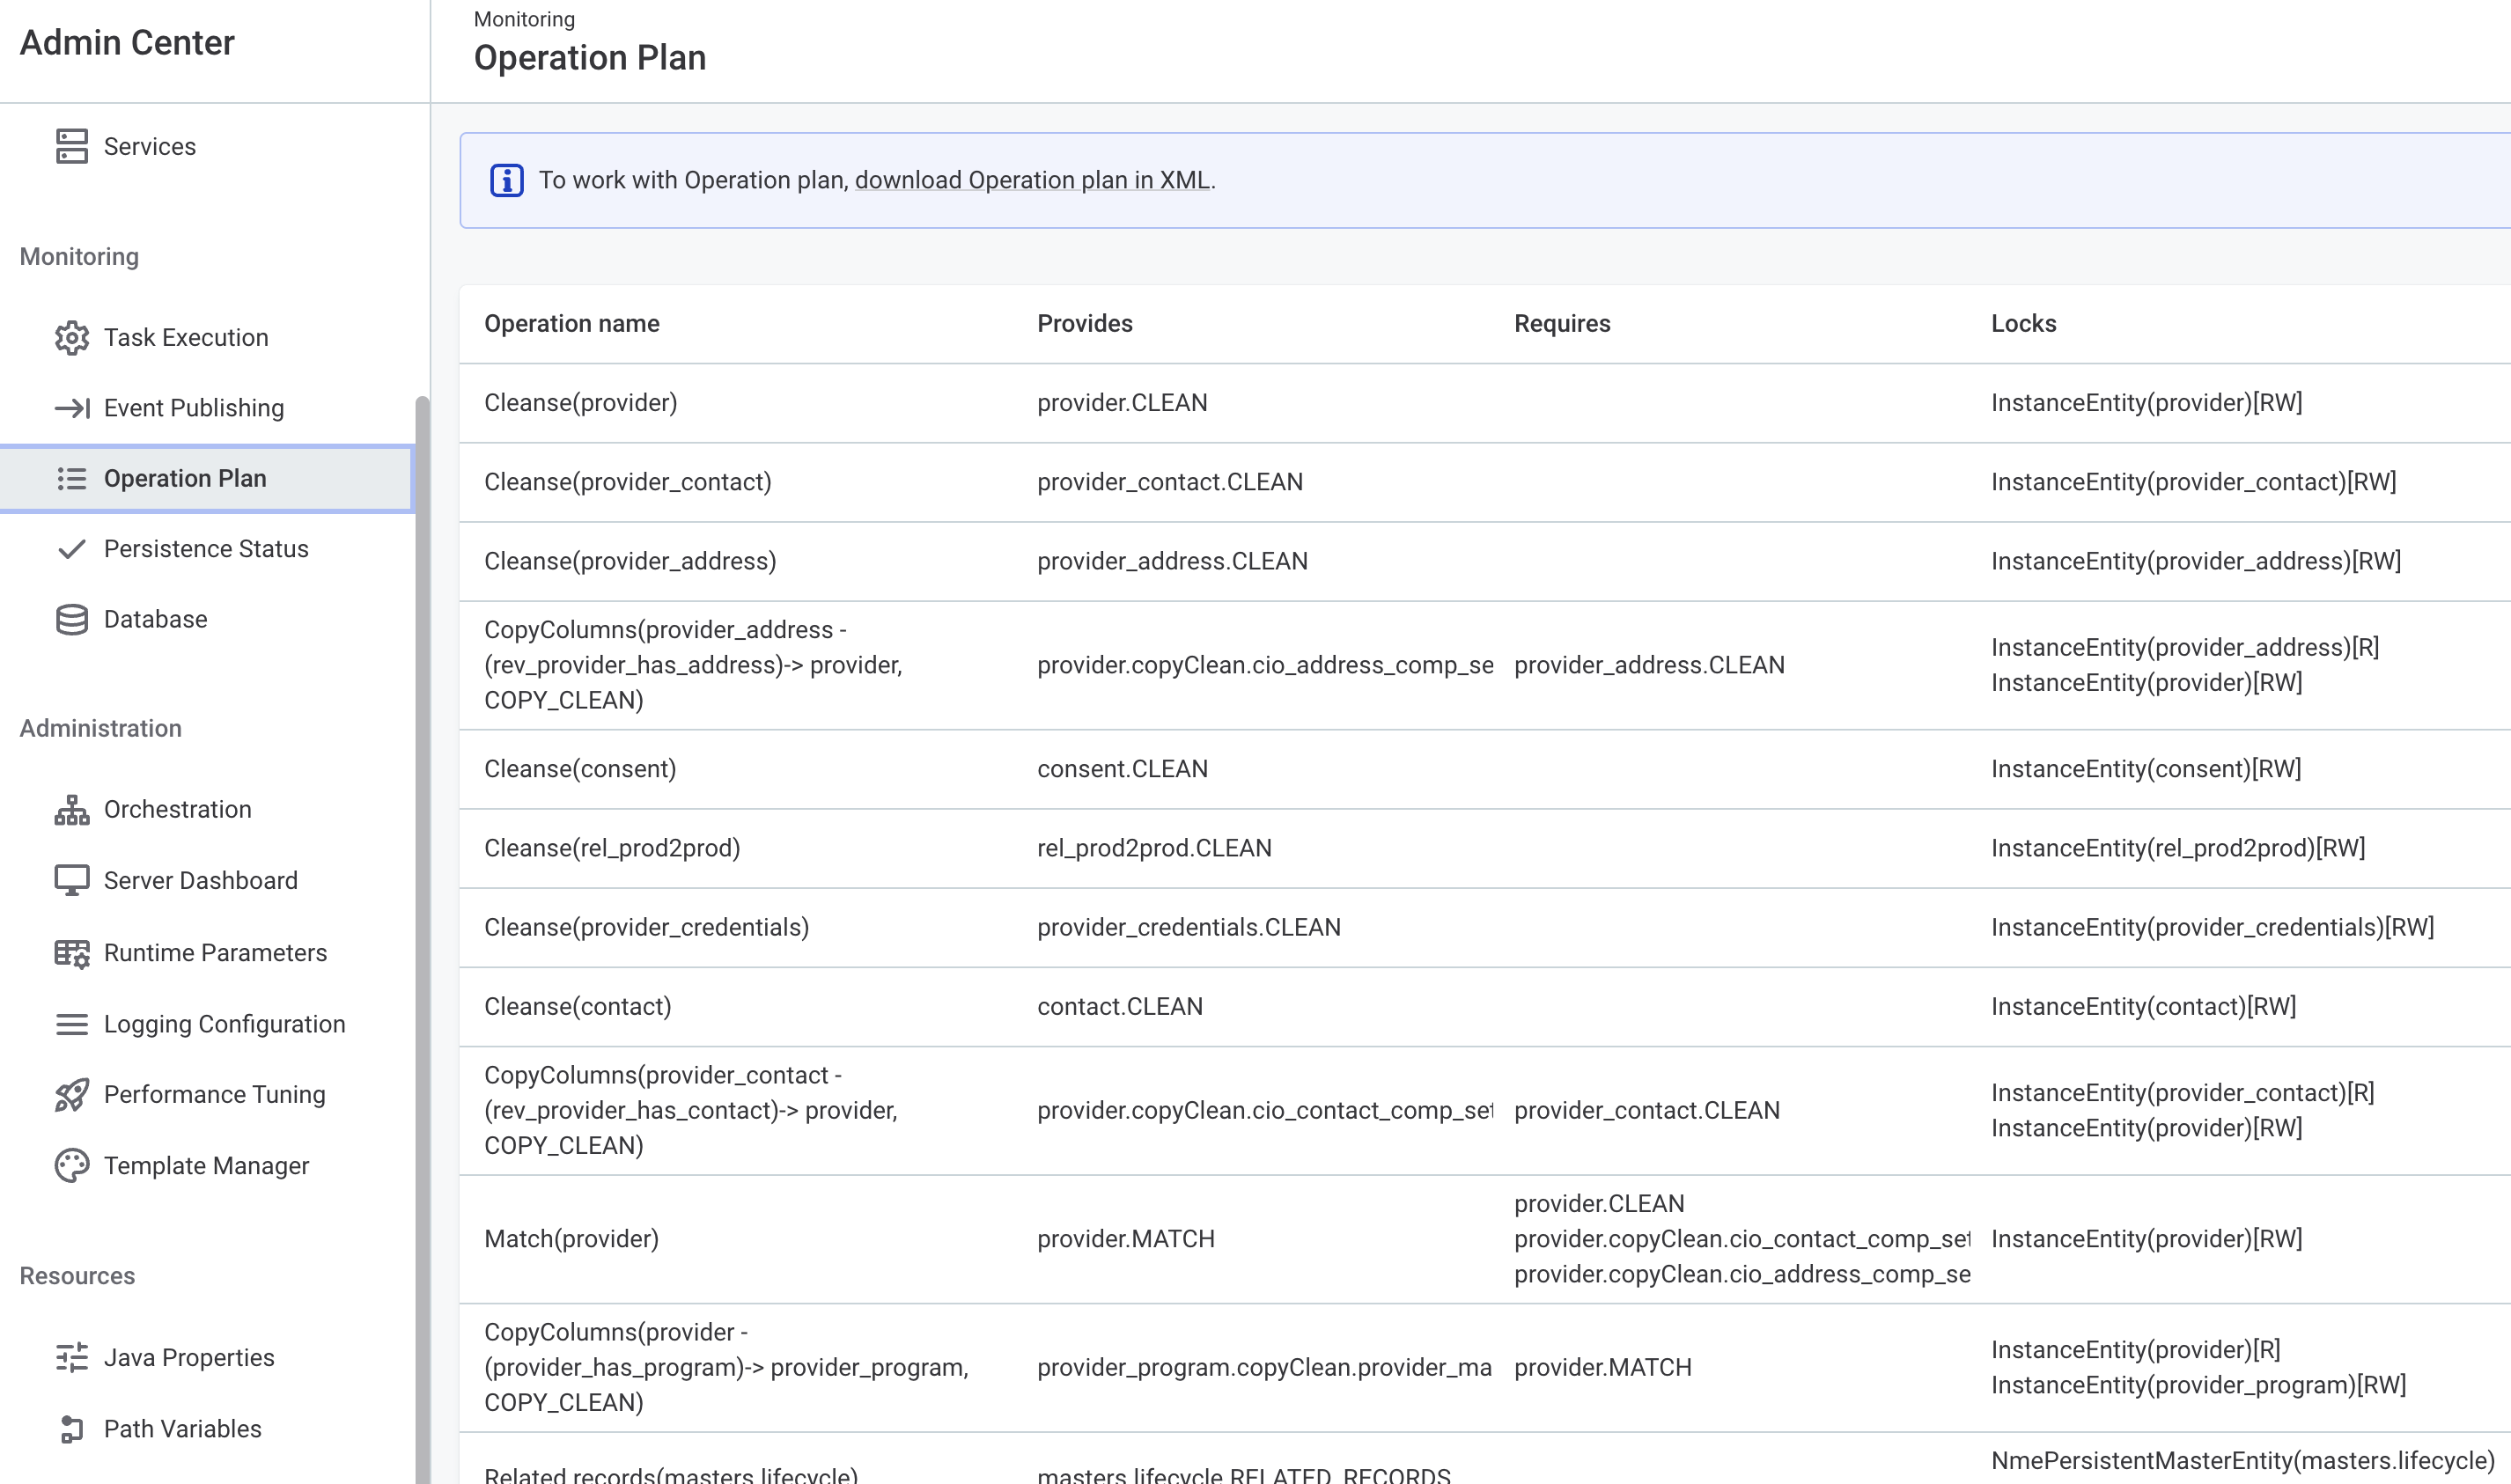
For each operation, the following information is provided:
-
Operation: Name of the operation.
-
Provides: Refers to the result of the operation.
-
Requires: Refers to the result of entity processing that must be completed before processing the current one.
-
Locks: Similar to database locks; useful for parallel processing (Read or ReadWrite access shown as well).
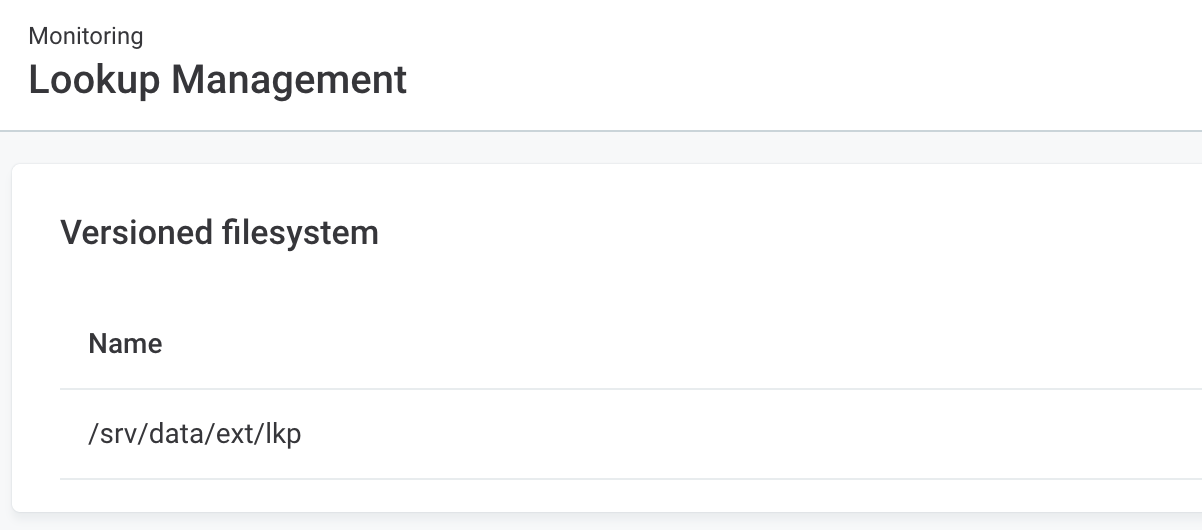
Lookup Management
Shows a list of versioned folders as configured in the server configuration (.serverConfig file).
Available if the Versioned File System Component is enabled and versioned folders are configured.
Persistence Status
Persistence Status is a monitoring section for the VLDB persistence type (at least one has to be defined). It displays a list of defined VLDB persistencies, typically for Consolidation and History.
For each VLDB persistence you can see:
-
LTC status: Indicates whether the Logical Transaction Collector (LTC) is active or not.
-
LTC collection count: Number of executions of the LTC.
-
LTC time spent: Total time spent cleaning up obsolete records (since MDM server startup).
-
Number of known transactions: Number of active or finished transactions that have not yet been collected by LTC.
-
Prefix of the database tables: Prefix used for relevant database tables.
-
Database connection name: The database name.
To run the LTC and start collecting obsolete records, select Trigger LTC.
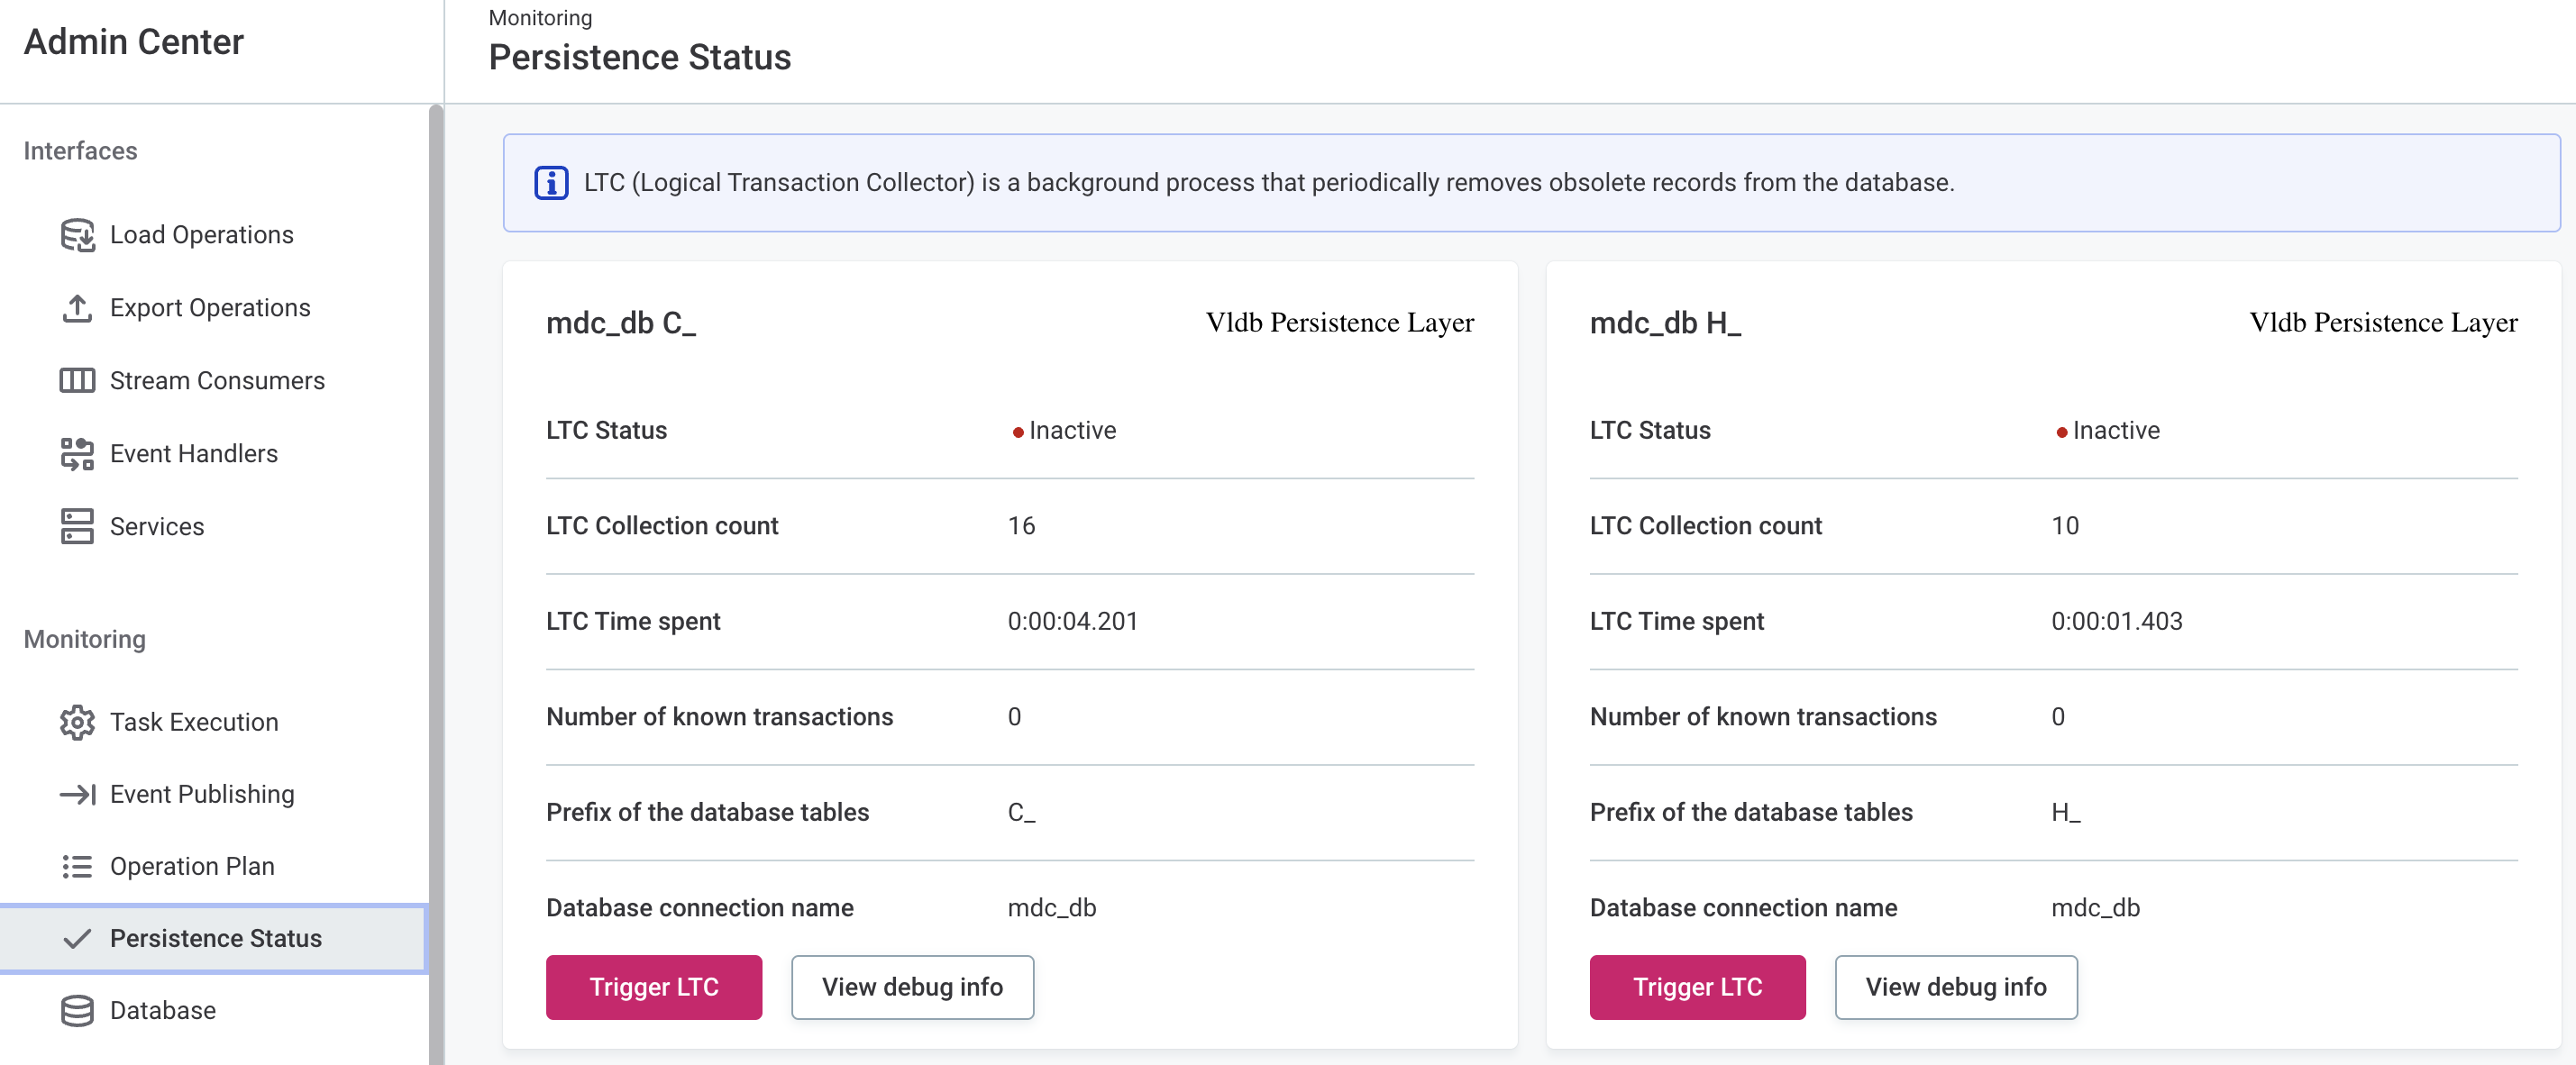
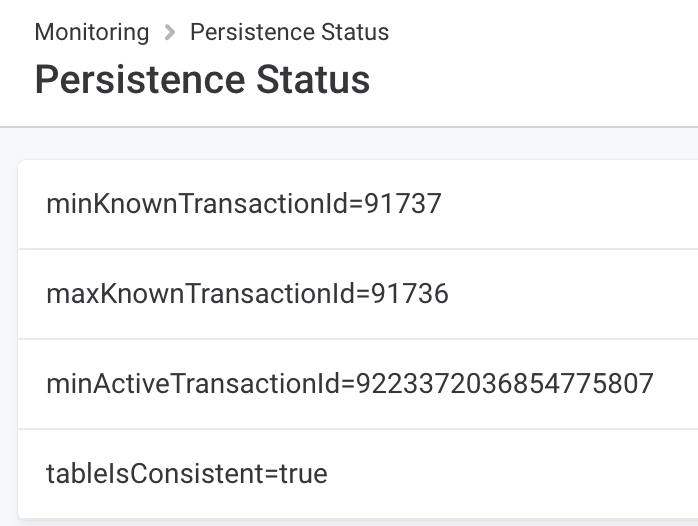
For easier troubleshooting, check the LTC metrics available by selecting View debug info.
Database
In this section, you can download all predefined database settings and configure several log settings. This can be particularly useful for debugging and fixing performance issues.
Database logs and configurations
On the database tab, you can download the ZIP file containing all available information about your database, which includes the following:
-
Database monitoring logs.
-
Hikari configuration.
-
Information about the database version.
-
DDL script.
-
Information about table sizes.
-
README file that describes what type of information was downloaded.
| The output might be limited based on the availability of the specific plugin and the database version. |
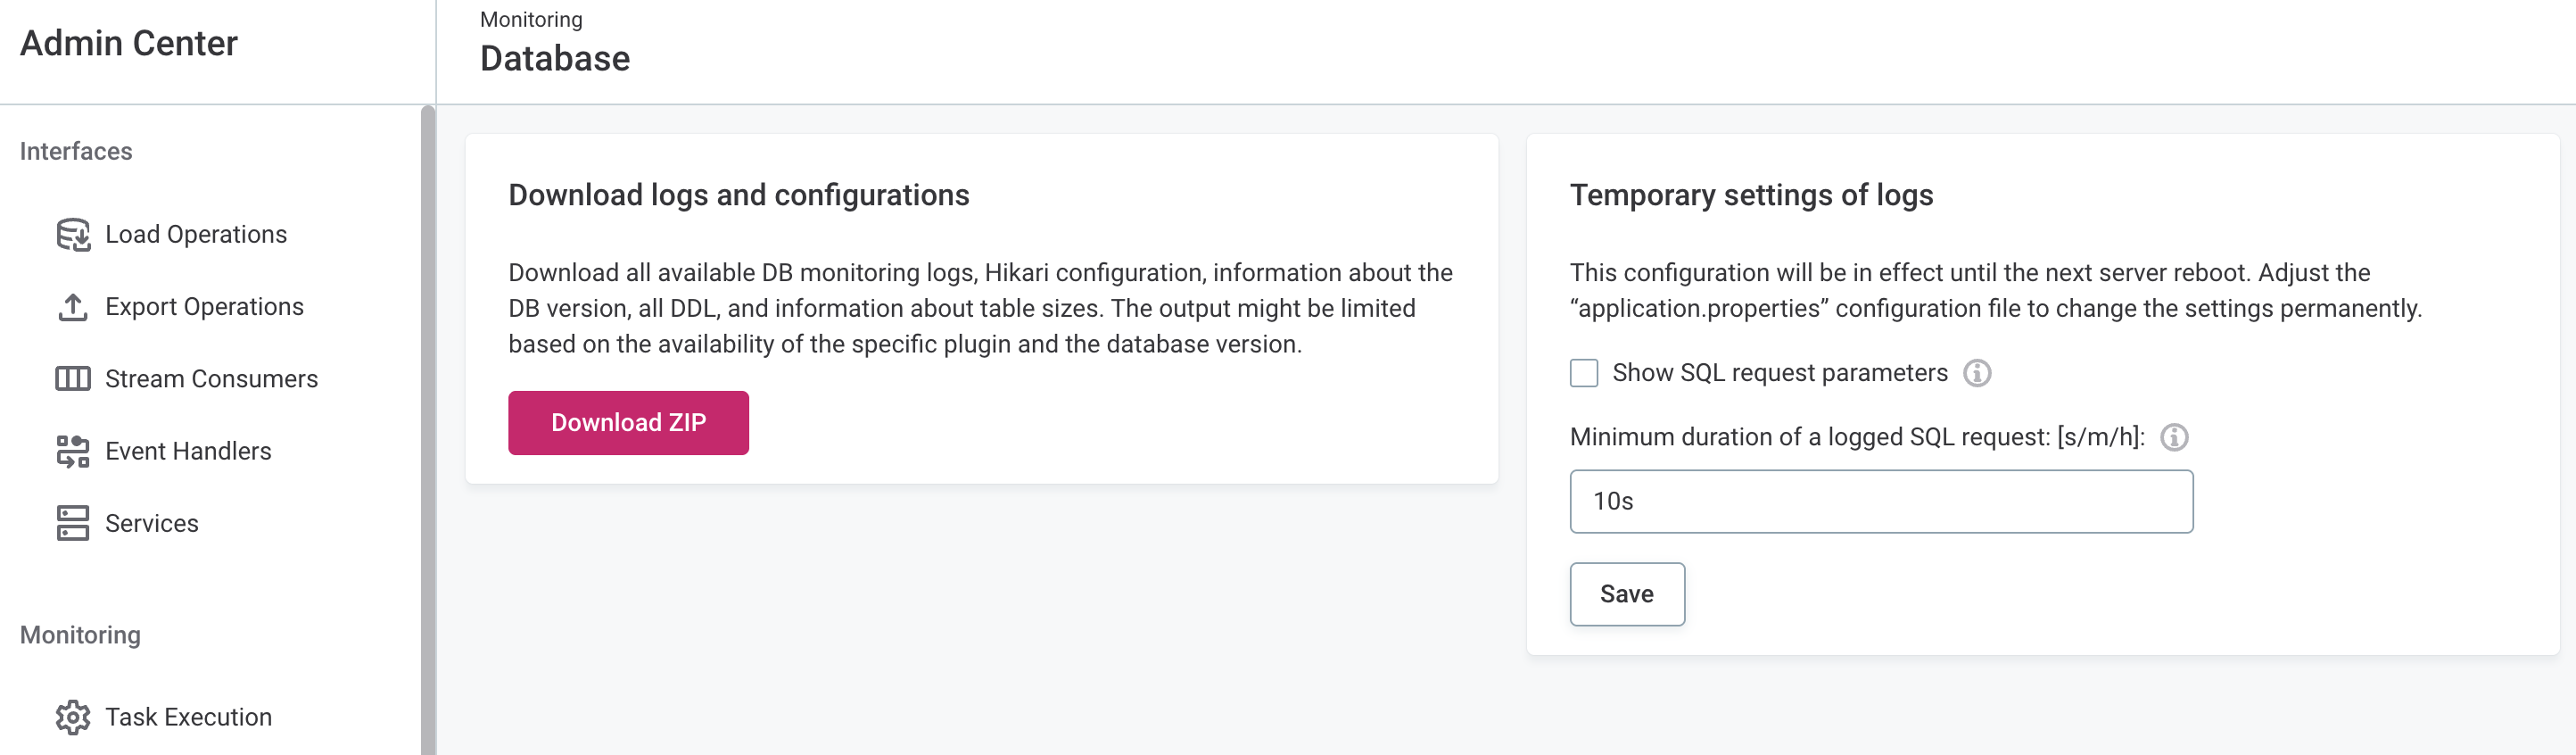
Temporary log settings
This section allows you to temporarily change the following logging settings:
-
Show SQL request parameters.
-
Set a minimum duration of a logged SQL request.
This configuration remains in effect until the next server reboot.
To change the settings permanently, you need to adjust the application.properties file accordingly (see MDM Server Application Properties > Database performance).
Was this page useful?