User Community Service Desk Downloads
If you can't find the product or version you're looking for, visit support.ataccama.com/downloads

MD Process Monitoring

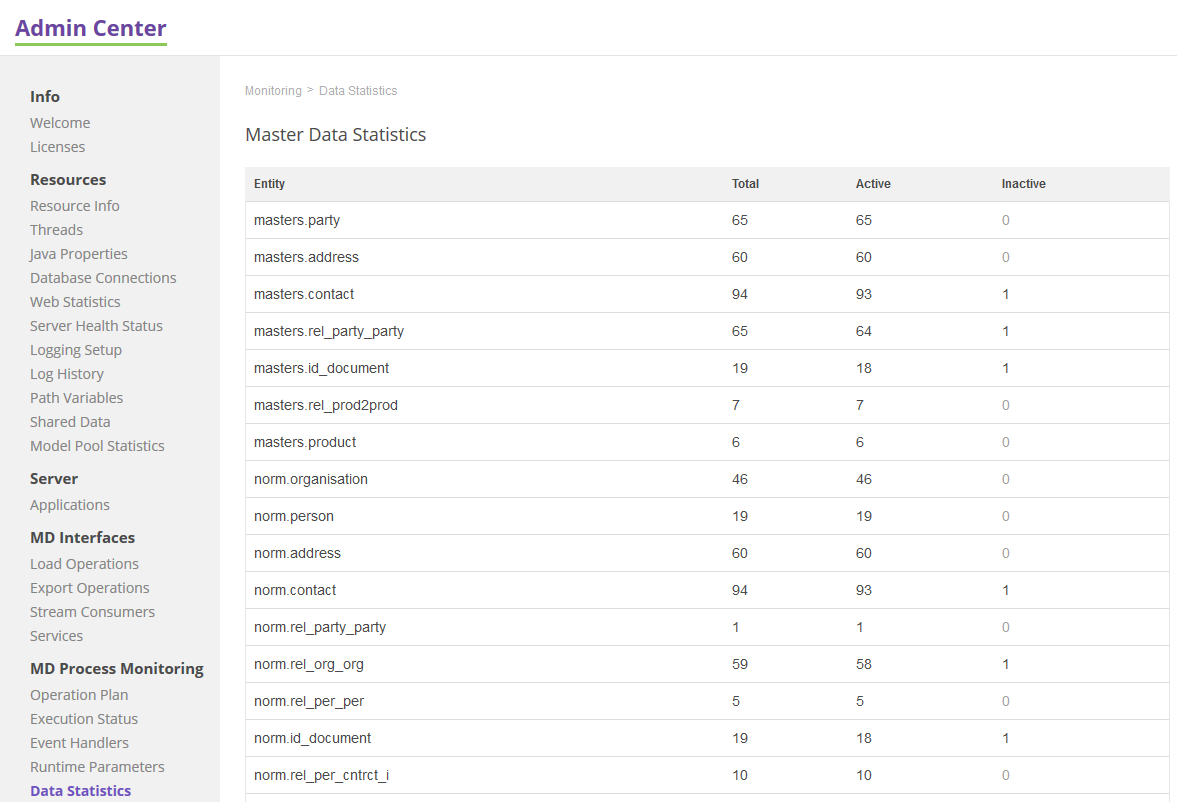
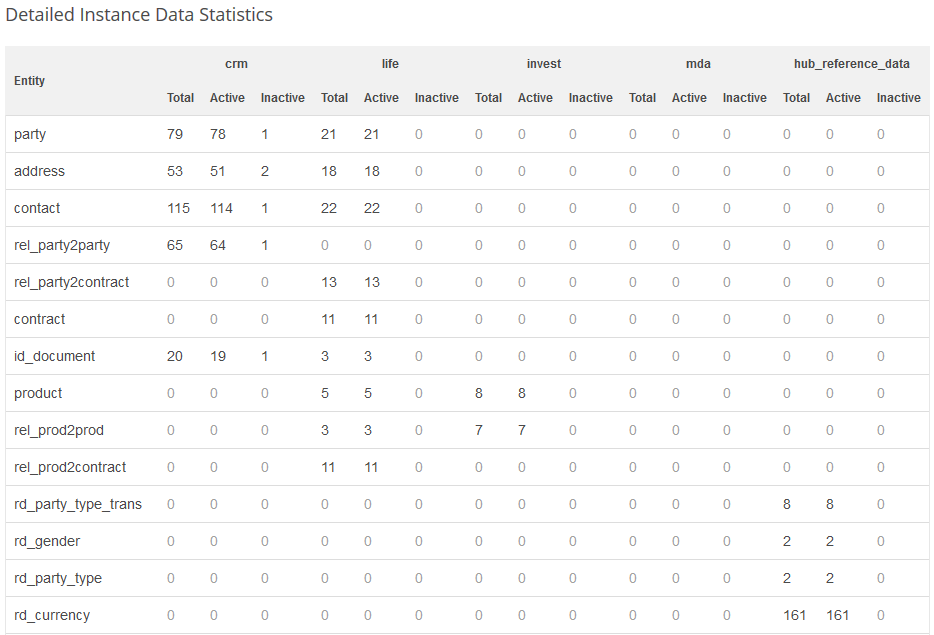
MD Process Monitoring is a part of ONE Runtime Server Admin that shows information about ongoing and finished MDM processes, runtime parameters, and data statistics.

Operation Plan

Shows the order of load operations defined in the Model used as an internal workflow of the MDM engine.

Operation Plan tab

Columns have the following meaning:

  • Operation: Name of the operation.

  • Provides: Refers to the result of the operation.

  • Requires: Refers to the result of entity processing, which must be completed before processing the current one.

  • Locks: Similar to database locks; useful for parallel processing (Read or ReadWrite access shown as well).

Execution Status

Shows a list of already processed operations for both load and export operations.

Click any operation to view more information about it.

To filter tasks by task status, select one from the status dropdown menu.

Execution Status tab

Load Operation

Here you can view more detailed information about a load operation.

Execution Status detail tab

The Progress monitoring section displays each step of the operation with the following details:

  • Subtask name

  • Date and time when the operation started

  • Date and time when the operation finished

  • Duration

  • Detail

    • Number of changed records, total number of incoming records (change detection)

    • Number of records at the start of a subtask (cleanse)

    • Number of records at the start of a subtask plus number of records affected by processing (match, copyColumns)

    • Number of records at the start of a subtask plus number of records affected by processing → number of record at the end of the subtask (merge)

Batch load subtasks are the following:

Subtask name Description

Data acquisition

Subtask refers to the process and transformation in a load plan when the load operation launched.

Change detection

"Real" change detection (also known as delta detection) of incoming data against data already stored in the MDM repository. Starting from this point, only the changed data is processed.

Master data consolidation

Cleansing, match, copyColumns, and merge subtasks for an entity are processed in the given order.

Committing

Writing down the data into the MDM repository.

Export Operation

Here you can find details about an export operation.

Export Operation detail tab

The Progress monitoring section displays each step of the operation with the following details:

  • Subtask name

  • Date and time when the operation started

  • Date and time when the operation finished

  • Duration

  • Detail: Number of records at the start of the subtask.

Batch exports subtasks are the following:

Subtask name Description

Preparing data

Subtask refers to the process of loading (and filtering) data from the MDM repository when an export operation is launched.

Exporting

Process of working with data in an export plan.

Committing

Writing down the data.

Event Handlers

As part of a load operation, an event handler and event publisher can be configured. You can see both finished and ongoing tasks.

For active event handlers with active tasks, you can see the following:

  • Id: Event handler processing ID, link to detailed information (details shown depend on the event handler name).

  • Task Id: Task ID of the relevant load operation execution status.

  • State: Information about the current processing phase (see the list of available statuses in Load Operation).

  • Started: Date and time when the task started.

  • Finished: Date and time when the task finished.

Event Handlers tab

You can also perform the following actions on event handlers from the Admin Center:

  • Deactivate: Events are captured by EventHandler and stored to persistenceDir but are propagated by publishers only after activation.

  • Activate: Event handler will start propagating events by publishers. Only available if the event handler has been deactivated due to a publishing failure.

  • Disable: Event handler will stop capturing events. Only available if the event handler is already deactivated.

  • Enable: Event handler will start capturing events but will remain inactive (that is, it will not start publishing yet) and monitor the health status of both event handlers and publishers.

Event Handlers actions tab
Server Health Status tab
Event handler status in Server Health Status reflects also the state of its publishers as publishers cannot be monitored or restarted on their own. If you need to run and monitor two publishers independently, you need to create more event handlers, that is, ensure that each event handler uses only one publisher. For more information, see Adding a Data Event Handler and Publisher.

Finished Tasks

Here you can find all finished event handlers displayed together:

  • Id: Event handler processing ID, link to detailed information (details shown depends on the event handler name).

  • Task Id: Relates to the relevant load operation execution status.

  • Event Handler Name

    • MdaSync (if applicable)

    • History

    • EventHandlerAsync (or a different name)

  • State: Information about the current processing phase.

    • RECEIVING: Receiving events from an ongoing transaction.

    • READY: Ready for publishing.

    • PUBLISHING: Ongoing publishing process.

    • PUBLISHED: Publishing is finished.

    • CORRUPTED: Temporary files are corrupted.

    • CRASHED_RECEIVING: MDM processing or Event Handler failed. Temporary files will be removed.

    • CRASHED_PUBLISHING: Publishing was not successful. When a publisher is activated, publishing continues.

  • Started: Date and time when the task started.

  • Finished: Date and time when the task finished.

  • Duration: Task duration.

Event Handlers Finished Tasks

Persistence Status

Persistence Status is a monitoring section for the VLDB persistence type (at least one has to be defined). It displays a list of defined VLDB persistencies, typically for Consolidation and History.

For each VLDB persistence the following details are available:

  • LTC count: Number of executions of the Logical Transaction Collector (LTC).

  • LTC time spent: Total time spent cleaning up the obsolete records (since MDM server startup).

  • Number of known transactions: Represents the number of active or finished transactions that have not yet been collected by LTC.

  • LTC running: Boolean flag indicating the current LTC activity.

  • Trigger LTC: Manual action to start collection of obsolete records, that is, run the LTC. To learn more about VLDB in Persistence Layer, see Persistence Layer.

Persistence Status tab

Runtime Parameters

Shows all runtime parameter values that are used by the engine as configured in Runtime Parameters.

Runtime Parameters tab

Data Statistics

Shows detailed statistics on data in the MDM storage.

Master Data Statistics

Shows a number of active and inactive (logical delete) records per each master entity.

Master Data Statistics tab

Instance Data Statistics

Shows a number of active and inactive (logical delete) records per each instance entity.

Detailed Instance Data Statistics

Shows instance data numbers per each source system and instance entity.

Detailed Instance Data Statistics tab

Was this page useful?