
MDM Web App Admin Center
This is a user guide for the MDM Web App Admin Center.
The Admin Center is available at the /admin endpoint on the MDM Web App server URL.
|
For information about the the old Admin Center, see MDM Admin Center Extras. Both the old and the new interface will be available concurrently for some time. Missing features will be gradually introduced to the new Admin Center in future releases. |
Access
There are several levels of access in the Admin Center:
-
No access: Users can log in but cannot view any information or make changes.
-
View-only access: Users can view available information including details about running operations and the server setup but cannot perform any actions or change settings.
-
Full access: Users can view available information including details about running operations and the server setup, perform any actions, or change any settings.
-
Manager access: Users have all the permissions of full access, and additionally can stop and start the MDM server and clone Git repositories.
| Access permissions are configured in the MDM Server Application Properties. |
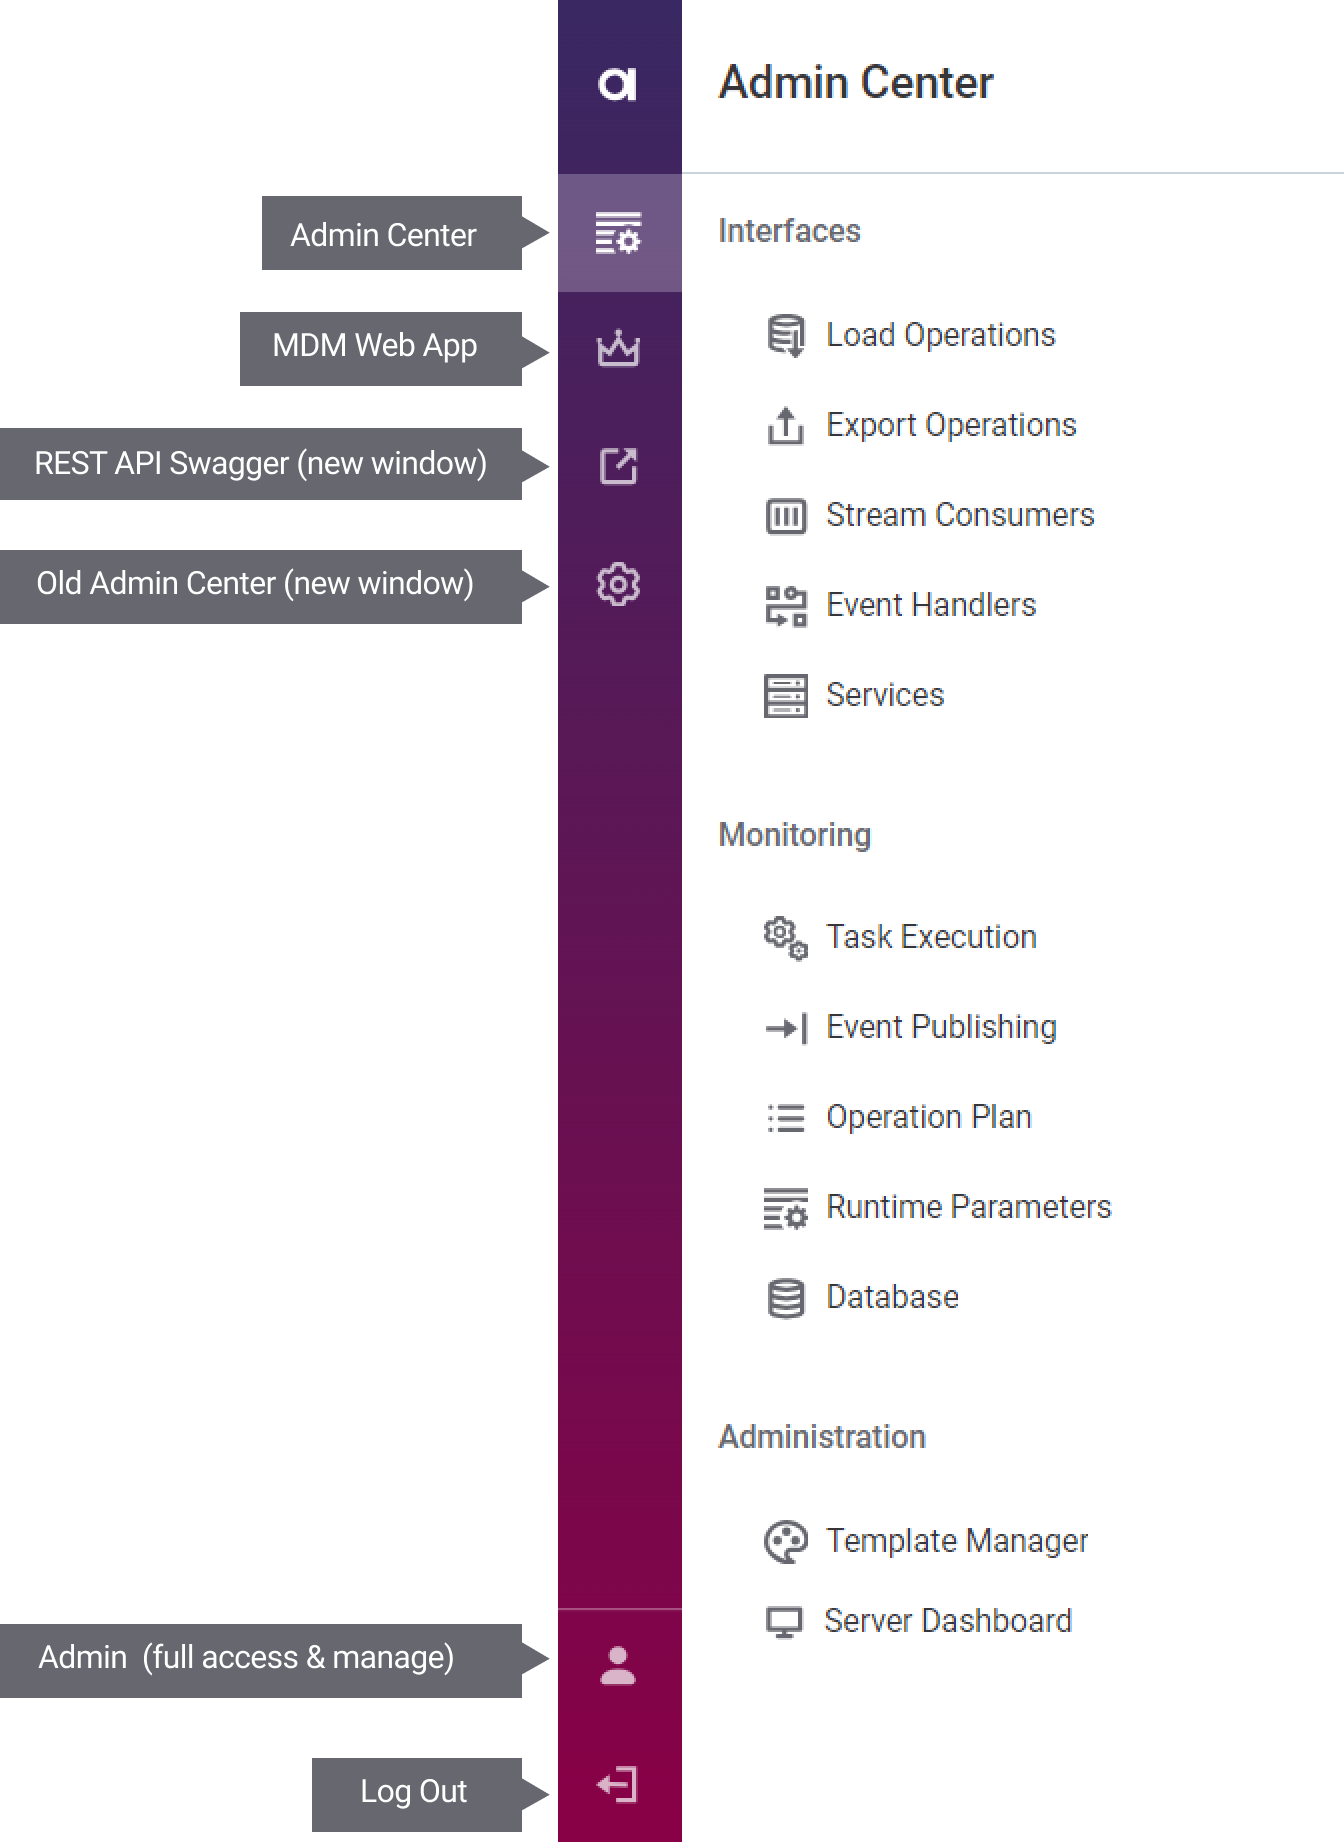
Navigation
The left sidebar contains the following:
-
Links to connected systems: MDM Web App, High Availability Admin Console (if applicable), REST API Swagger, and the old Admin Center.
-
The user icon showing the first and last name as well as access level of the user on mouse hover.
-
The log out button.
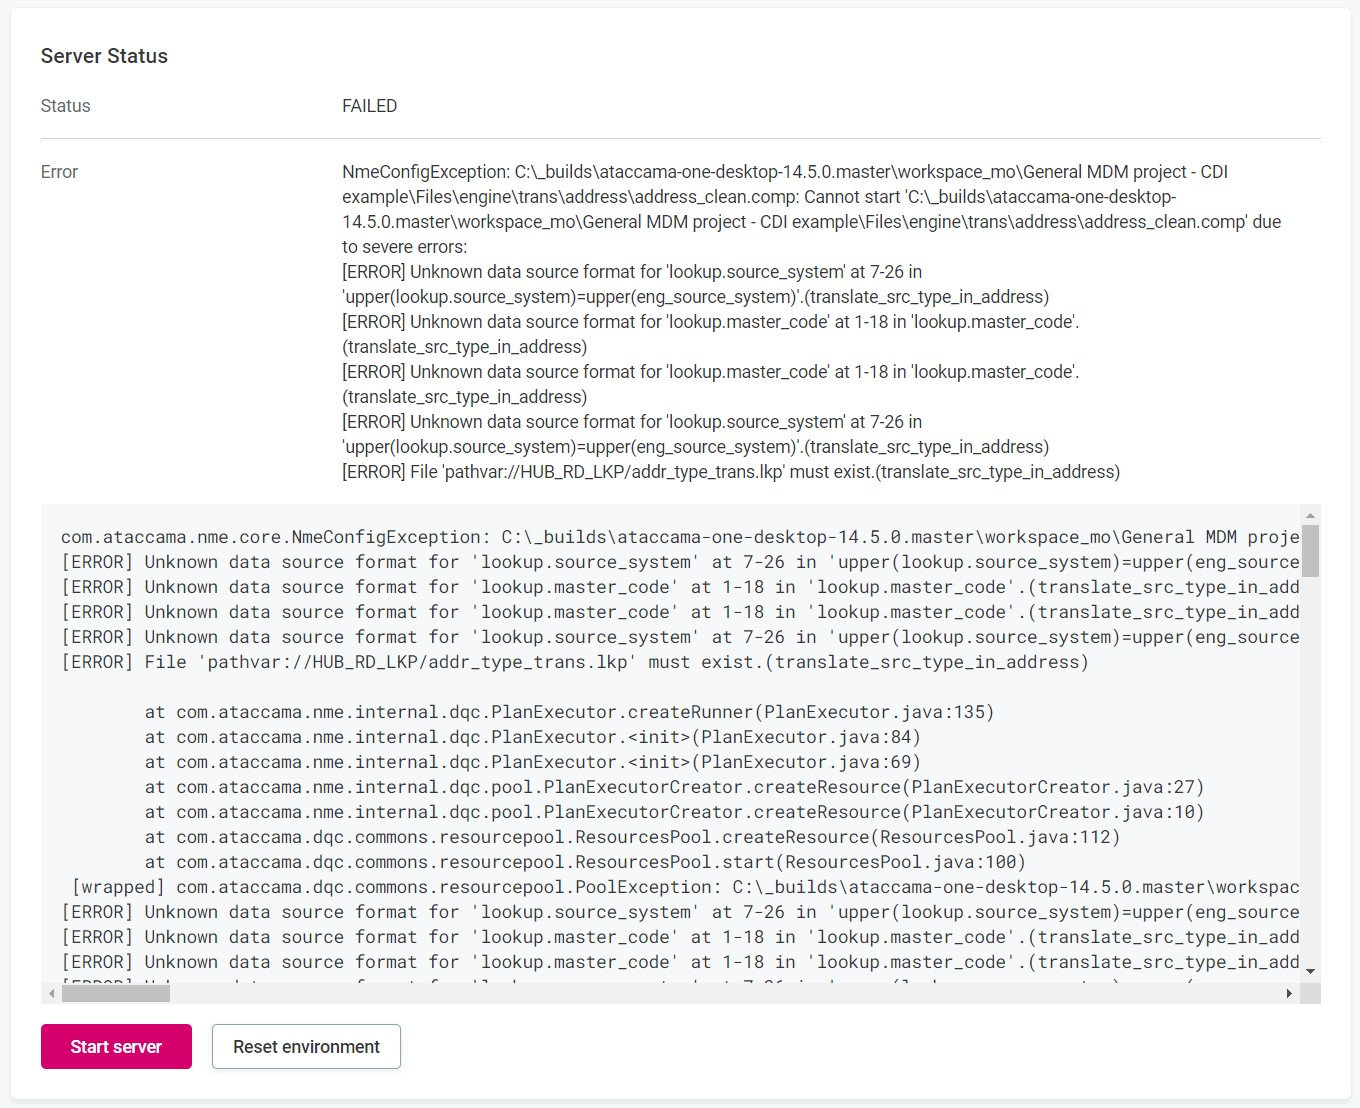
If the server fails to start due to configuration issues or missing lookups, the limited version of the Admin Center opens and the message explaining the cause of the failure appears. You can start the server or reset the environment after fixing the issue. To learn more about these actions, see Server Dashboard.
|
The navigation panel can display one of the following statuses:
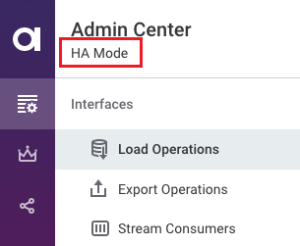
If none of the above is displayed, the server is running in the default, read-write and single-node mode. |
Tips
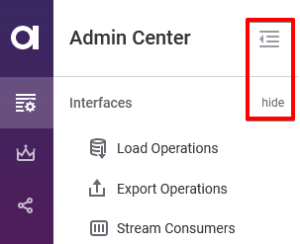
Hide the main navigation to expand the working area by pressing F or by clicking the icon in the header. The navigation subsections can also be collapsed by clicking.
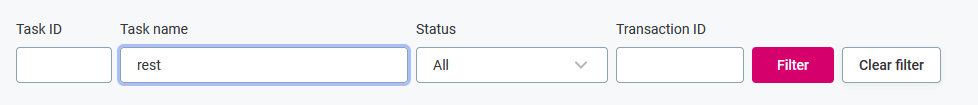
To filter, type three or more characters into the filter input field and press Enter or click Filter. To cancel filtering, click Clear filter.
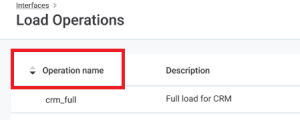
To sort the operations by name (ascending or descending), click the header cell of a column. The icon indicates what type of sorting is active.
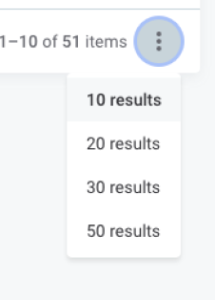
The last row of a table shows the number of pages and additional items available. The number of items shown per page can be customized using the three dots menu.
Interfaces
From this section, you can manage available batch operations, stream consumers, and event handlers, as well as find a list of native services that have been configured.
Load Operations
Shows a list of available batch load operations on a particular MDM server, their descriptions, last-run times, and average run duration. For more information, see Input and Output Interfaces > Adding a Batch Load Operation section in the documentation.
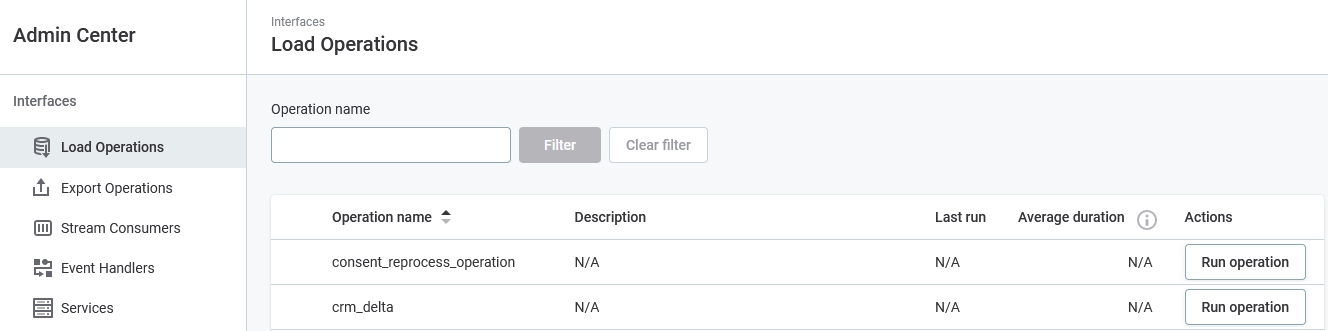
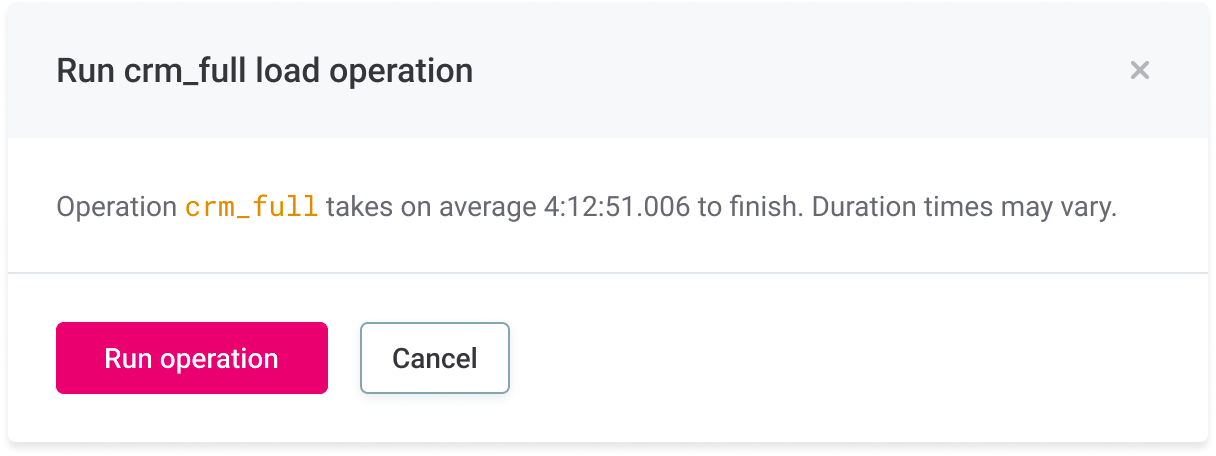
Users with full and manager access can run operations manually by selecting Run Operation. To avoid accidentally running resource-intensive operations, the average time to finish is displayed in the confirmation window.
Export Operations
Shows a list of available export operations, their descriptions, last-run times, and average run duration. For more information, see Input and Output Interfaces > Adding a Export Operation section in the documentation.
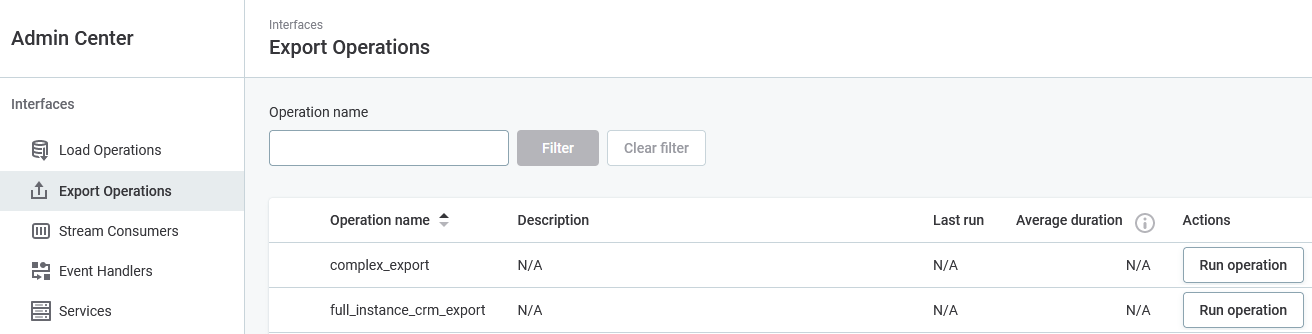
Users with full and manager access can run operations manually by selecting Run Operation. To avoid accidentally running resource-intensive operations, the average time to finish is displayed in the confirmation window.
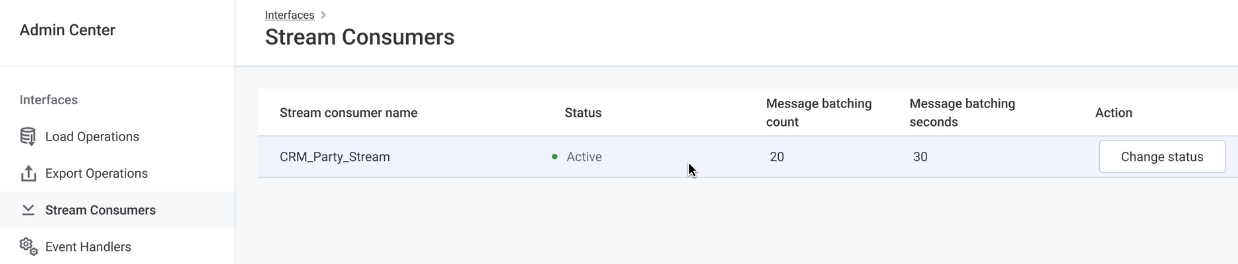
Stream Consumers
Shows a list of available stream consumers together with their statuses and information about data consumption (the maximum size of the batch and waiting time in seconds). For more information, see Configuring Stream Consumers.
Stream consumer status
-
Active stream consumers are reading, batching, and sending messages for further processing.
-
Disabled stream consumers are not reading messages. All unread messages are processed once the stream consumer is active again.
Users with full and manager access can change stream consumer status by selecting Change Status.
Event Handlers
Shows a list of available event handlers and their descriptions and statuses. For more information, see Adding a Data Event Handler and Publisher.
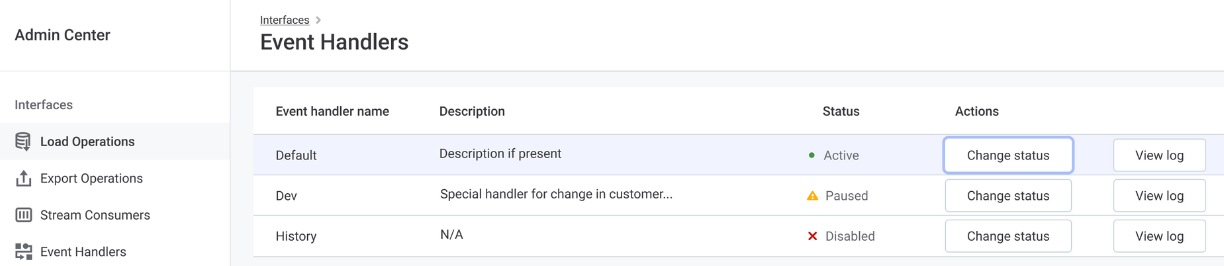
Users with read-only access can view publishing details. Users with full and manager access can also change event handler status by selecting Change Status.
Event handler status
-
Active event handlers are listening for data changes, storing them, and publishing them through linked publishers.
-
Paused event handlers are storing changes so they can publish them once they are active again. This has an impact on the memory consumption of the system as the changes are being stored.
-
Disabled event handlers are not monitoring changes at all, thus the changes cannot be published later.
Event handler publishing
Click View Publishing to view the event handler details page with individual runs of the event handlers and their statuses (see [Event Publishing]).
To change the status, select Change Status in the header.
Services
Shows a list of available services. SOAP services are listed in a table while the list of REST services is linked at the top of the page. The REST API is available by default.
To customize other types of services, see Configuring Native Services.
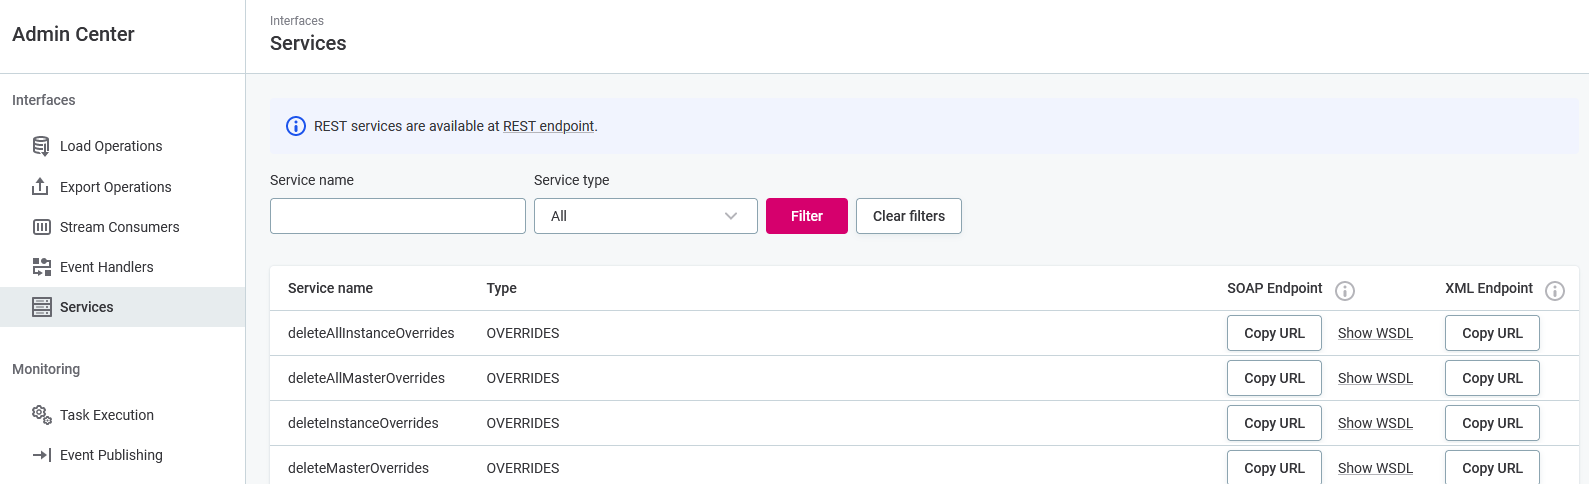
SOAP and XML endpoint URLs can be copied to the clipboard by clicking Copy URL. The Show WSDL link (short for Web Services Description Language) opens a WSDL file for the particular service.
Monitoring
This section allows to browse the details of task execution, event publishing, operation plan, and runtime parameters.
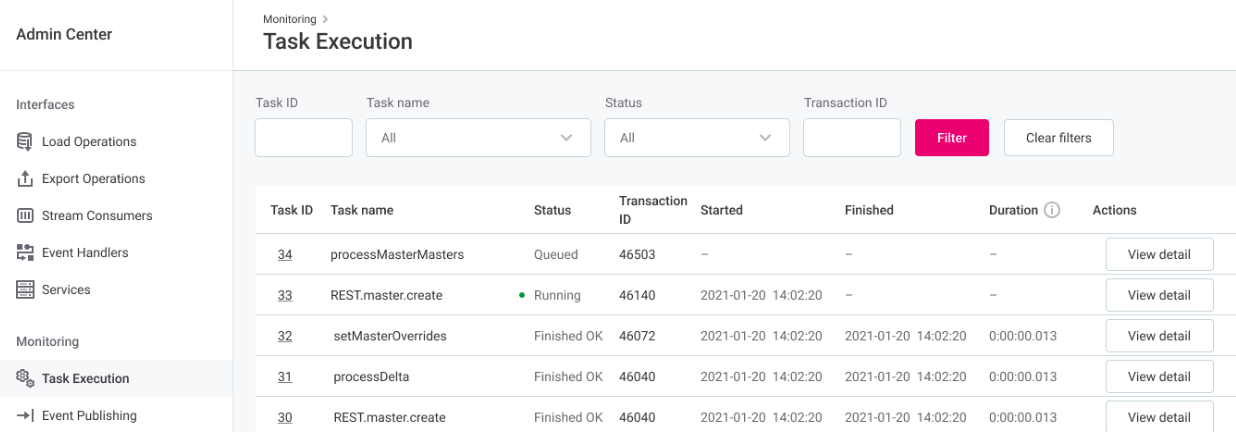
Task Execution
Displays a list of all running, queued, and finished data processing actions, including user actions.
Task status
| Status | Description |
|---|---|
WAITING |
Task in queue. |
RUNNING |
Currently being executed. |
FINISHED_OK |
Finished successfully. |
FINISHED_FAILURE |
Finished with a failure. |
ABORTING |
Task has been canceled by a user but is not yet terminated. |
ABORTED |
Task has been aborted by a user. |
For task details, select the task ID or View Detail.
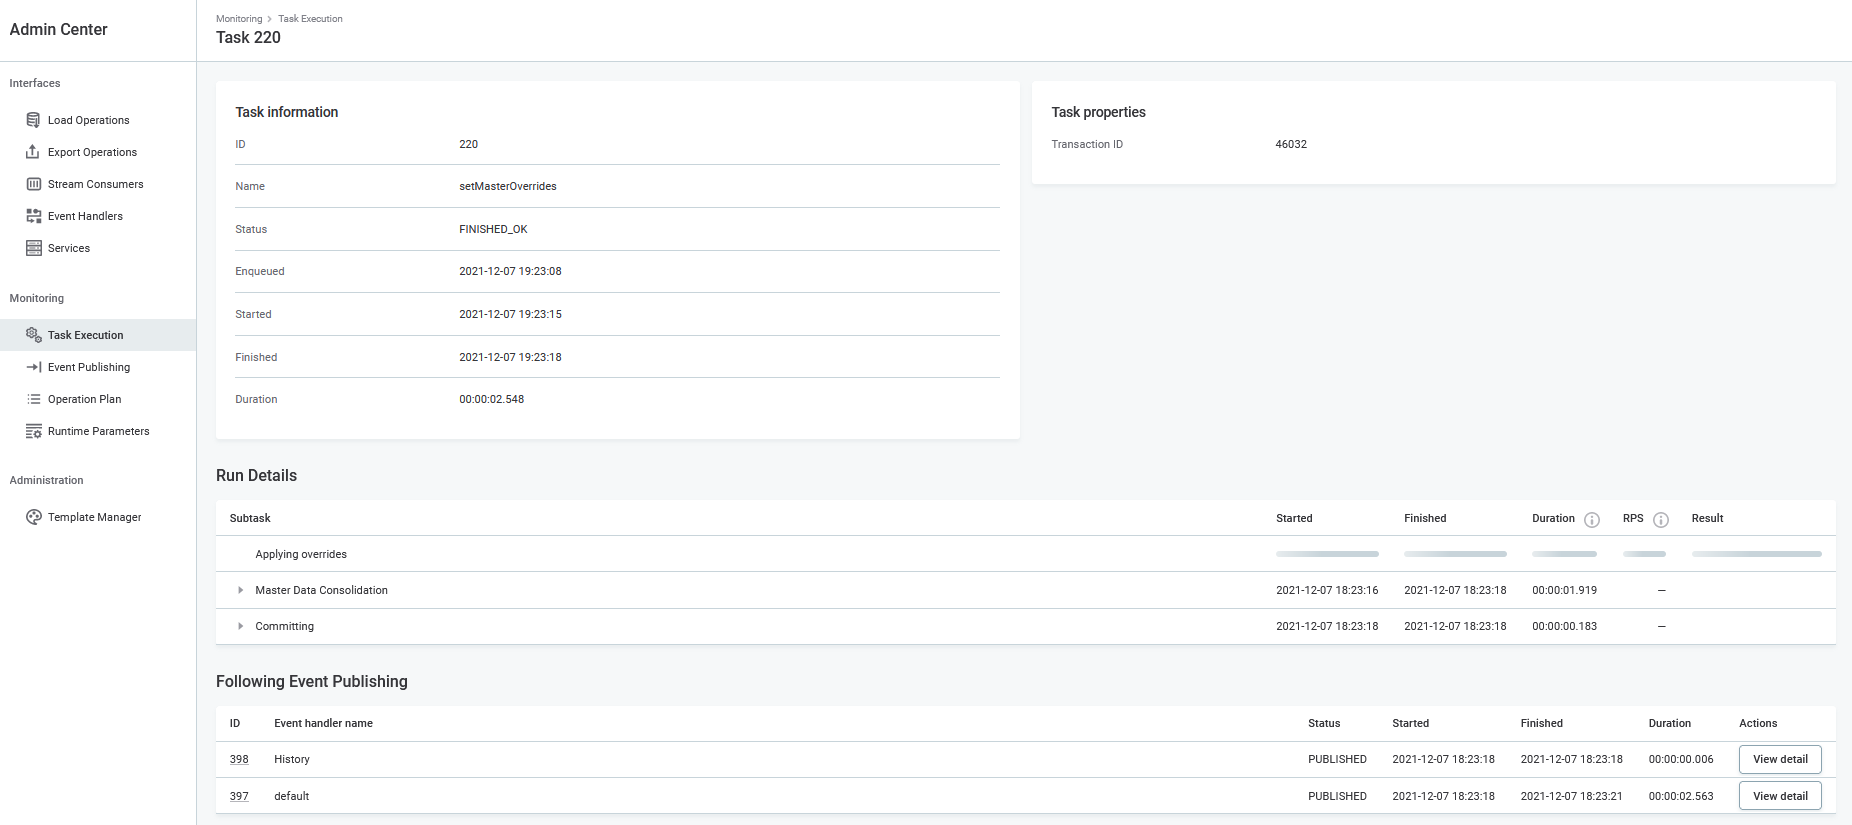
Task details
The task detail screen provides further information, including the list of subtasks, their start and finish times, the number of processed records per second, and the subtask result.
At the bottom of the page, you can find a list of related instances of event publishing.
Subtask result examples
| Result | Description |
|---|---|
|
Number of changed records, total number of incoming records (change detection) |
|
Number of records at the start of a task (cleanse, validate, commit) |
|
Related records processing |
|
Number of records at the start of a task + number of records affected by processing (match, aggregate, copyColumns) |
|
Number of records at the start of a task + number of records affected by processing → number of record at the end of the task (merge) |
|
Task was not executed. |
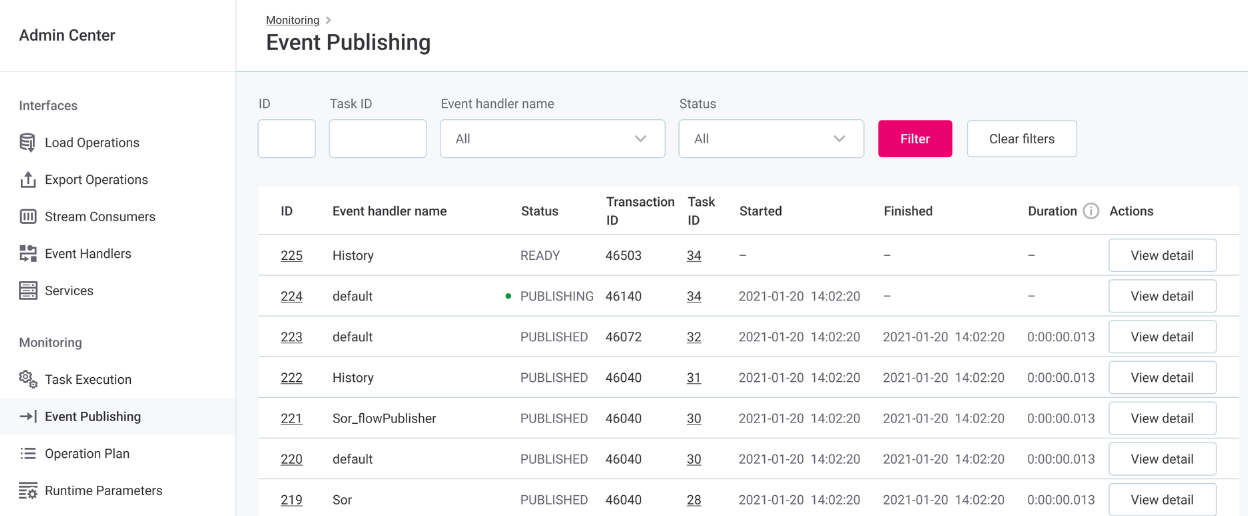
Event publishing
Displays a list of running and previously run instances of event handler publishing. For details, select the processing ID in the first column or View Detail. To view the parent task, select the Task ID.
Event publishing status
| Status | Description |
|---|---|
RECEIVING |
Receiving events from an ongoing transaction. |
READY |
Ready for publishing. |
PUBLISHING |
Ongoing publishing process. |
PUBLISHED |
Publishing is finished. |
CORRUPTED |
Temporary files are corrupted. |
CRASHED_RECEIVING |
MDM processing or Event Handler failed - temporary files will be removed. |
CRASHED_ PUBLISHING |
Publishing was not successful - when a publisher is activated, publishing continues. |
Operation Plan
Shows the order of load operations defined in the Model used as an internal workflow of the MDM engine. You can also download the operations list for using Executor by clicking the link at the top of the page.
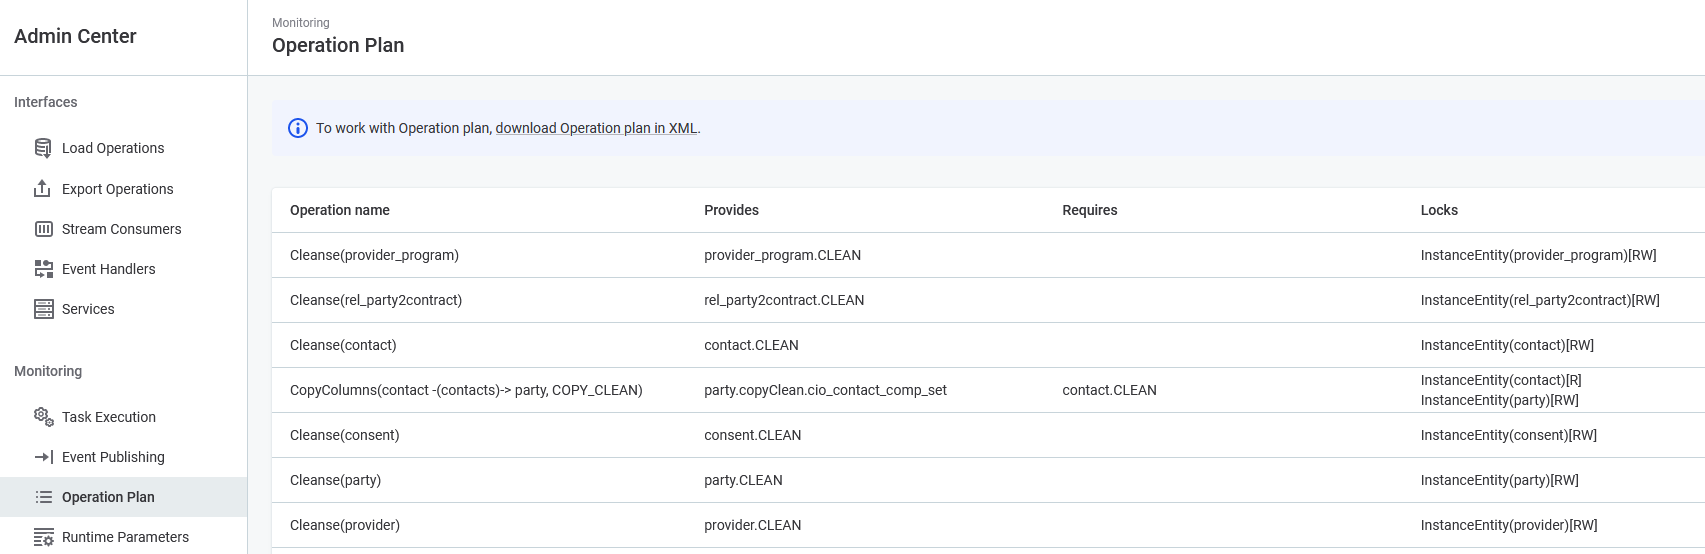
Column description:
-
Operation: Name of the operation.
-
Provides: Refers to the result of the operation.
-
Requires: Refers to the result of entity processing that must be completed before processing the current one.
-
Locks: Similar to database locks; useful for parallel processing (Read or ReadWrite access shown as well).
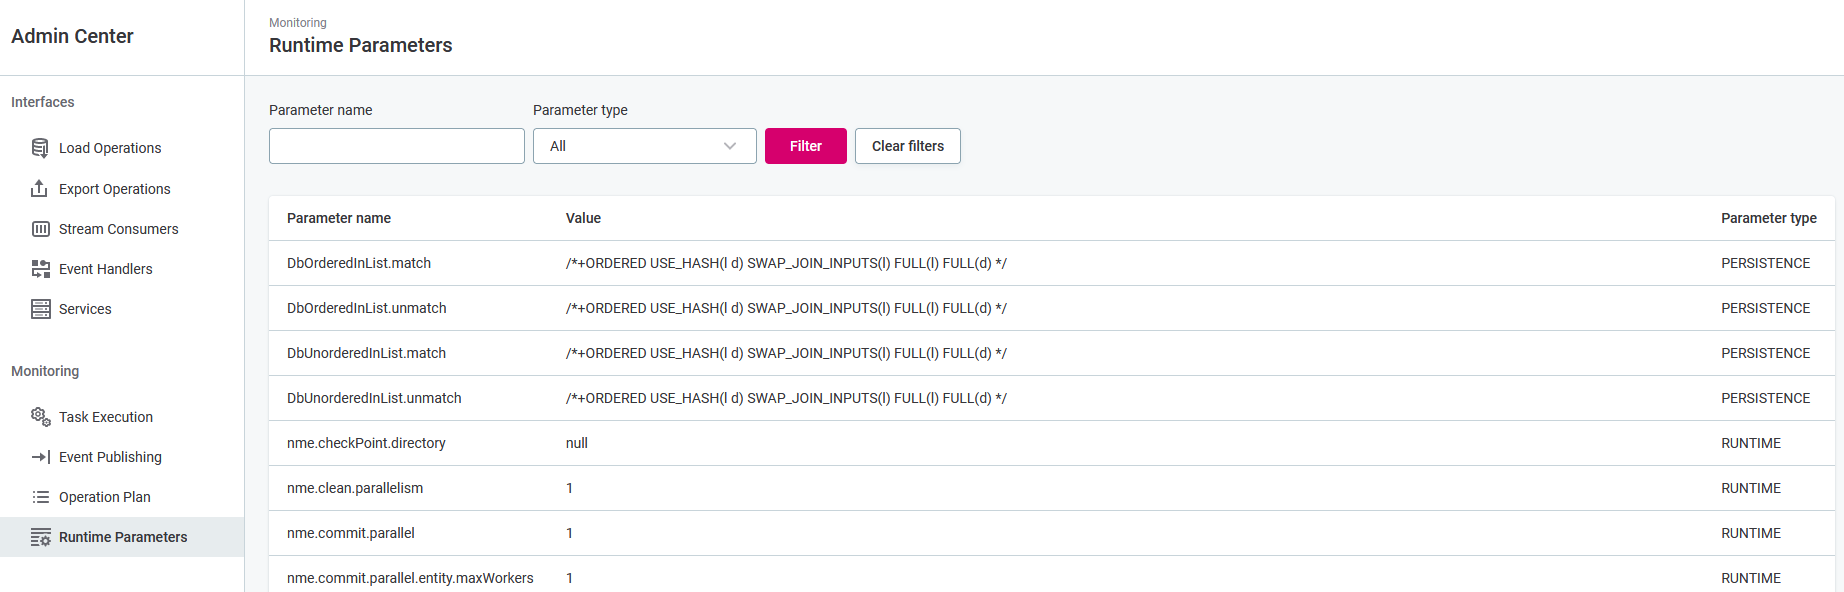
Runtime Parameters
Shows all runtime parameter values that are used by the engine as configured in runtime parameters.
Administration
Template Manager
This section displays the template status, error log, a list of loaded templates, and a list of entities without a template.
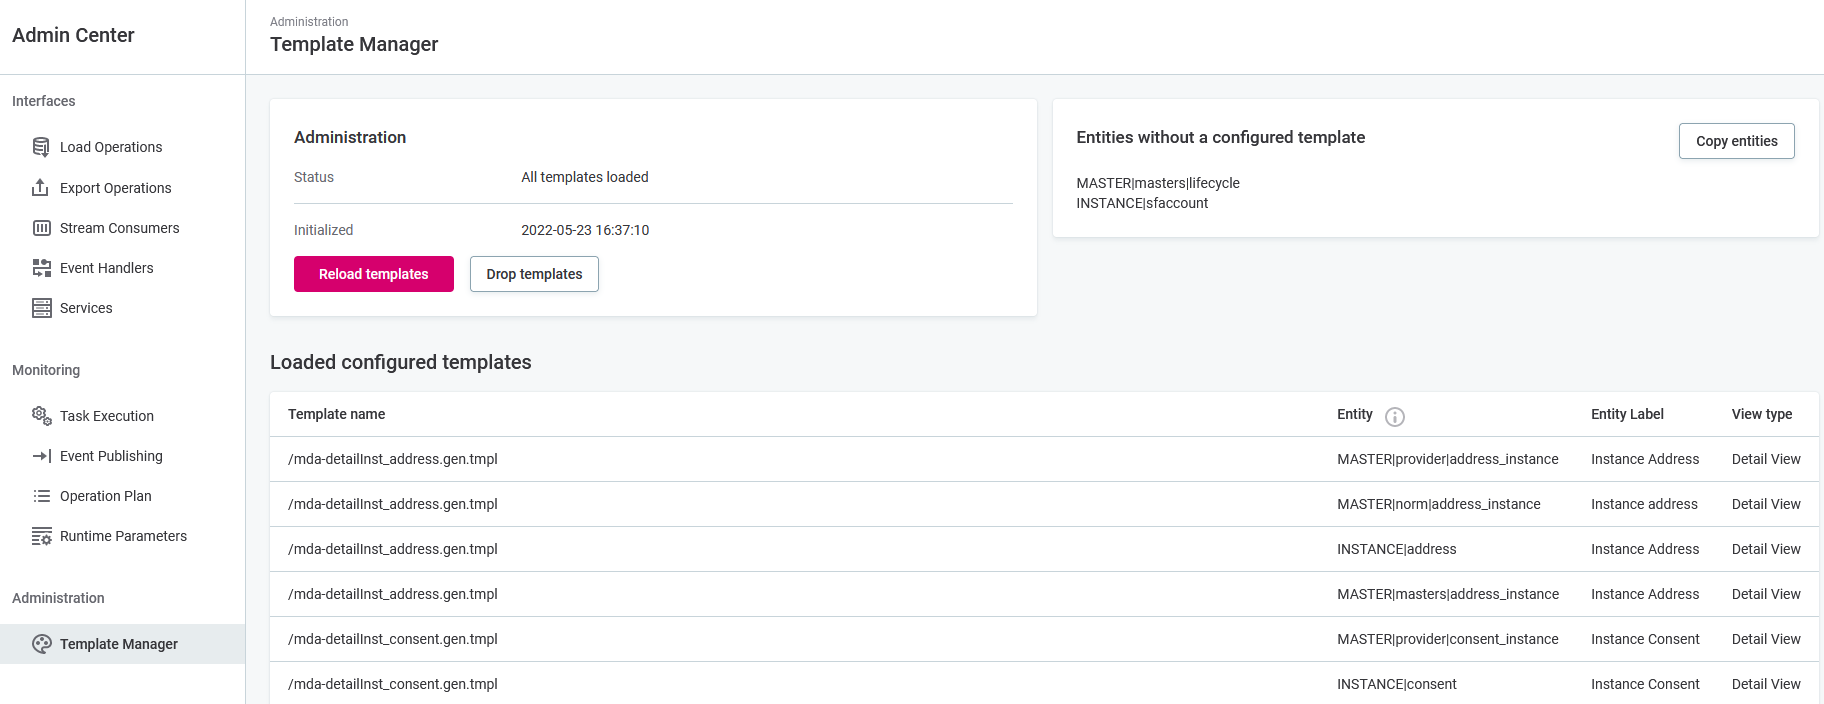
Select Reload Templates to refresh templates, or Drop Templates to revert to standard templates.
Server Dashboard
This section provides information about the MDM Server status and the time when the server was started. It also allows you to stop and start the server and reset the environment.
To be able to perform Server Dashboard actions, a user must have the role defined by the ataccama.one.mdm.admin-center.manager.required-roles MDM Server application property.
For more information, see MDM Server Application Properties, section MDM Admin Center permissions.
|
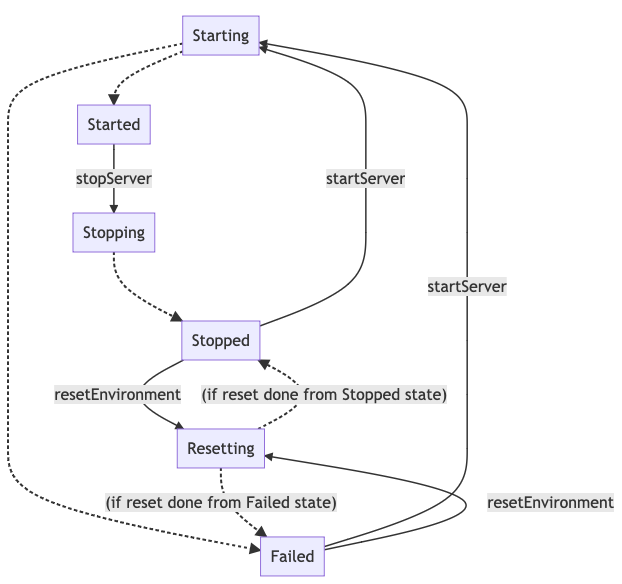
Possible server statuses are:
| Status | Description |
|---|---|
STARTING |
The server is starting. |
STARTED |
The server started and is running. |
STOPPING |
The server is stopping. |
STOPPED |
The server stopped and is no longer running. |
RESETTING |
The environment is being reset. |
FAILED |
Starting the server or resetting the environment failed. |
The following diagram illustrates possible status transitions:
Stop MDM Server
If MDM Server is running, the information about the status and the time when the server was started is displayed.
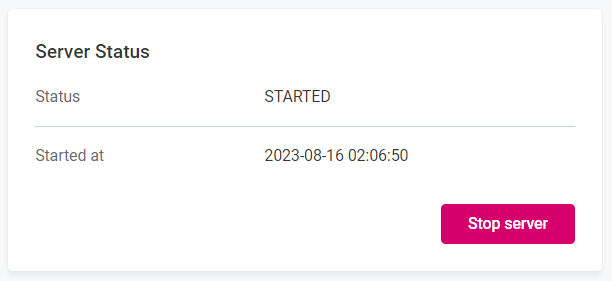
It is possible to stop the server when the server status is STARTED, STARTING, or RESETTING.
To do this, select Stop server and confirm your choice in the window that opens. The server status changes to STOPPING and then to STOPPED.
| For production environments, it is not possible to stop the server. |
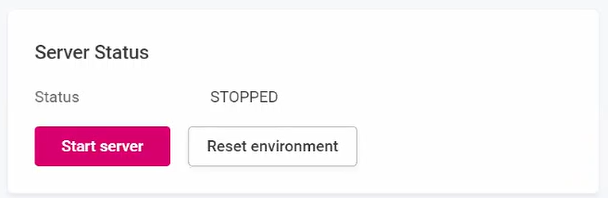
Start MDM Server
The option to start the server is available when the server status is STOPPED or FAILED. To start the server, select Start server.
The server status changes to STARTING. In this state, the option to stop the server becomes available.
If the server fails to start, the status changes to FAILED. After fixing the issue, you can start the server again.
If the server successfully started, the status changes to STARTED.
Reset environment
The process of resetting the environment includes clearing all database tables and deleting resource files (specified in the ataccama.one.mdm.server.refresh.dirs-to-delete application property, see MDM Server Application Properties, section MDM features).
The action does not affect the configuration. This functionality can be useful for development and testing purposes.
| You can only use the feature for PostgreSQL databases, otherwise an error is thrown. |
It is possible to reset the environment when the server status is STOPPED or FAILED. To reset the environment, select Reset environment and confirm your choice in the window that opens.
The server status changes to RESETTING. In this state, the option to stop the server becomes available.
After resetting, you can start the server.
| For production environments, it is not possible to reset the environment. |
Was this page useful?