Data Observability Dashboards
Data Observability dashboards provide a single place where you can find information on all data quality or schema change issues.
Here, you can also run data observability manually, close issues, or add newly-discovered catalog items to your observed system.
Overview
Where can I find them?
Data observability dashboards are available on the Data Observability tab of the source.
What is included?
-
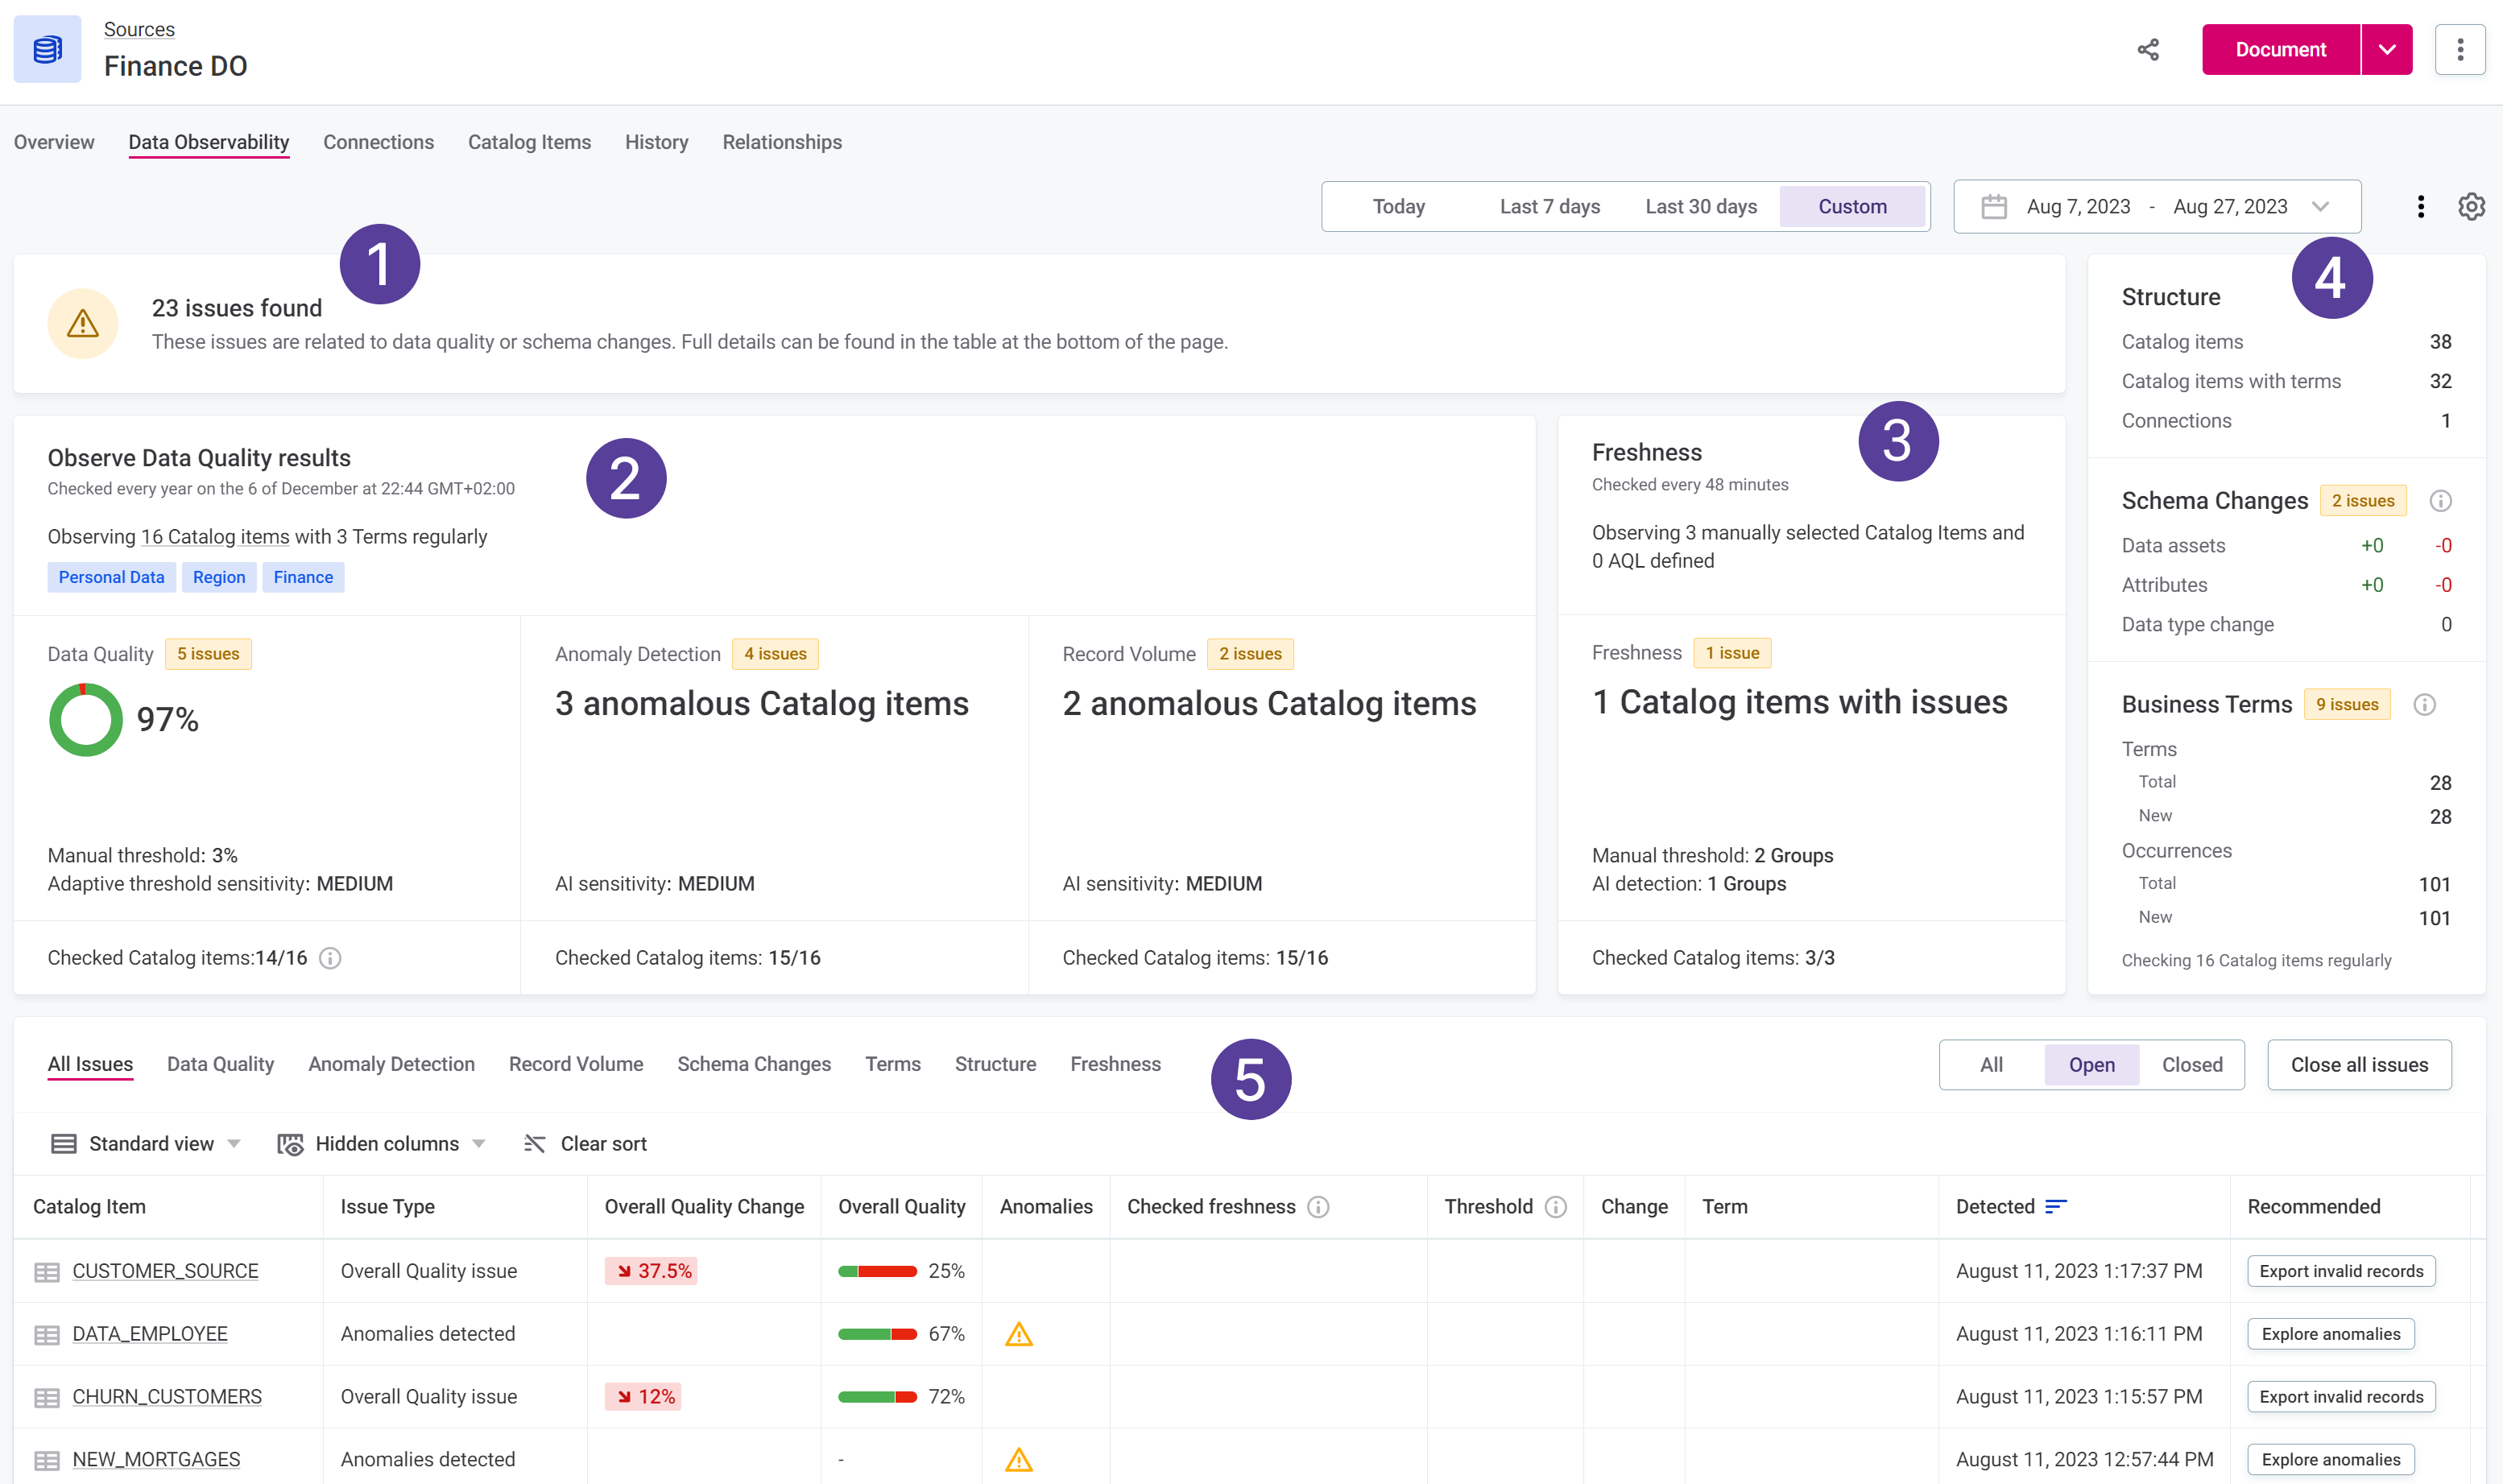
Issues banner. Shows the total number of issues currently open in the source. These can be related to data quality or structure.
If configuration is not complete or no results are available yet, you are informed here.
-
Data quality overview. See Data quality.
-
Freshness. See Freshness.
-
Structure. See Structure.
-
Issues table. Lists all issues in the source. You can select different columns to see different types of issues (for example, just Schema changes), close or reopen issues, and import newly-detected items.
See Issues table for further instructions.
Which issues are listed on the dashboard?
All issues detected by data observability monitoring are listed on the data observability dashboard.
To remove an issue from the dashboard, you can close it from the issues table. See Close issues for instructions.
| As issues can be closed, the number of issues shown on the dashboard does not necessarily match the number of issues detected in your data. |
After an issue is resolved, rerunning data observability does not remove the issue from the dashboard. To remove the issue, you need to manually close it.
Data quality
This is an overview of data quality for the observed schemas. It includes Data quality (calculated from data quality dimensions), Anomaly detection, and Record volume.
You can also find information on the next scheduled run and how many items and terms are being observed.
To change any of these details, you need to edit the data observability configuration. To do this, select the settings icon and edit the configuration according to the instructions in Data Observability.
Overall quality
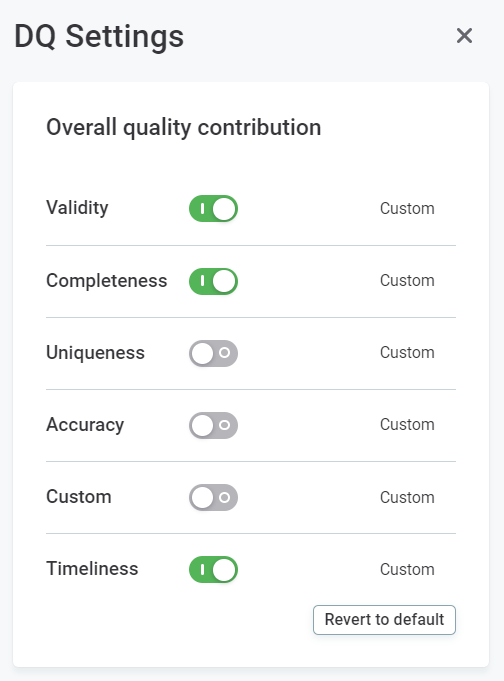
Overall data quality is calculated according to results of the DQ rules applied on the observed catalog items. Only results of rules of DQ dimensions which are currently contributing to overall quality count towards this total.
For more information, see Data Quality Dimensions.
|
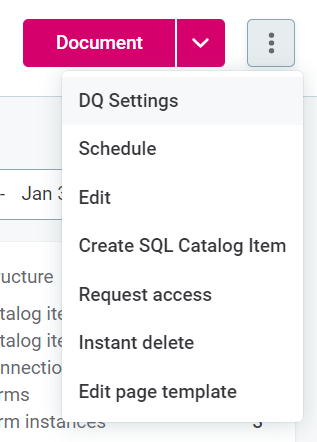
By default, which DQ dimensions contribute to overall quality matches the global settings, defined in Data Quality > Settings > DQ Dimensions. However, you can override this configuration on the level of the observed source. To do this:
|
DQ rules are not mapped directly to specific catalog item attributes in the catalog but rather to terms (and then are subsequently applied to attributes containing those terms).
You are notified about changes in quality according to the threshold settings visible. To change the threshold settings, select the settings icon and edit the configuration according to the instructions in Data Observability.
Use the issues table for further information about these issues or to close them. Issues related specifically to data quality can be seen on the Data Quality tab.
You can see results for overall quality and also for individual dimensions. Keep in mind that only dimensions that are contributing to overall quality and have at least one active rule are visible in the issues table.

Anomaly detection
Anomalies shown in Anomaly Detection are those detected on the metrics of catalog items and attributes, such as value distribution, standard deviation, numeric statistics, and string statistics. The value of the metric is considered to be an anomaly if it is beyond the usual range.
| An issue is created whenever at least one anomaly is detected on a catalog item. As issues can be closed, the number of issues does not necessarily match the number of anomalous catalog items. |
Anomaly detection is a process handled with AI, meaning that with every confirmed or dismissed notification, the data observability system learns more about the data and its possible values, which helps detect anomalies more precisely in the future. Anomalies can be confirmed or dismissed from the Profile inspector or when closing issues (see Close issues).
The sensitivity of anomaly detection can impact the number of issues detected. To change the sensitivity settings, select the settings icon and edit the configuration according to the instructions in Data Observability.
Use the issues table for further information about these issues or to close them.
Record volume
Anomalies shown in Record Volume are anomalies in the number of records. Anomalies are detected if the number of records in each table is not as expected.
See Anomaly detection for more information.
Freshness
In Freshness, you can see issues in data freshness according to your data observability settings. You can also find information on the frequency of monitoring runs and how many items are being observed.
To change any of these details, you need to edit the data observability configuration. To do this, select the settings icon and edit the configuration according to the instructions in Data Observability.
When using the AI detection type, the sensitivity of detection can impact the number of issues detected. To change the sensitivity settings, select the settings icon and edit the configuration according to the instructions in Data Observability.
Use the issues table for further information about these issues or to close them. Issues related specifically to freshness can be seen on the Freshness tab.
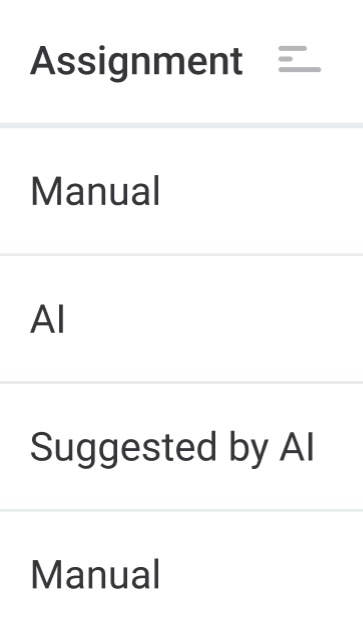
There you can see number of missing updates, the time between the last update and the last monitoring run, the expected time between updates, and the detection type (AI or manual).
Structure
In Structure, you can find an overview of the structure statistics of the connected system.
Schema changes
In Schema changes, you can see an overview of how many of the monitored catalog items and attributes have been removed, added, or how many attributes have changed data type, as well as information about the next scheduled run.
To change the scheduling settings, select the settings icon and edit the configuration according to the instructions in Data Observability.
Issues table
In the issues table, a number of tabs are available: All issues, Data Quality, Anomaly Detection, Record Volume, Schema Changes, Terms, Structure, and Freshness.
Select a tab to see information related to only that category: for example, select Terms to see only information relating to terms.

Issues table filters
Depending on the tab selected, different filter options are available. For example, if you select Data Quality, Anomaly Detection, Record Volume, or Freshness, you can filter between all data quality results, or just those with issues, as well as between open and closed issues.

Additional filters are available for:
-
Schema Changes: You can also filter between Issues and Info.

-
Terms: You can also filter between Terms or Occurrences.

Close issues
If you no longer want to be notified about an issue, you can close the issue from the issues table. To close an issue, select Close Issue for the catalog item.

| Closing the issue does not resolve it. You need to take independent steps to resolve the issue before closing it. |
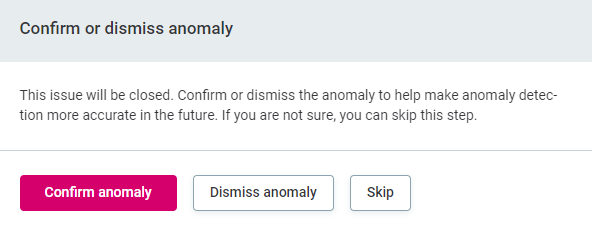
Before closing the Anomaly detection and Record Volume issues, you can confirm or dismiss anomalies to help improve detection. This option is only available when you close a single issue.
To do so:
-
In the table, select Close Issue.
-
Select whether you want to confirm the anomaly, dismiss the anomaly, or skip.
| For more information about viewing the anomaly details before confirming or dismissing it, see Anomaly feedback. |
If you select Close all issues, you are not able to confirm or dismiss anomalies.

Recommended actions
Actions based on detected schema changes
In the case of schema changes, it can be necessary to take certain actions when the changes are detected. Based on the detected change (for example, a new catalog item has been detected in the database which is not in the catalog), the recommended action can be found in the issues table.
To see these recommendations, make sure the Schema changes tab is selected and check the column Recommended.
| Not all actions are mandatory, but, especially in the case of delete and update, they can be necessary for the functioning of DQ evaluation. |
|
For schema changes, performing the recommended actions resolves the issue by updating the catalog to accurately reflect the data source. After resolving the issue, you need to manually close it for it to disappear from the dashboard. Rerunning data observability does not remove the issue from the dashboard. |
Actions recommended in case of new AI term suggestion
|
For AI term suggestion changes, performing the recommended actions resolves the issue in the catalog. After resolving the issue, you need to manually close it for it to disappear from the dashboard. Rerunning data observability does not remove the issue from the dashboard. After accepting the term suggestion, make sure to publish the changes. |
Actions recommended in case of data quality issues
Export invalid records
You can export records which fail the DQ evaluation checks to ONE Data for data remediation. Select Export invalid records and then create a new table according to the instructions in Import Data from a Catalog Item, section Import data with DQ results.

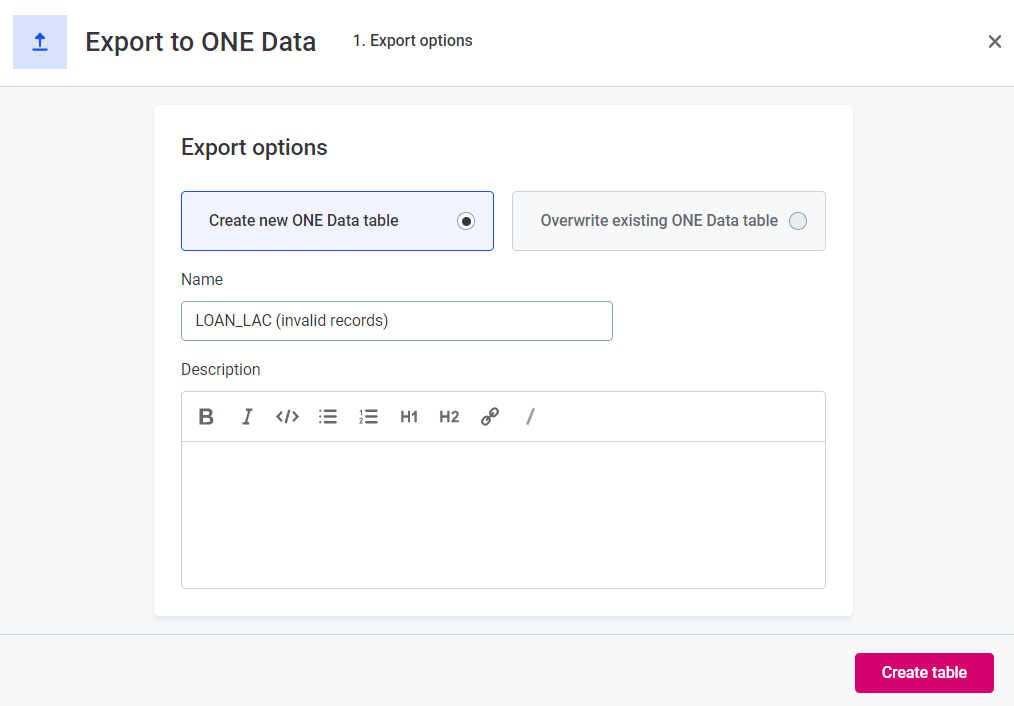
To learn more about data remediation, see Data Remediation with ONE Data.
Explore anomalies
Opens the profile inspector so you can view details of detected anomalies, and confirm or dismiss them. For more information, see Anomaly feedback.
Create tasks
Create associated tasks directly from the issues table by selecting the plus icon and following the instructions in Tasks.
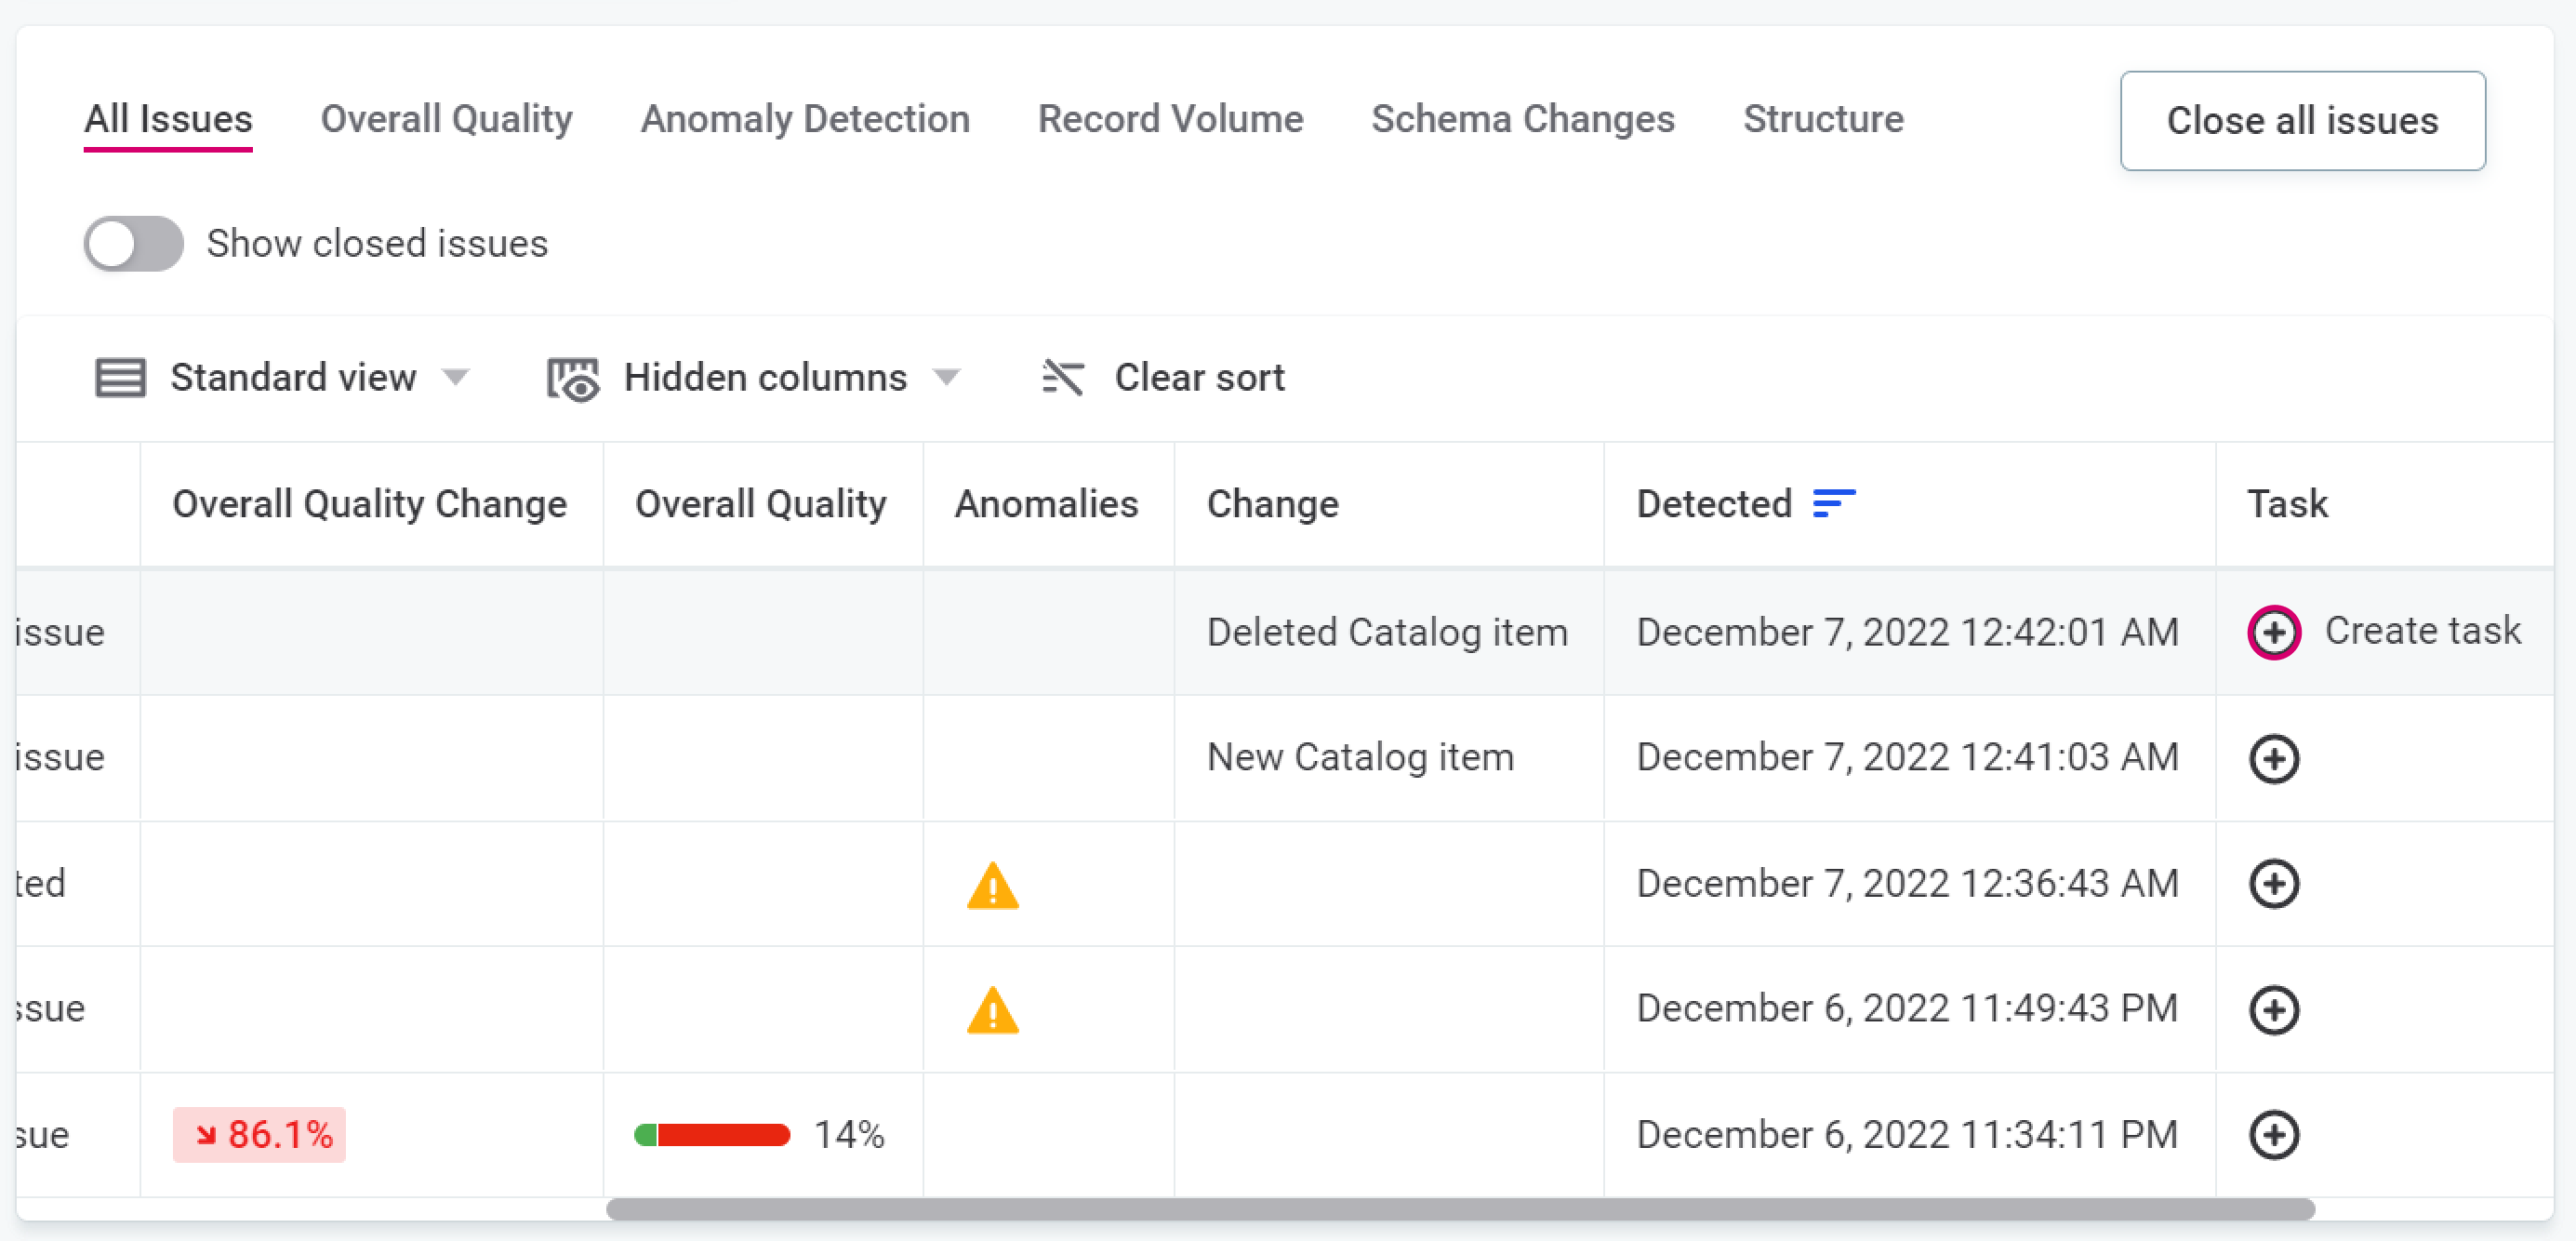
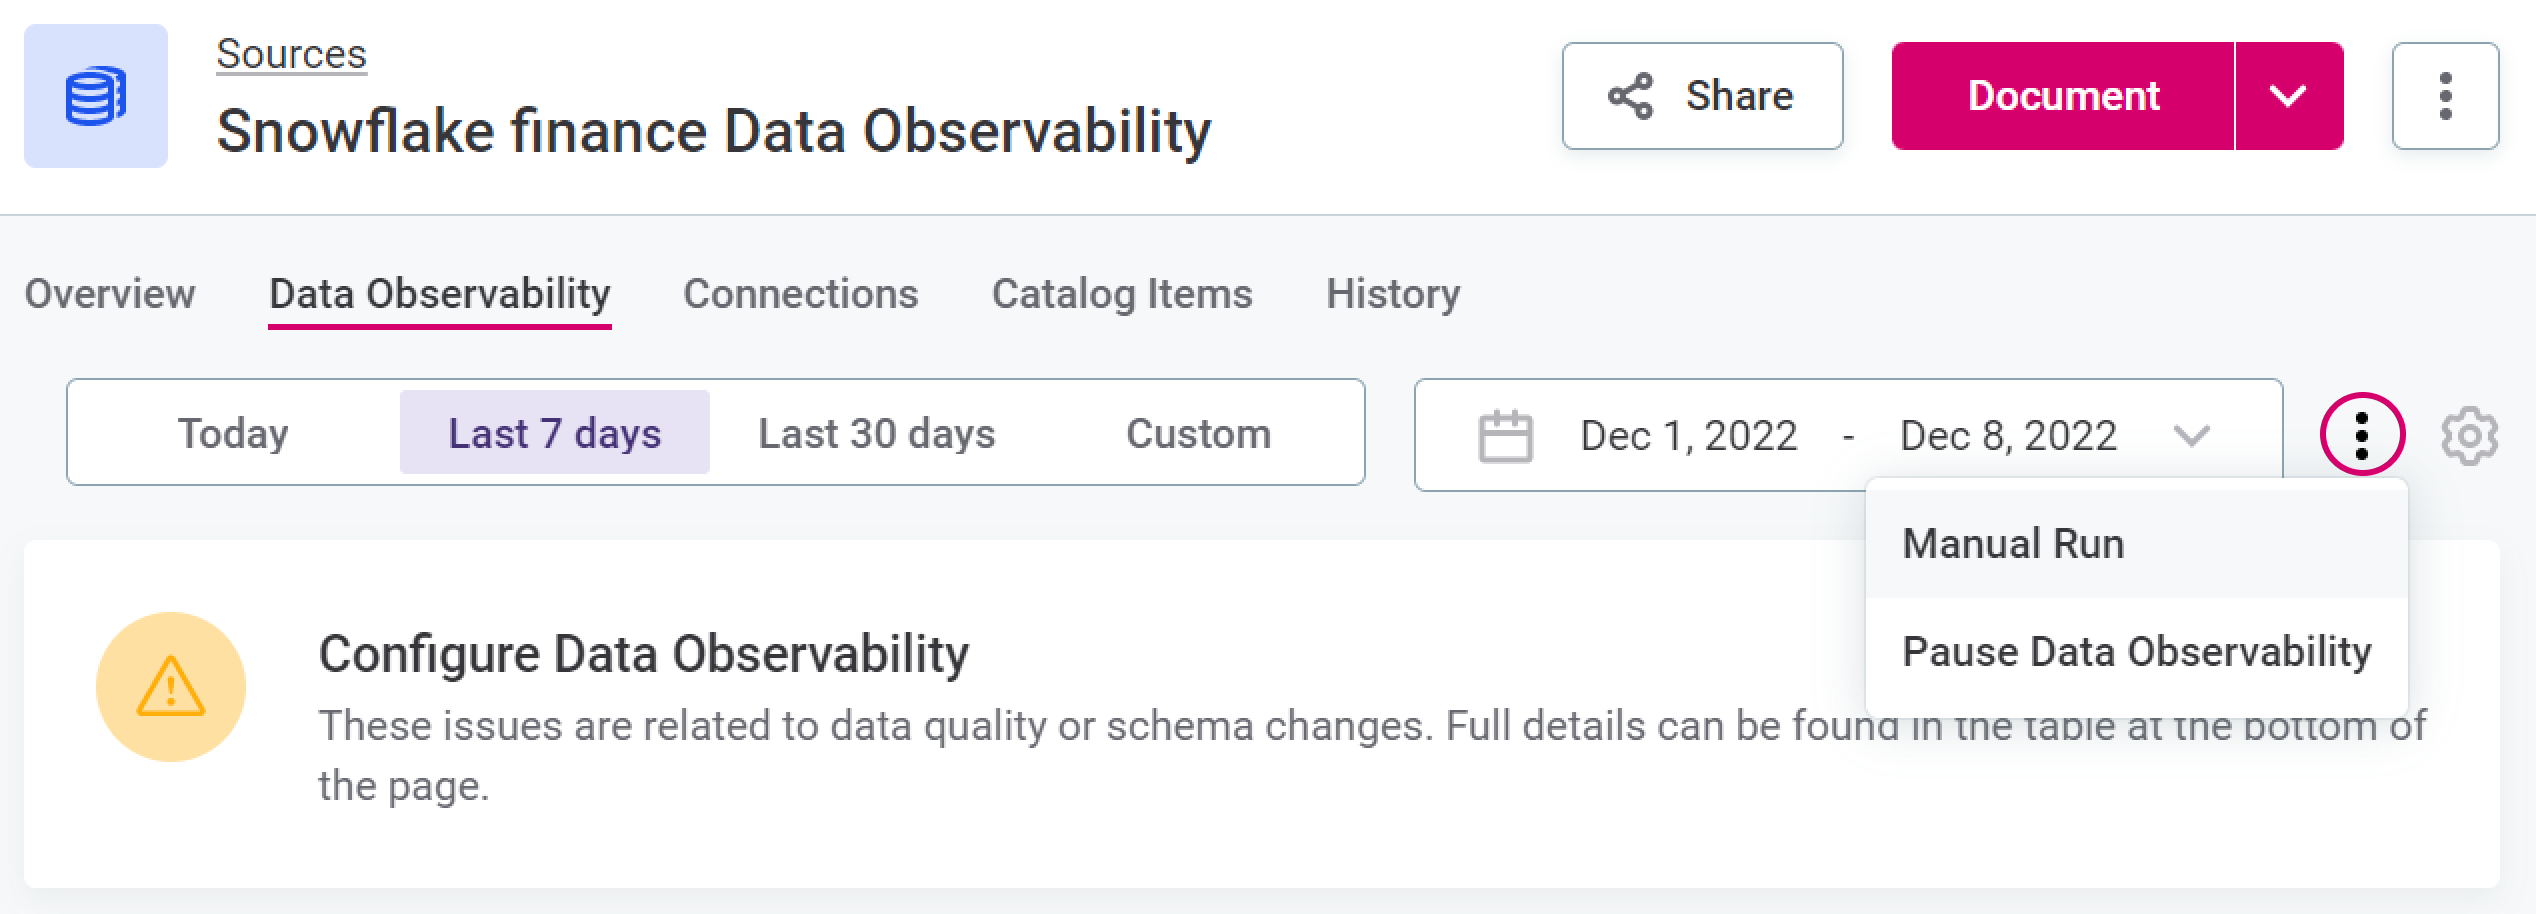
Manual run
To run data observability manually, instead of waiting for the next scheduled run, select the three dots menu and Manual run.
Pause observation
You can pause observation at any point by selecting the three dots menu and Pause Data Observability. This is particularly useful if you need to troubleshoot issues.
| When observability is paused, scheduled monitoring will not be run. |
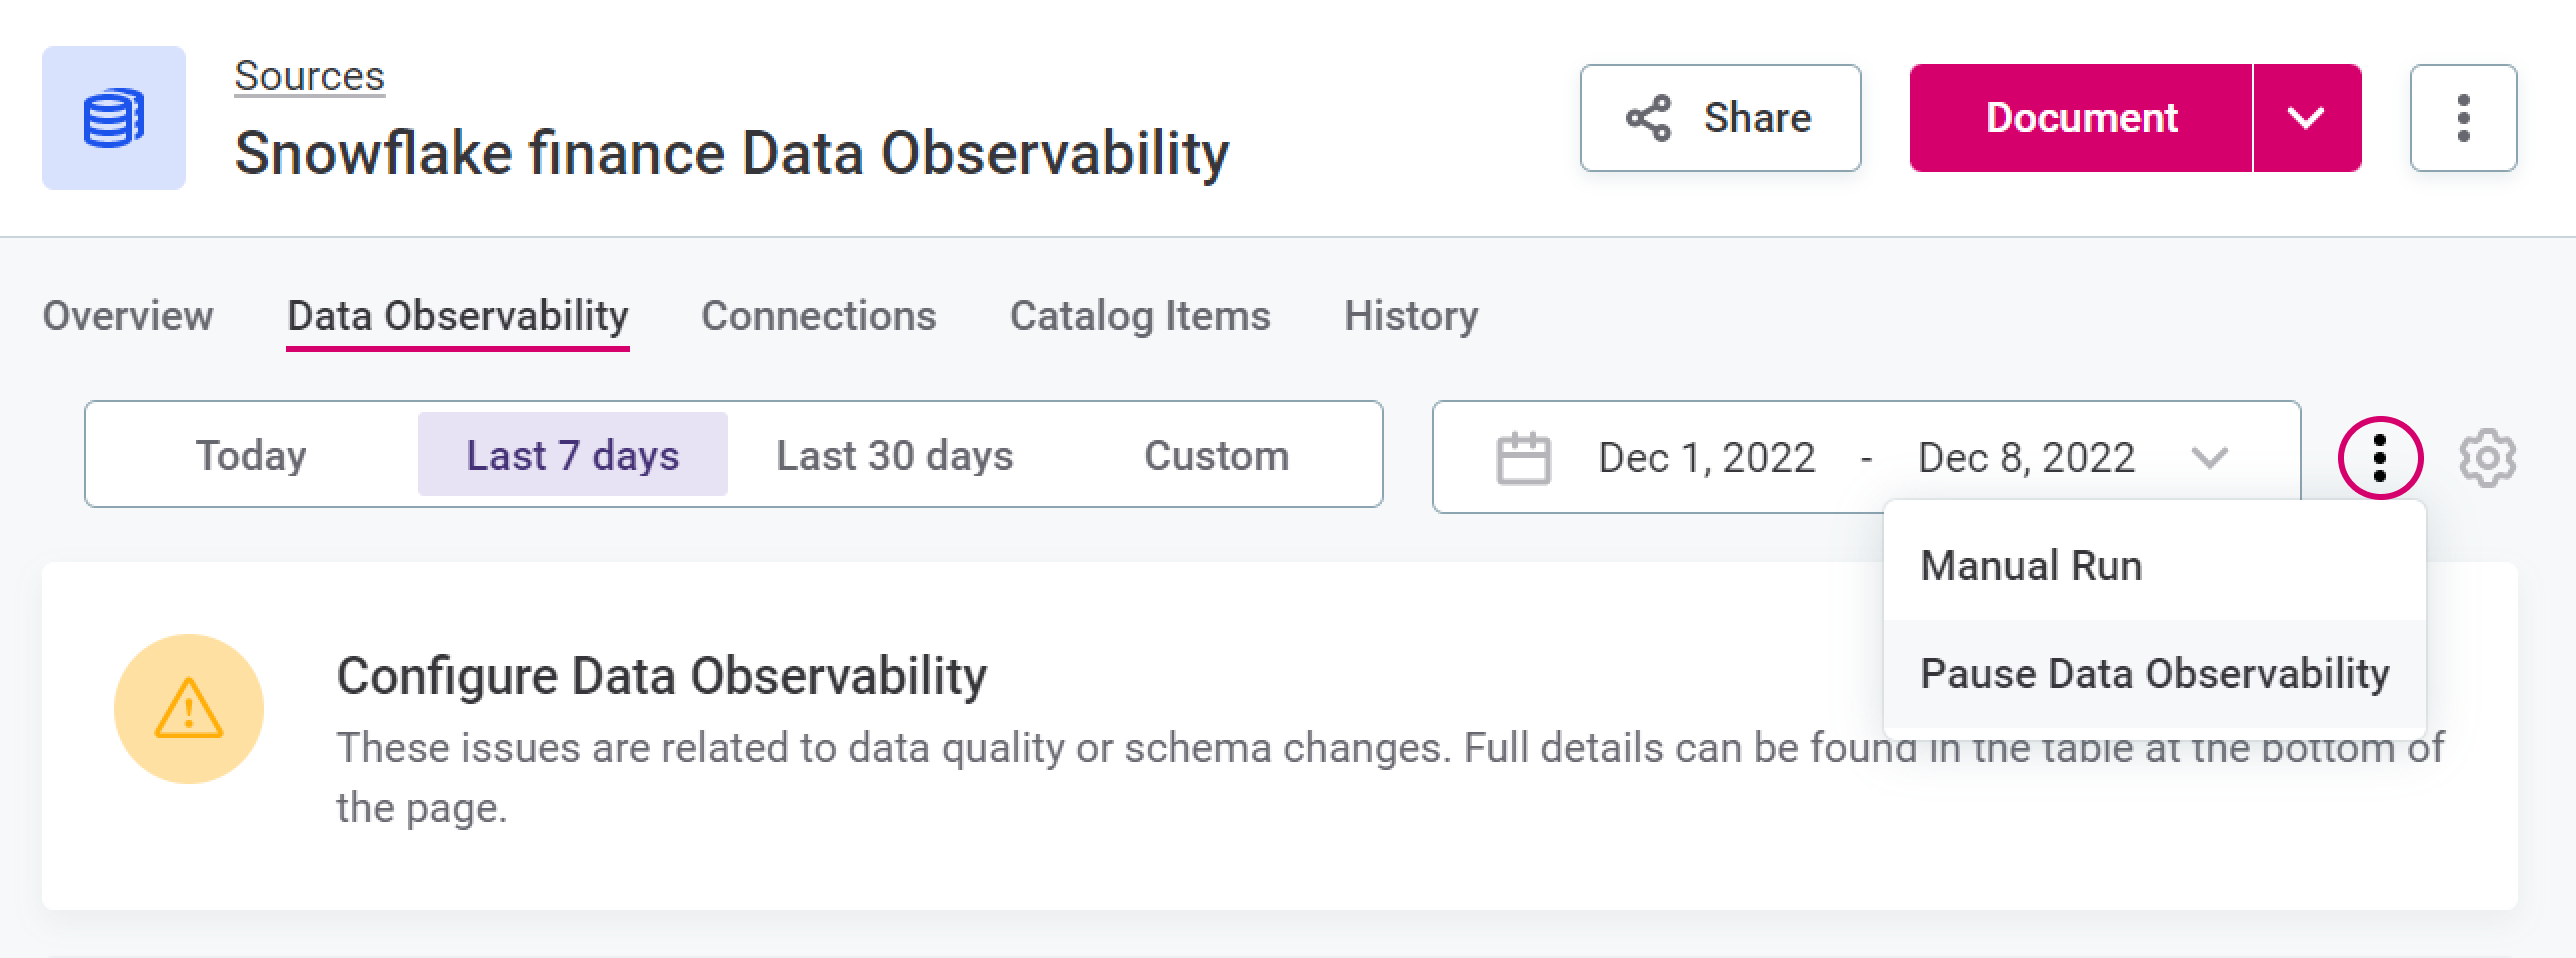
If observability is paused, this is visible both from the data observability home page and within the observed system. Select Resume observation to resume.

Edit configuration
To change the data observability configuration, select settings and follow the instructions in Data Observability.

Anomaly feedback
Profile inspector
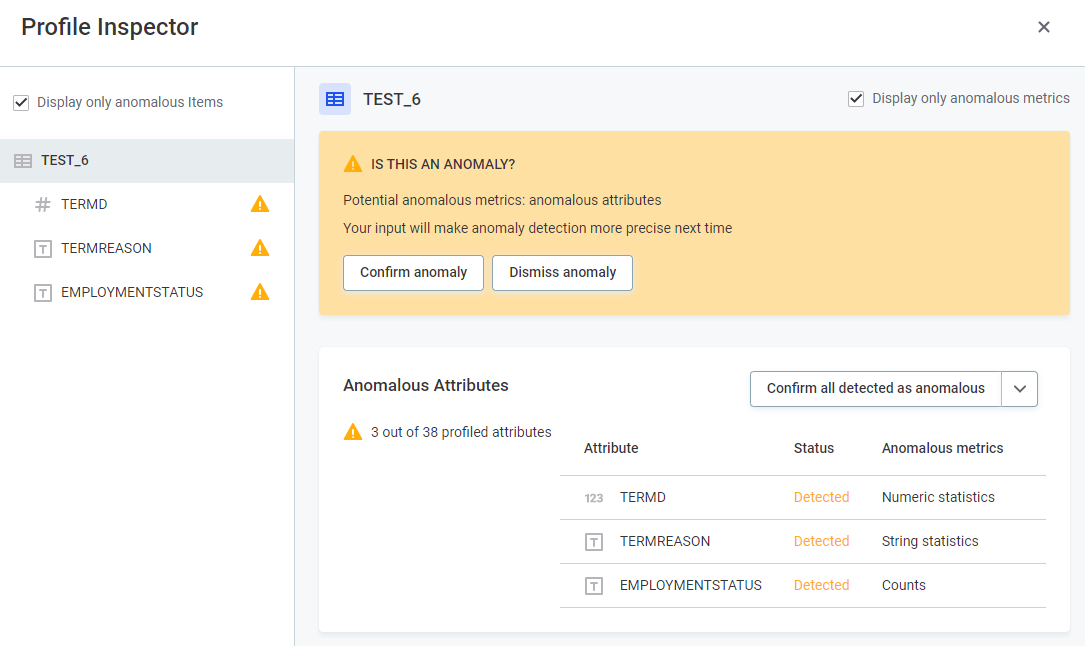
Using the Profile Inspector, you can view all anomalies and confirm or dismiss them as required. To open the Profile Inspector, click the warning icon in the Anomalies column of the table, or, in Recommended, select Explore anomalies.

Once you have opened the profile inspector, you can select whether you would like to view just anomalous items and metrics by using the Display only anomalous items and Display only anomalous metrics options. Before confirming or dismissing the anomaly, you can view the metrics in detail.
Confirm or dismiss anomalies
Once anomalies have been detected, you can either confirm them or dismiss them. The anomaly detection model is constantly improved based on this user feedback.
To do this:
-
Select the required catalog item or attribute in the Profile Inspector, and select Confirm anomaly or Dismiss Anomaly.
-
If an anomaly has been incorrectly confirmed or dismissed, select Review decision.
Confirm or dismiss all
In the Anomalous Attributes widget in Profile inspector, use the dropdown to select either Confirm all detected as anomalous or Dismiss all detected. Anomalies are confirmed or dismissed accordingly.
| If an anomaly is dismissed on a particular attribute, this isn’t overridden if you subsequently select Confirm all detected as anomalous. |
Unconfirmed anomalies
If detected anomalies are not confirmed, the system does not know to exclude them from the expected range. After some time (depending on the length of profiling history), the unsolved anomalies are considered the 'new normal', and a return to the expected values can subsequently be identified as anomalous.
Was this page useful?

