Pinned Values and Formulas
Pinned values in Data Stories enhance your visualizations by highlighting essential data points, facilitating comparisons, and enabling customization through unique formulas. They help you craft meaningful insights, serving as bookmarks for key data points that you can refer back to or utilize in calculations.
Pin values
| Pinned row values cannot be selected directly within the visualization editor. They can only be used within the Pinned Values tab for creating formulas. |
-
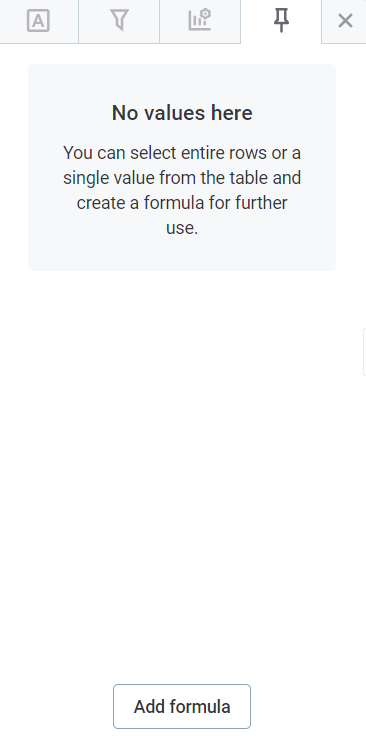
For the visualization you’re currently working on, open the Pinned Values tab from the left-side menu.
If no pinned value has been assigned yet, the tab is empty. Otherwise, it shows all pinned values for the current visualization, including the name, value, and associated attributes (in case you choose to Pin row values).
-
Hover over the value you want to pin within the Metrics or Dimensions column and open the three dots menu.

-
Here you can select:

-
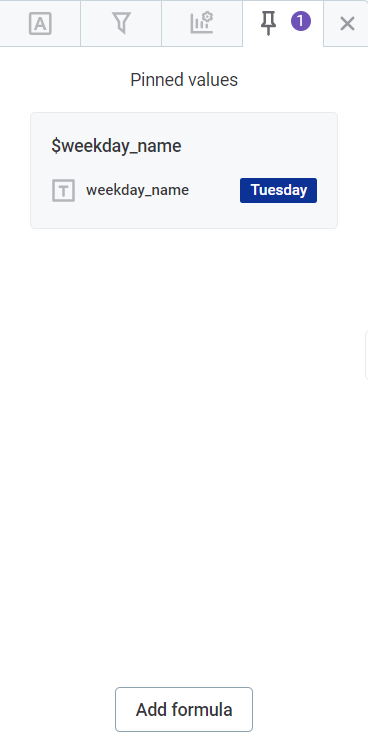
Pin value - The value is saved to the Pinned Values tab and its name is prefixed with a dollar sign (
$).For easier reference, you can rename the value at any time: select it and enter your preferred name instead.
-
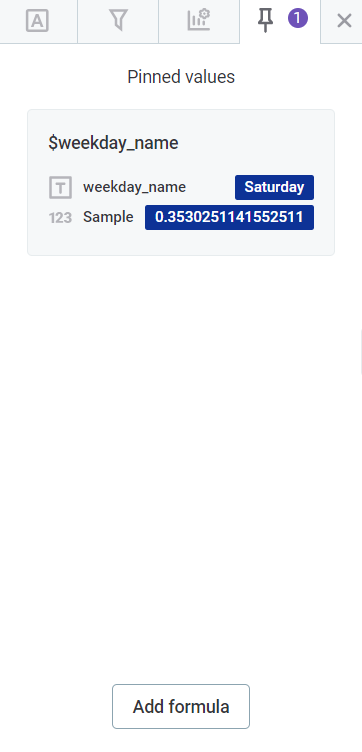
Pin row values - All values from the row selected are saved to the Pinned Values tab and the name is prefixed with a dollar sign (
$).For easier reference, you can rename the value at any time: select it and enter your preferred name instead.
-
| To unpin a value, click the trash icon next to the relevant pinned value. |
Examples
Profit margin Ppinning
Let’s say you’re analyzing a visualization of different products' sales figures. Within the Metrics column, you find the profit margin for Product A to be significantly high.
You can hover over this profit margin, and in the three dots menu choose Pin value.
This pinned value is automatically saved as $profit_margin1, but you can rename it to $ProductA_Margin for clarity.
Sales and costs row pinning
For Product B, you want to save both sales and associated costs for comparison in future formulas.
Hover over the row containing these values, and in the three dots menu select Pin row values.
The row values are saved as $sales_productB and $costs_productB respectively on the Pinned Values tab.
Create formulas
-
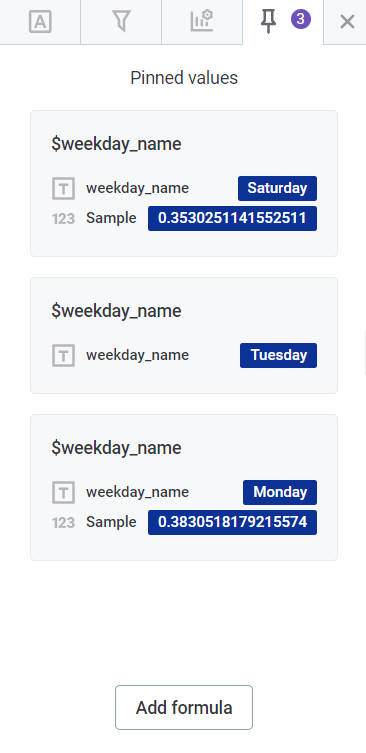
For the visualization you are currently working on, open the Pinned Values tab from the left-side menu.
-
Select Add formula.
-
Enter a formula name and a custom definition using standard mathematical operators.
The definition must follow this format:
$name.attributename. You can then include the operators for the desired operation.By default, the name of the formula is prefixed with a hashtag ( #).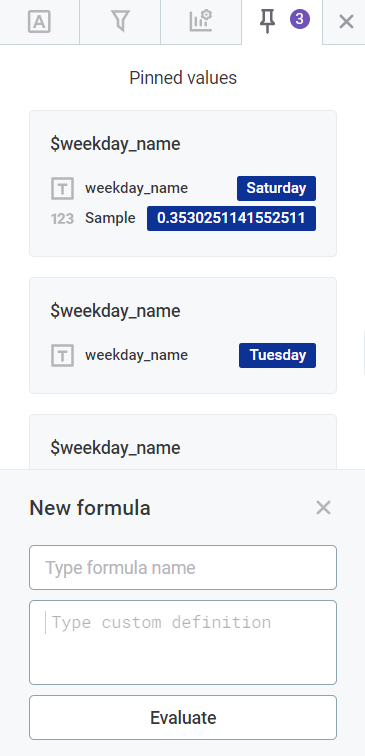
-
Select Evaluate. The formula is added to the list on the Pinned Values tab and the result of your calculation is displayed under it.
You can edit this formula at any time: select the pencil icon and provide a new definition.
Examples
Profit calculation
After pinning sales and cost values for Product B as $sales_productB and $costs_productB, you decide to calculate the profit.
-
Select Add formula.
-
Name it
Profit_ProductB. -
Enter the definition:
$sales_productB - $costs_productB. -
Select Evaluate. The result displays the profit for Product B.
ROI calculation
Suppose you’ve also pinned an investment value for a marketing campaign as $investment1.
To determine the Return on Investment (ROI) using the profit from Product B:
-
Select Add formula.
-
Name it
ROI_ProductB. -
Enter the definition:
($Profit_ProductB / $investment1) * 100. -
Select Evaluate. The result displays the ROI percentage for Product B based on the marketing campaign’s investment.
| For more details and additional examples of the operators you can use in your formulas, see the math.js syntax documentation. |
Was this page useful?
