
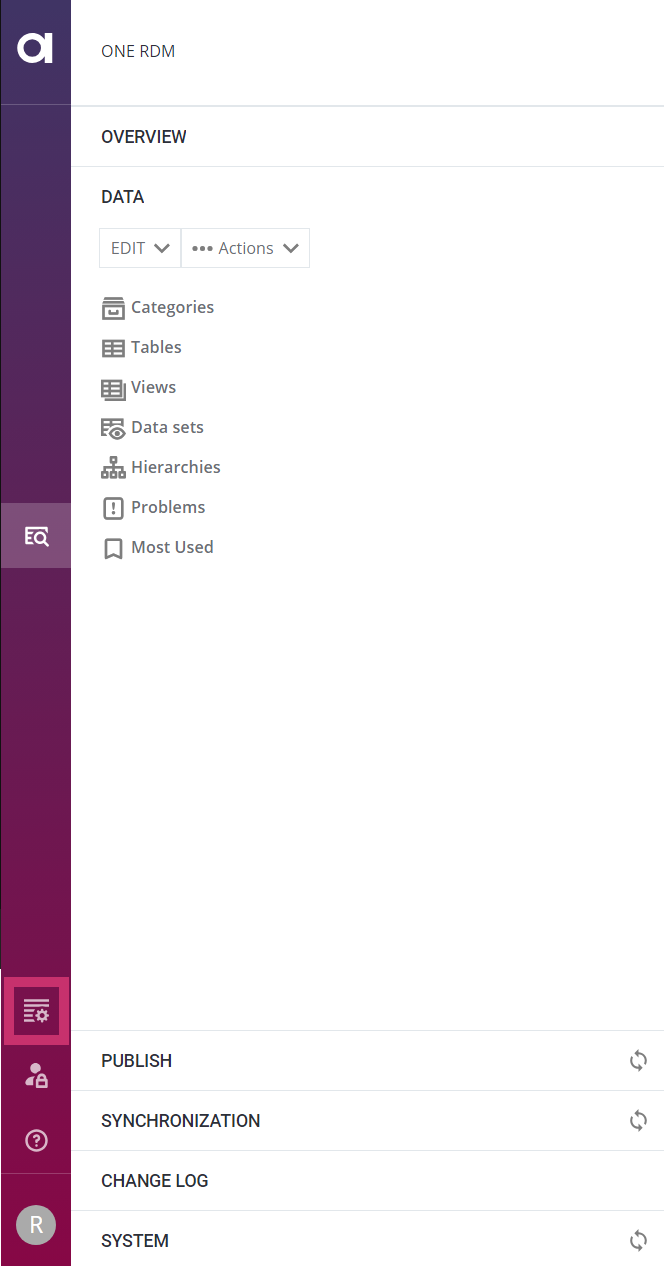
RDM Admin Console
The RDM Admin Console lets you monitor and manage how RDM operates.
It is available at the http://{rdm_url}:8060/admin endpoint and also on the RDM Admin Console tab of the RDM Web Application.
Navigation
The RDM Admin Console consists of the following tabs:
-
(1) Overview
-
(2) Monitoring
-
(3) Server Dashboard
-
(4) Reference Data Management (this takes you back to RDM Web Application)
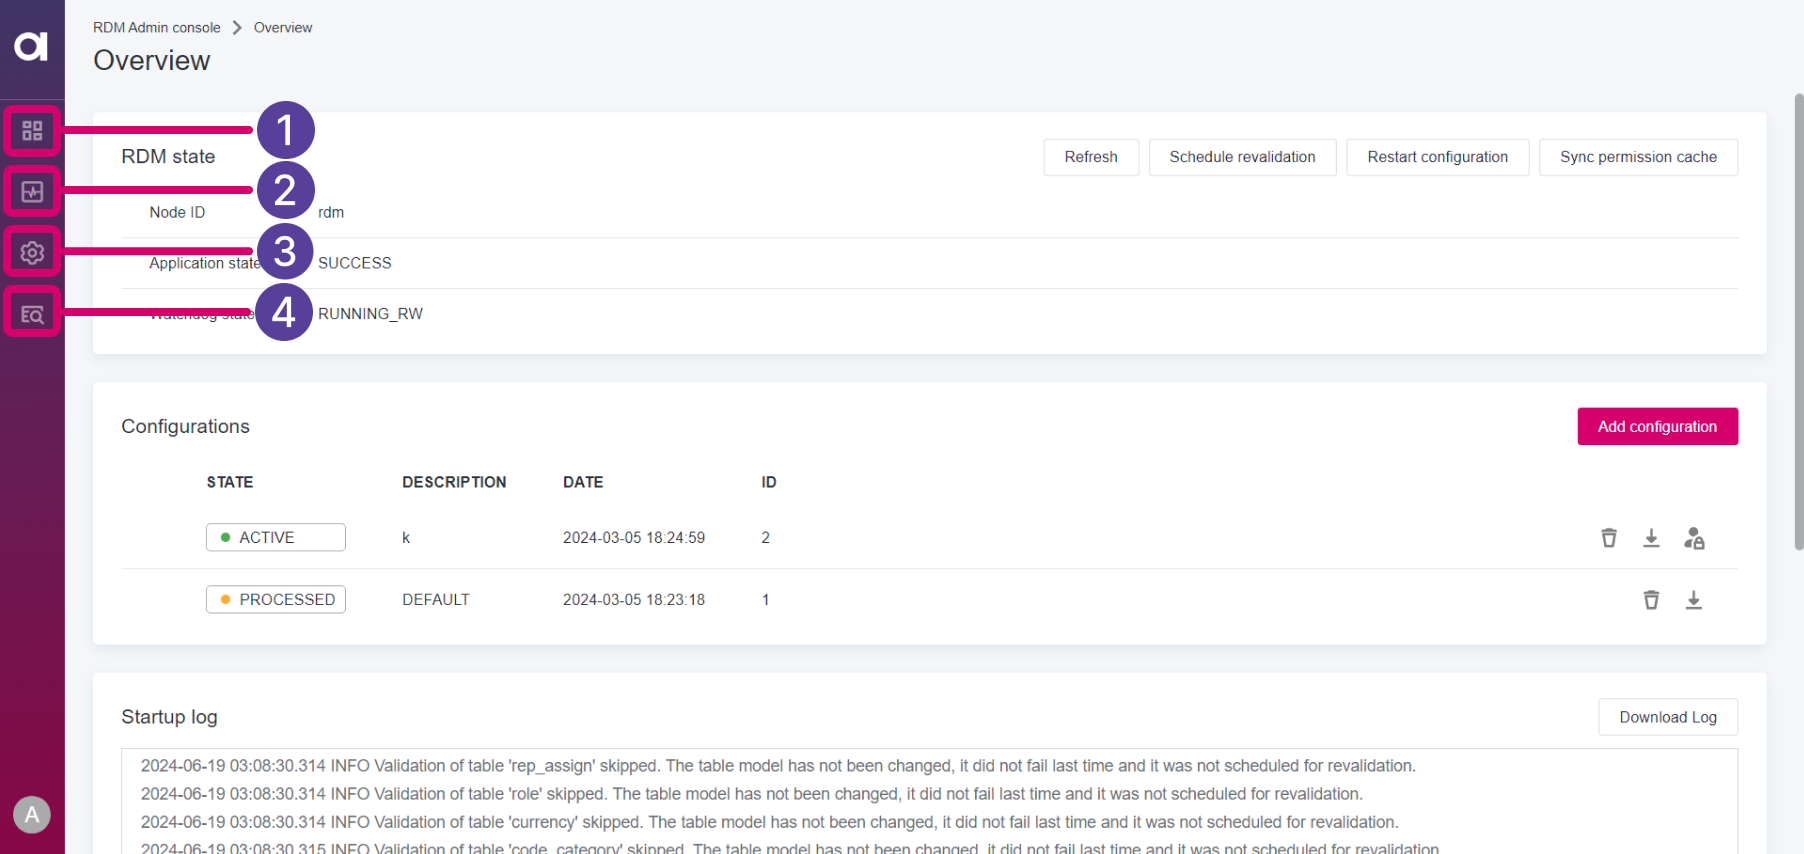
Overview
Monitor RDM state and add new configurations.
The screen consists of the following sections:
-
(1) RDM state
-
(2) Configurations
-
(3) Startup log
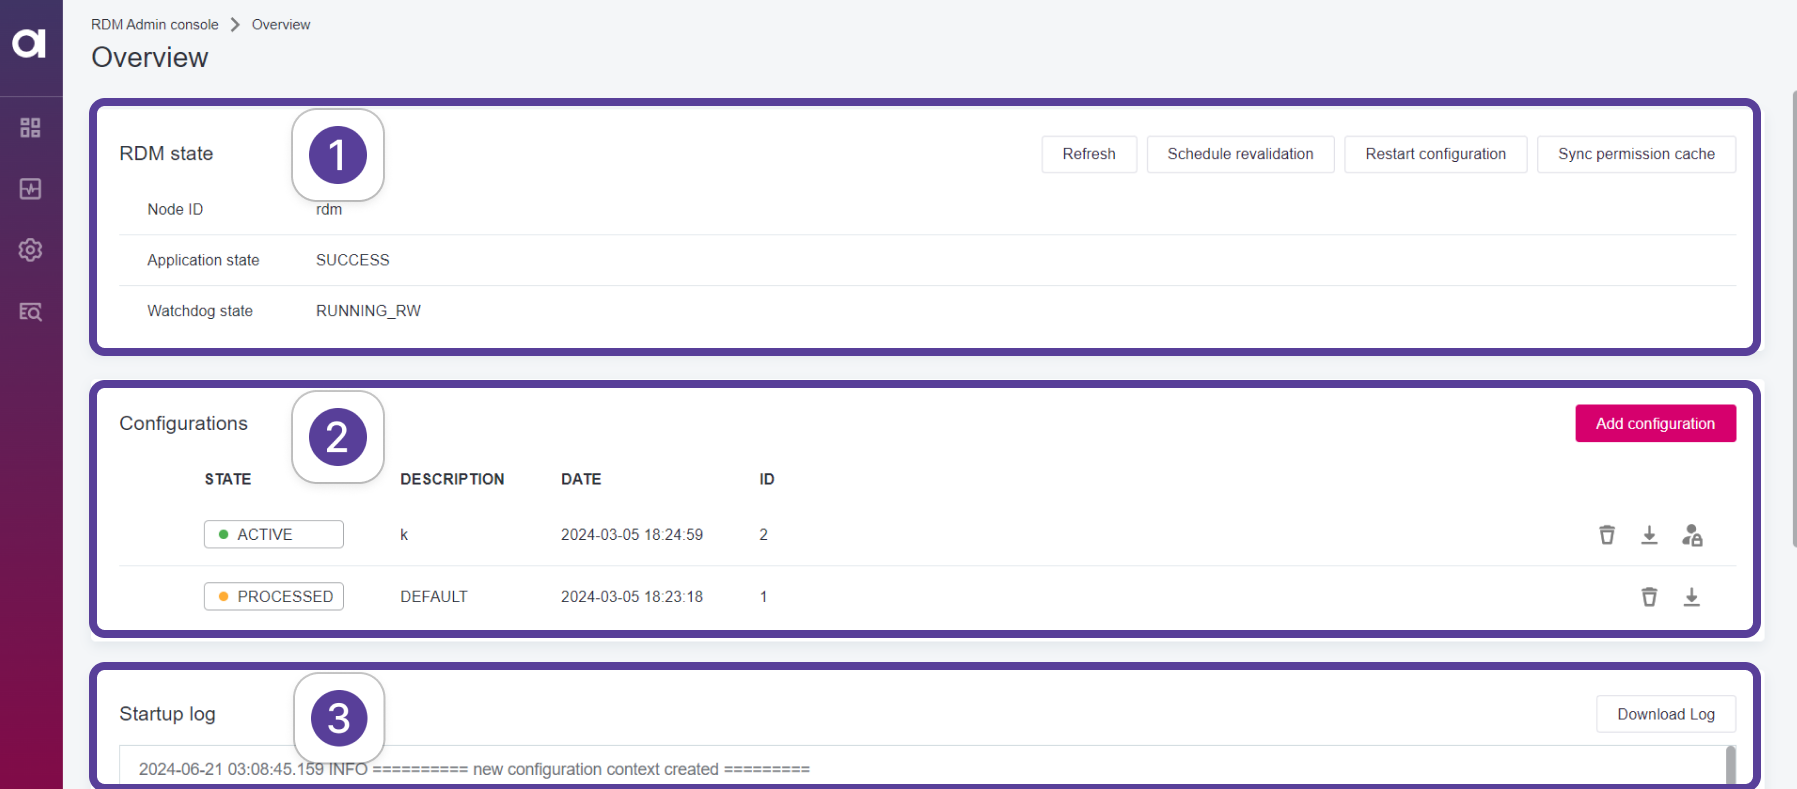
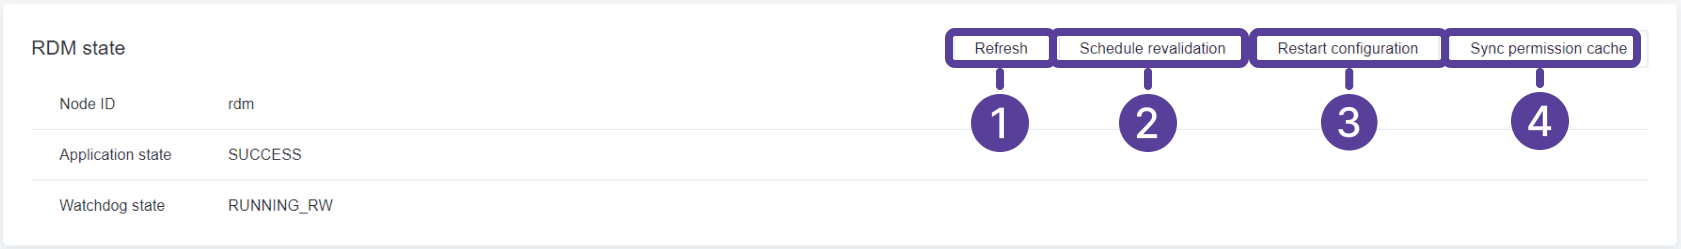
RDM state
Here you can monitor the state of RDM and perform the following actions:
-
(1) Refresh: Refresh state indicators.
-
(2) Schedule revalidation: Schedule revalidation of all records on next restart.
-
(3) Configuration restart: Restart the configuration.
-
(4) Sync permission cache: Sync the permission cache.
Configurations
Manage RDM configurations.
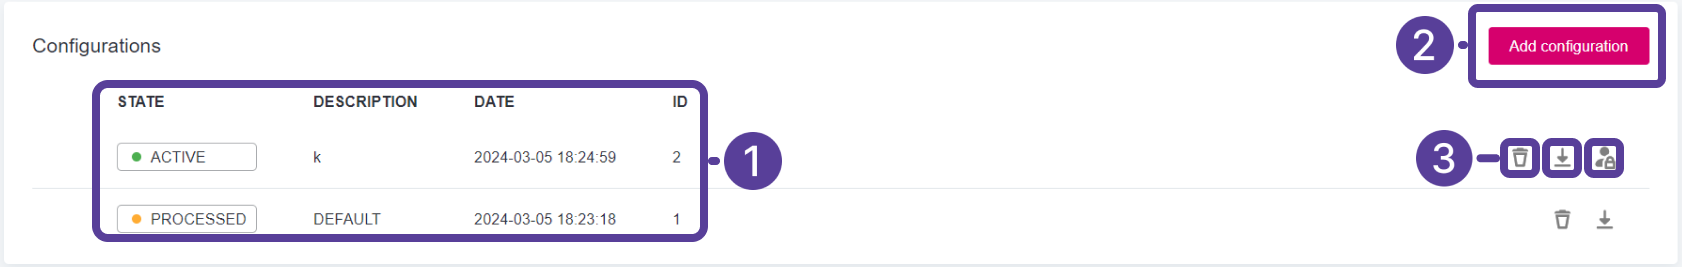
-
(1) View active and previous configurations.
-
(2) Add configuration: Upload new configurations as
zipfiles.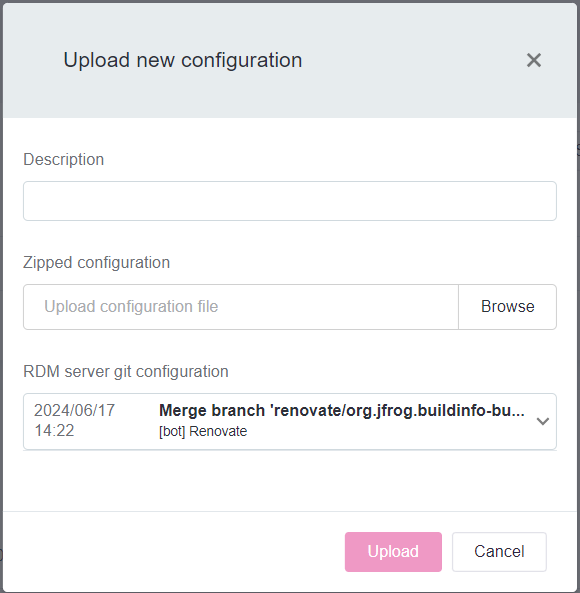
For more information, see How to Deploy an RDM Web App Configuration and RDM Deployment Guide.
-
(3) The following actions are available:
-
Delete configuration: Remove configurations from RDM.
For expert users only.
Deleting configurations, especially the active one, can cause startup failures due to database and model inconsistencies. To use a different configuration, upload it from a backup and apply it instead.
For more details, see How to Deploy an RDM Web App Configuration.
-
Download configuration: Download the configuration
zipfile. -
Apply roles from configuration: Apply role mapping from the active configuration.
-

Monitoring
Provides in-depth RDM monitoring.
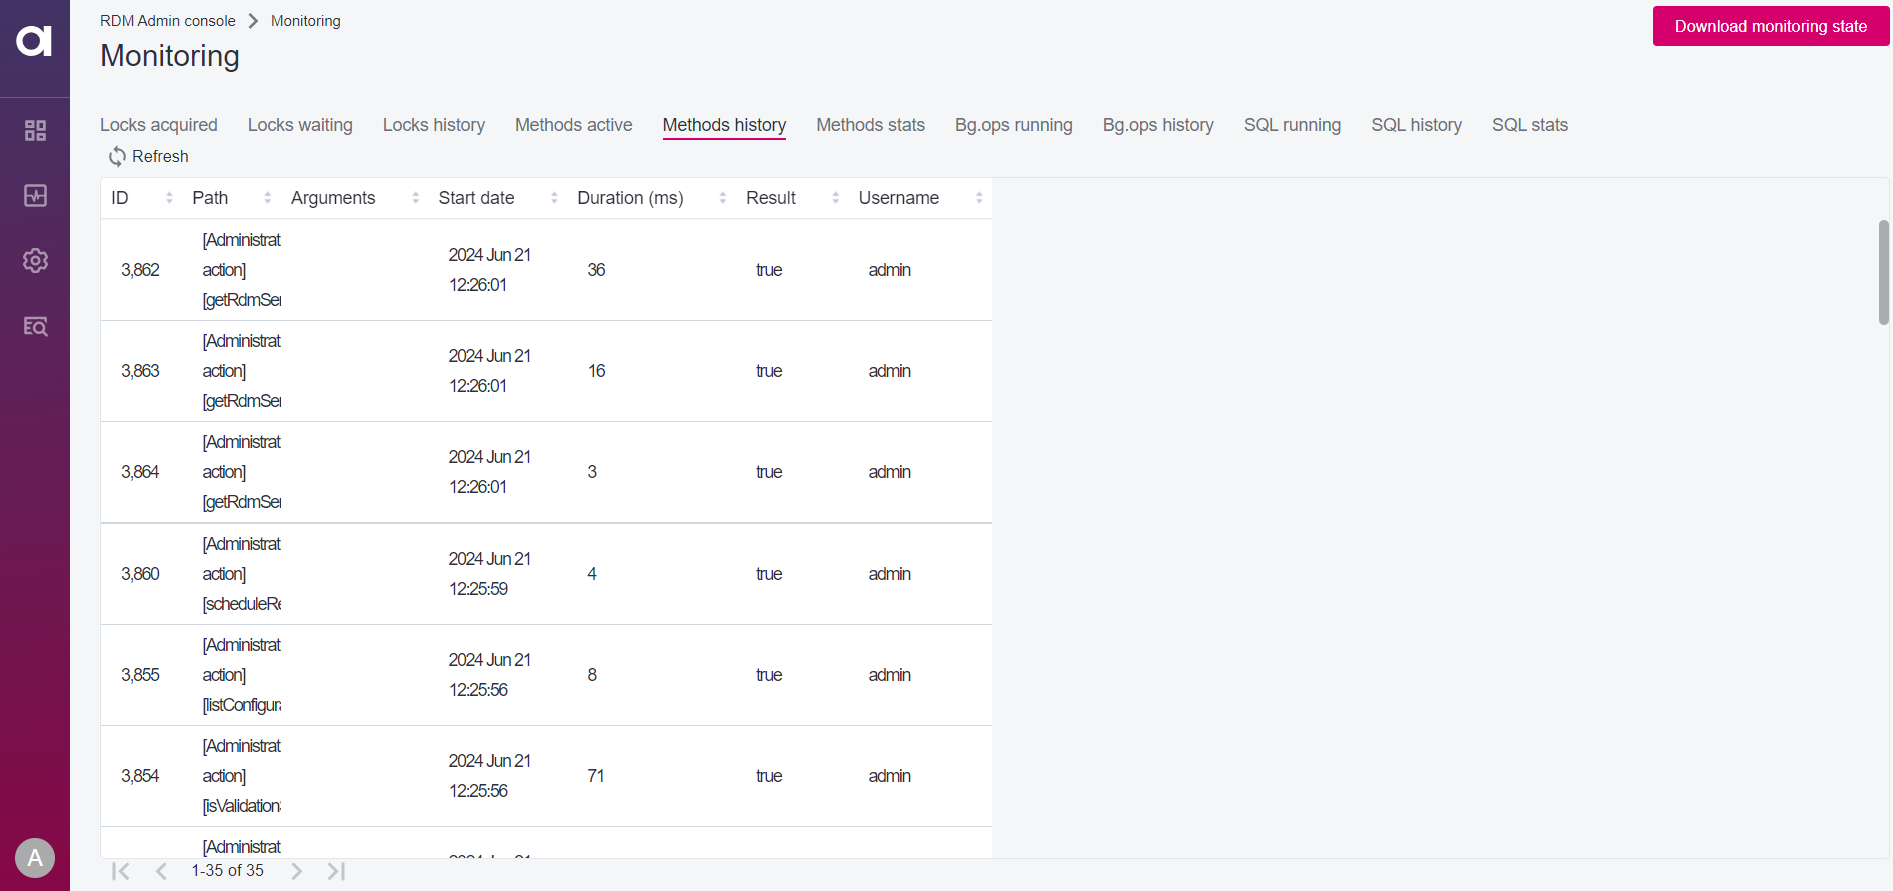
You can monitor the following parameters:
-
Locks acquired
-
Locks waiting
-
Locks history
-
Methods active
-
Methods history
-
Big operations running
-
Big operations history
-
SQL running
-
SQL history
-
SQL stats
To download these stats in the form of zipped csv files, select Download monitoring state.
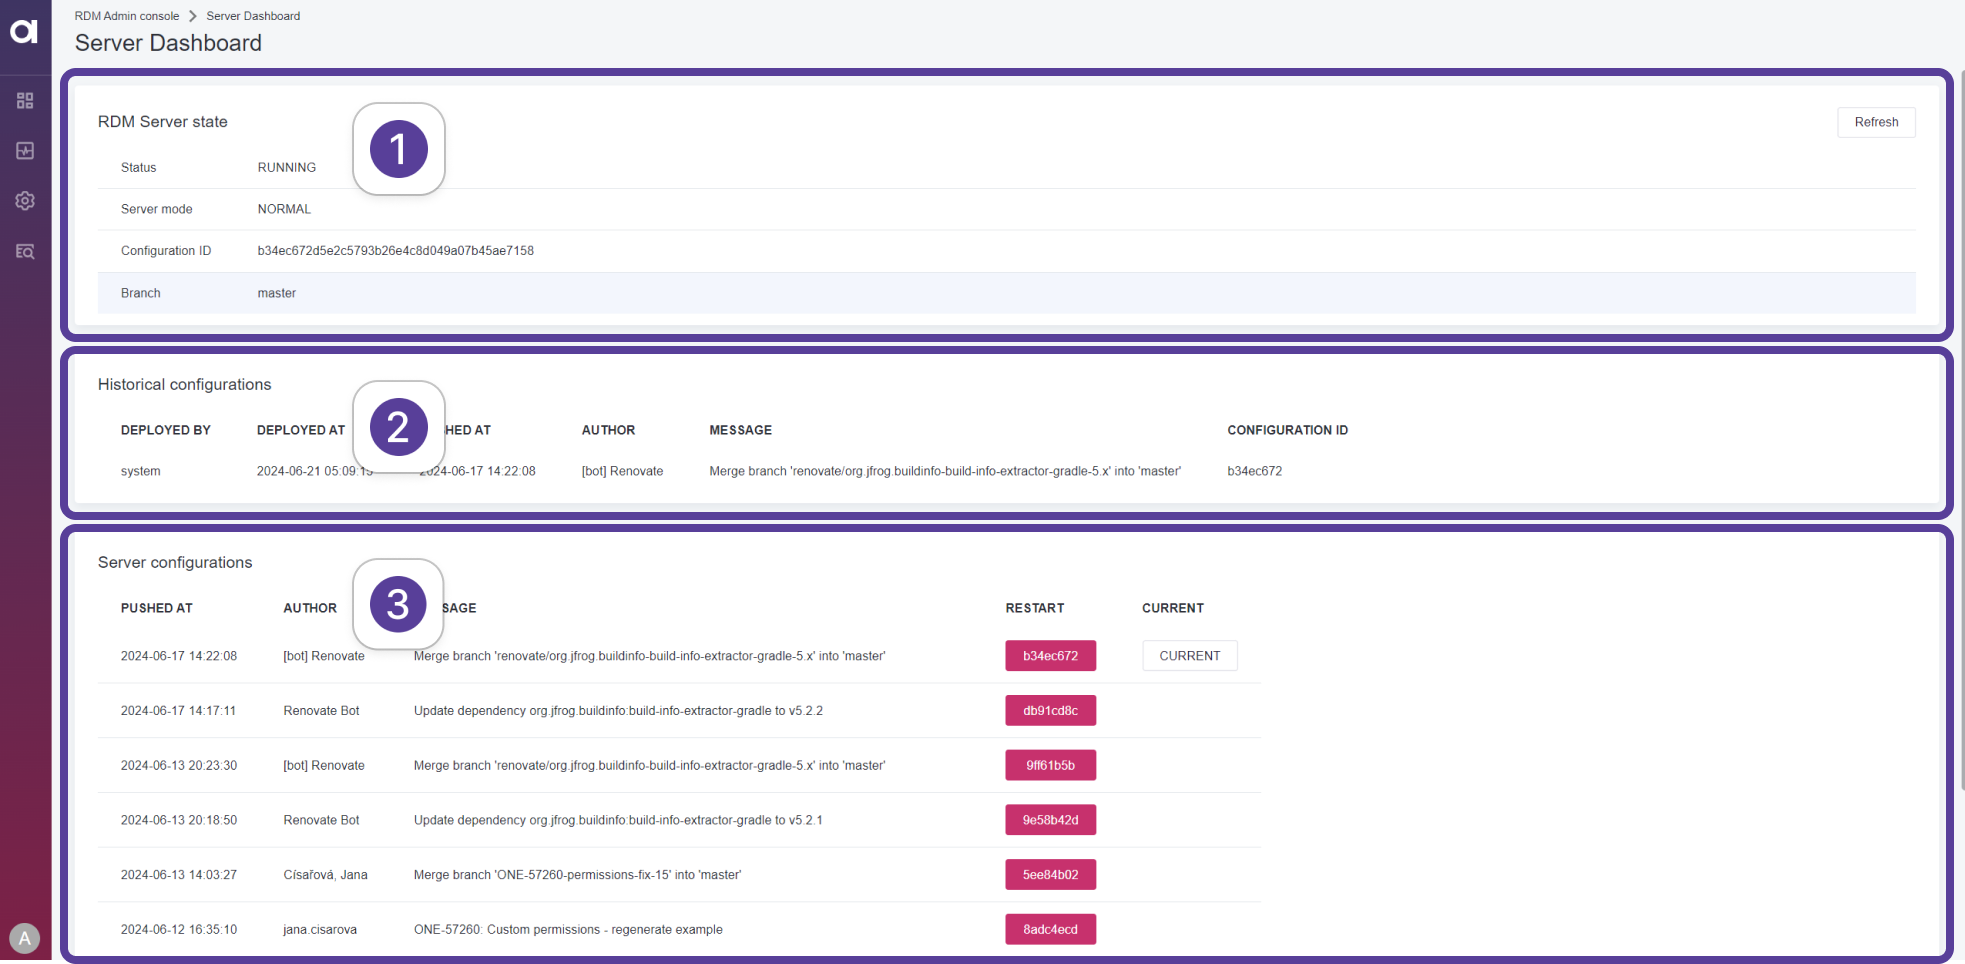
Server Dashboard
| Available for Ataccama Cloud deployments only. See RDM Deployment Guide. |
The Server Dashboard lets you monitor and manage RDM Runtime Server from RDM Web Application.
It consists of the following sections:
-
(1) RDM Server state: Shows the current state of the RDM server, including:
-
Status
-
Server mode
-
Configuration ID
-
Branch
-
-
(2) Historical configurations: Shows information about previous configurations.
-
(3) Server configurations: Shows available configurations from the connected Git server. Switch configurations by selecting the configuration ID in the RESTART column.
Was this page useful?