RDM Admin Console
The RDM Admin Console lets you monitor and manage how RDM operates. It is available at the http://{rdm_url}:8060/admin` endpoint and also on the RDM Admin Console tab of the RDM Web Application.
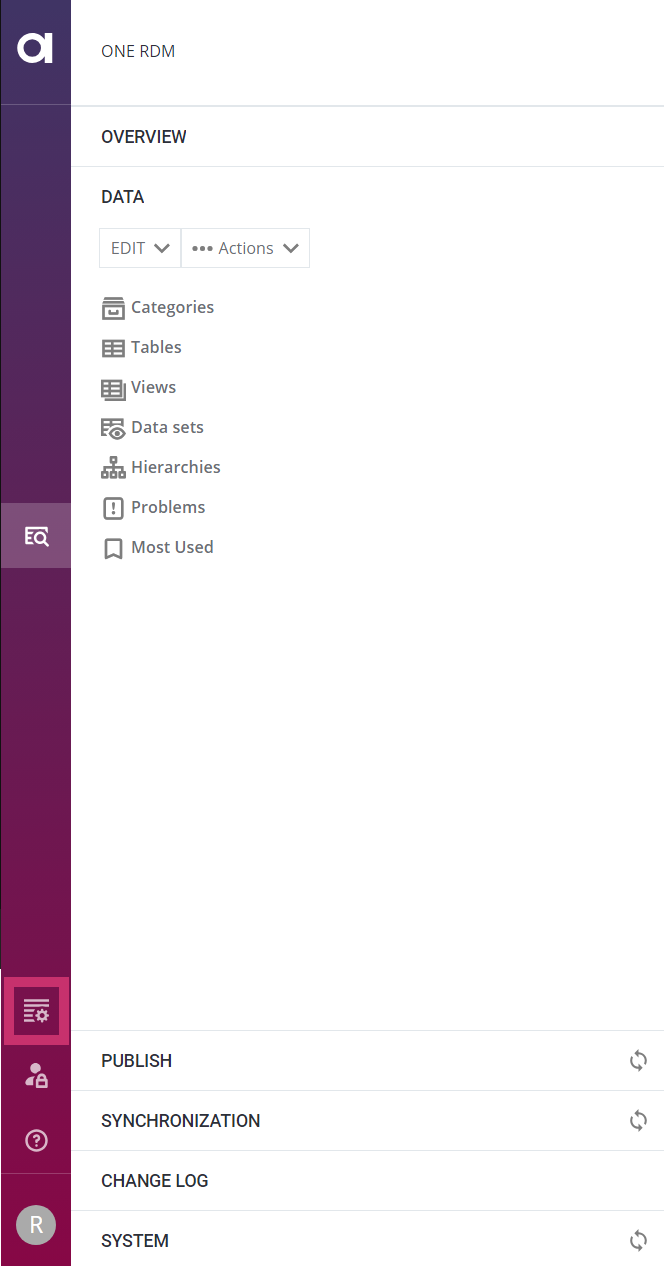
The following article is a user guide for the RDM Admin Console.
Navigation
The RDM Admin Console consists of the following tabs.
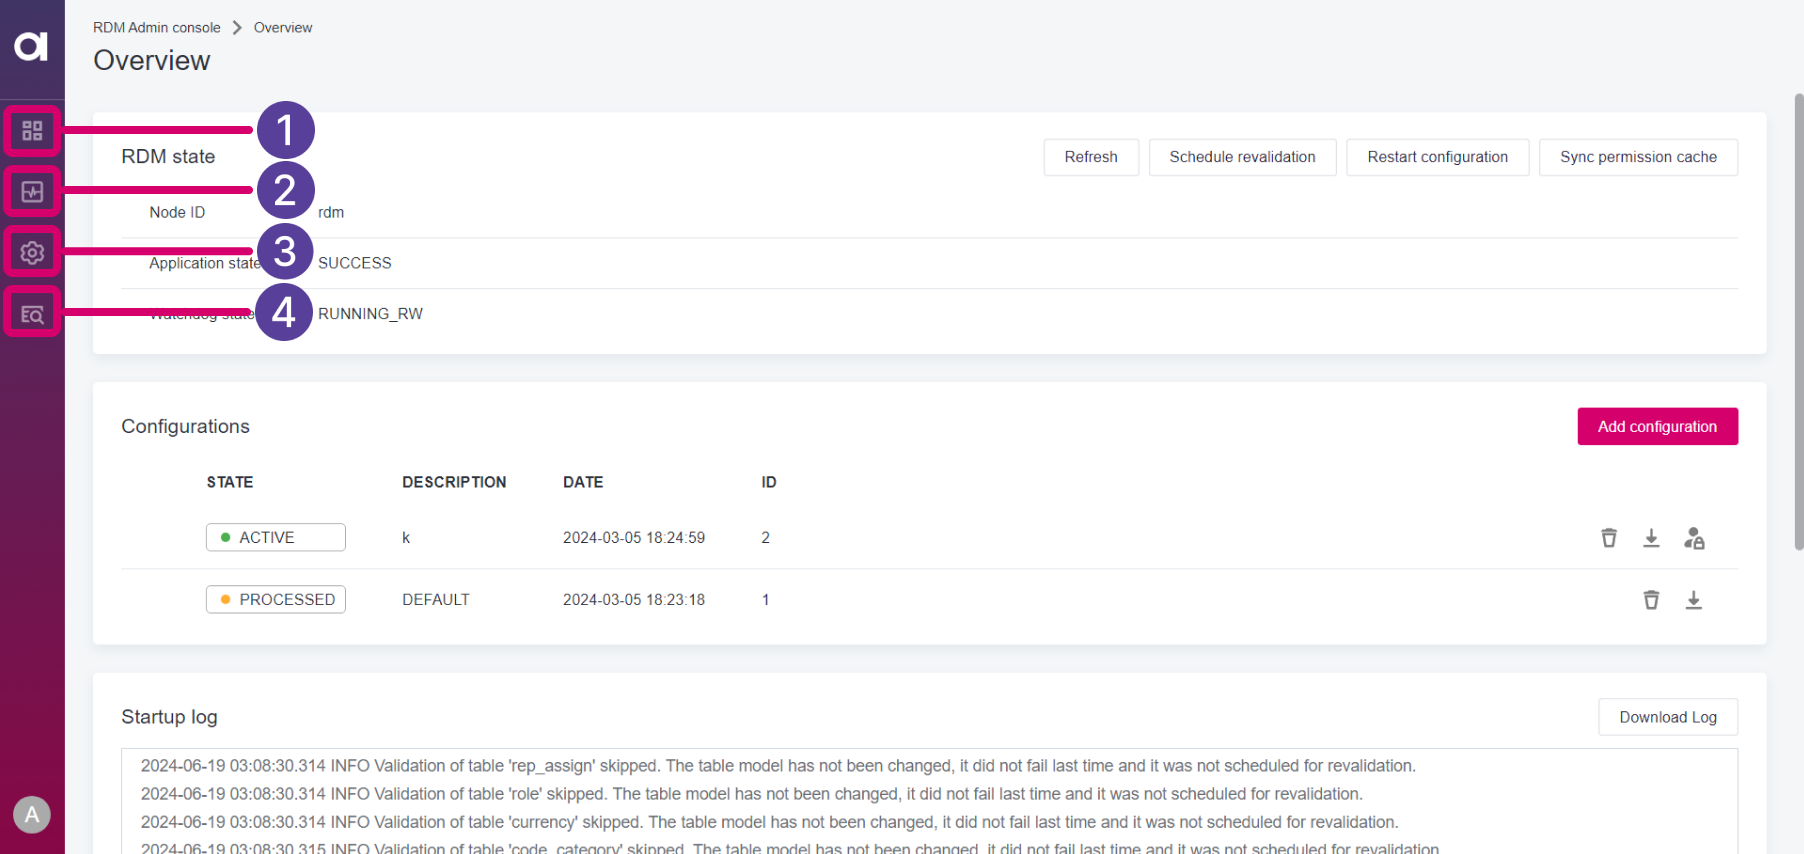
-
(1) Overview
-
(2) Monitoring
-
(3) Server Dashboard
-
(4) Reference Data Management (this tab takes you back to RDM Web Application)
Overview
The Overview tab lets you monitor the state of RDM and add new configurations.
It consists of the following sections:
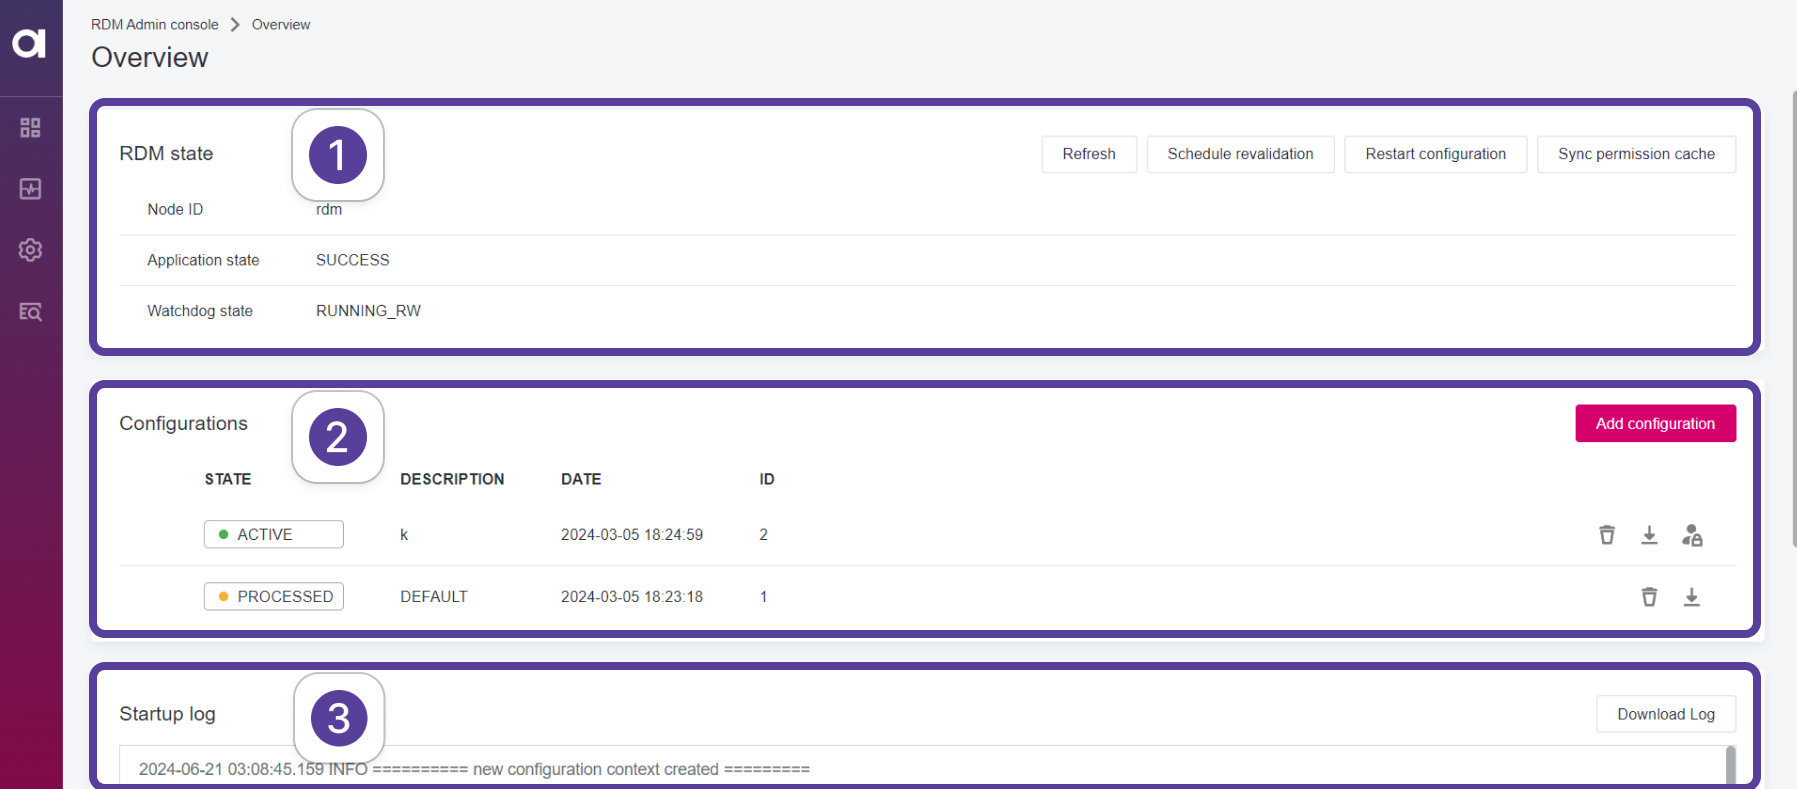
-
(1) RDM state
-
(2) Configurations
-
(3) Startup log
RDM state
Here you can monitor the state of RDM. You can also perform the following actions:

-
(1) Refresh: Refresh the state indicators.
-
(2) Schedule revalidation: Schedule a revalidation of all records on next restart.
-
(3) Configuration restart: Restart the configuration.
-
(4) Sync permission cache: Sync the permission cache.
Configurations
The Configurations section lets you manage RDM configurations.

You can:
-
(1) View information about active and previously processed configurations.
-
(2) Add configuration: Upload new configurations in the form of a
zipfile.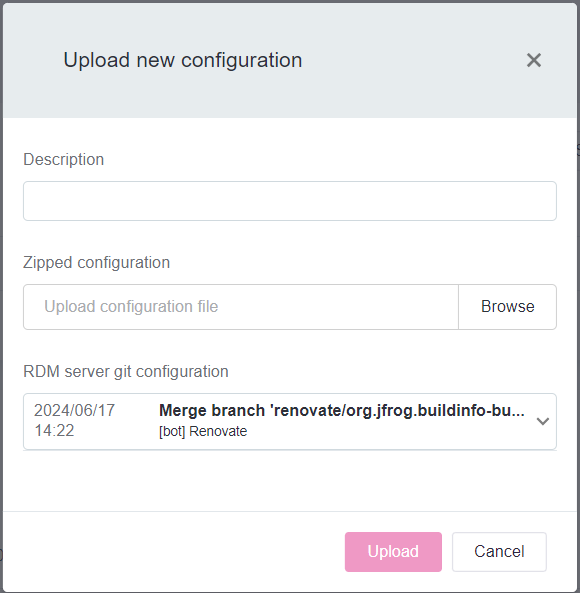
For more information, see How to Deploy an RDM Web App Configuration and RDM Deployment Guide.
-
(3) Perform the following actions on the uploaded configurations:
-
Delete configuration: Removes configurations from RDM.
This action is meant for expert users, most of the time there is no need to delete configurations, especially the current active one. For more information, see How to Deploy an RDM Web App Configuration. -
Download configuration: Downloads the
zipfile containing a configuration. -
Apply roles from configuration: Applies the role mapping from this configuration. This action can only be performed based on the current active configuration.
-
Monitoring
The Monitoring tab provides in-depth monitoring of RDM.
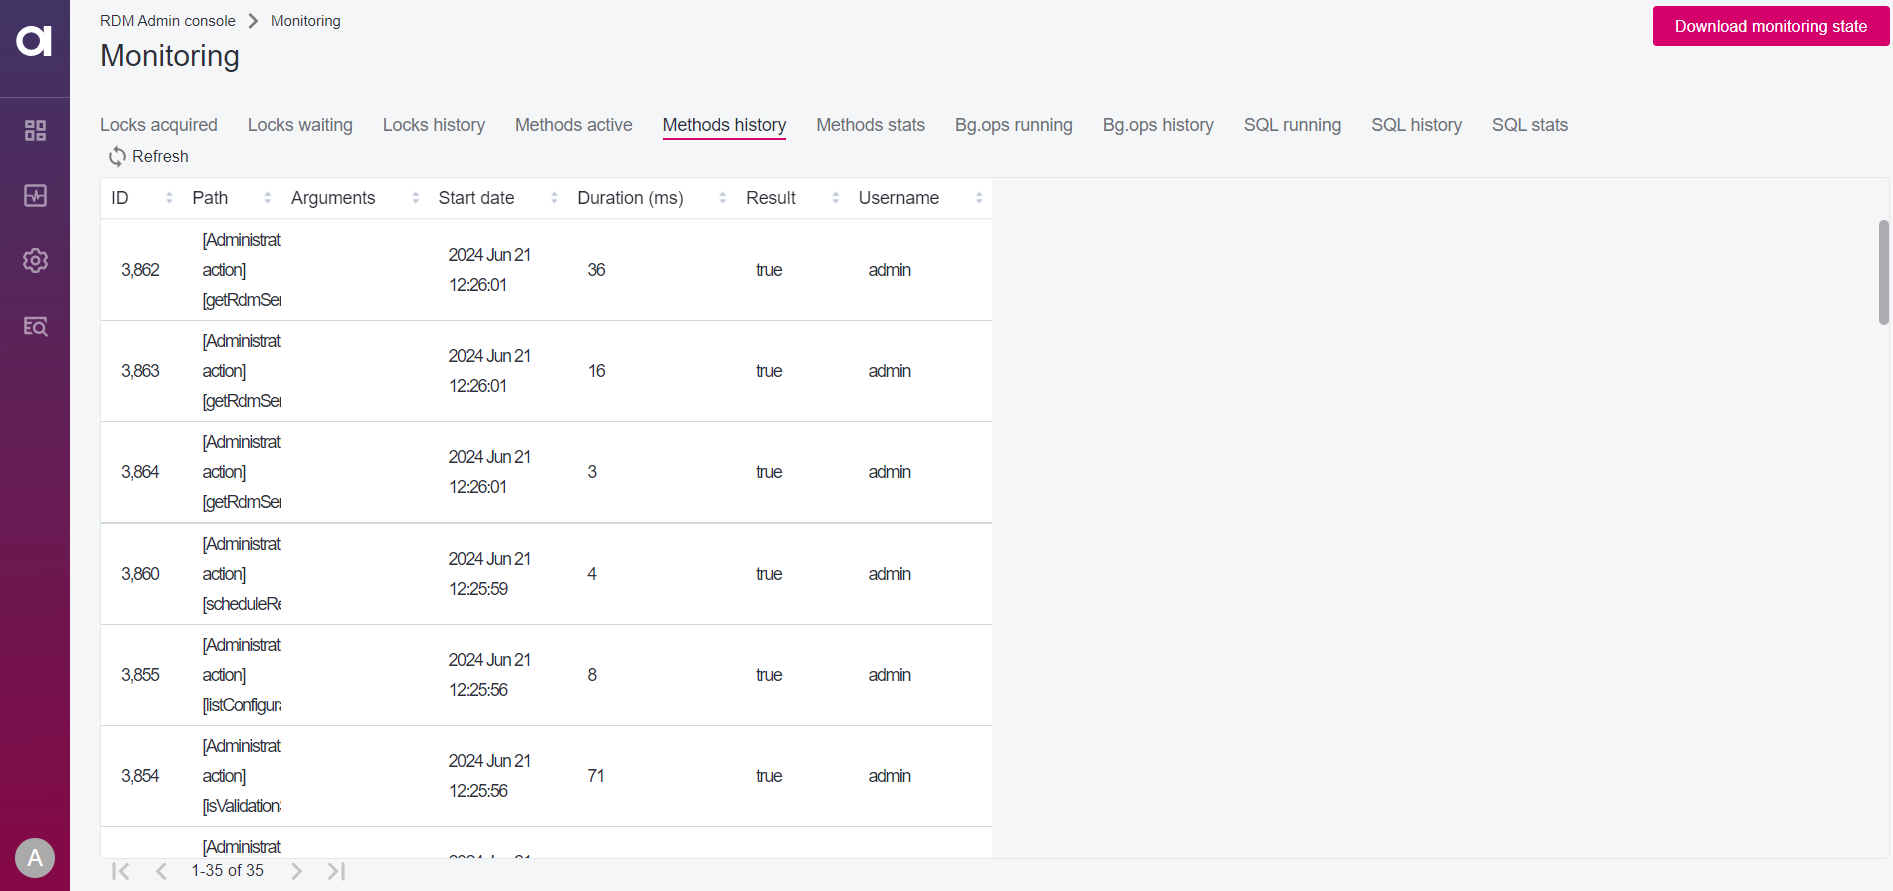
You can monitor the following parameters:
-
Locks acquired
-
Locks waiting
-
Locks history
-
Methods active
-
Methods history
-
Big operations running
-
Big operations history
-
SQL running
-
SQL history
-
SQL stats
To download these stats in the form of zipped csv files, select Download monitoring state.
Server Dashboard
| The Server Dashboard is only available for Ataccama Cloud deployments. For more information, see RDM Deployment Guide. |
The Server Dashboard lets you monitor and manage RDM Runtime Server from RDM Web Application.
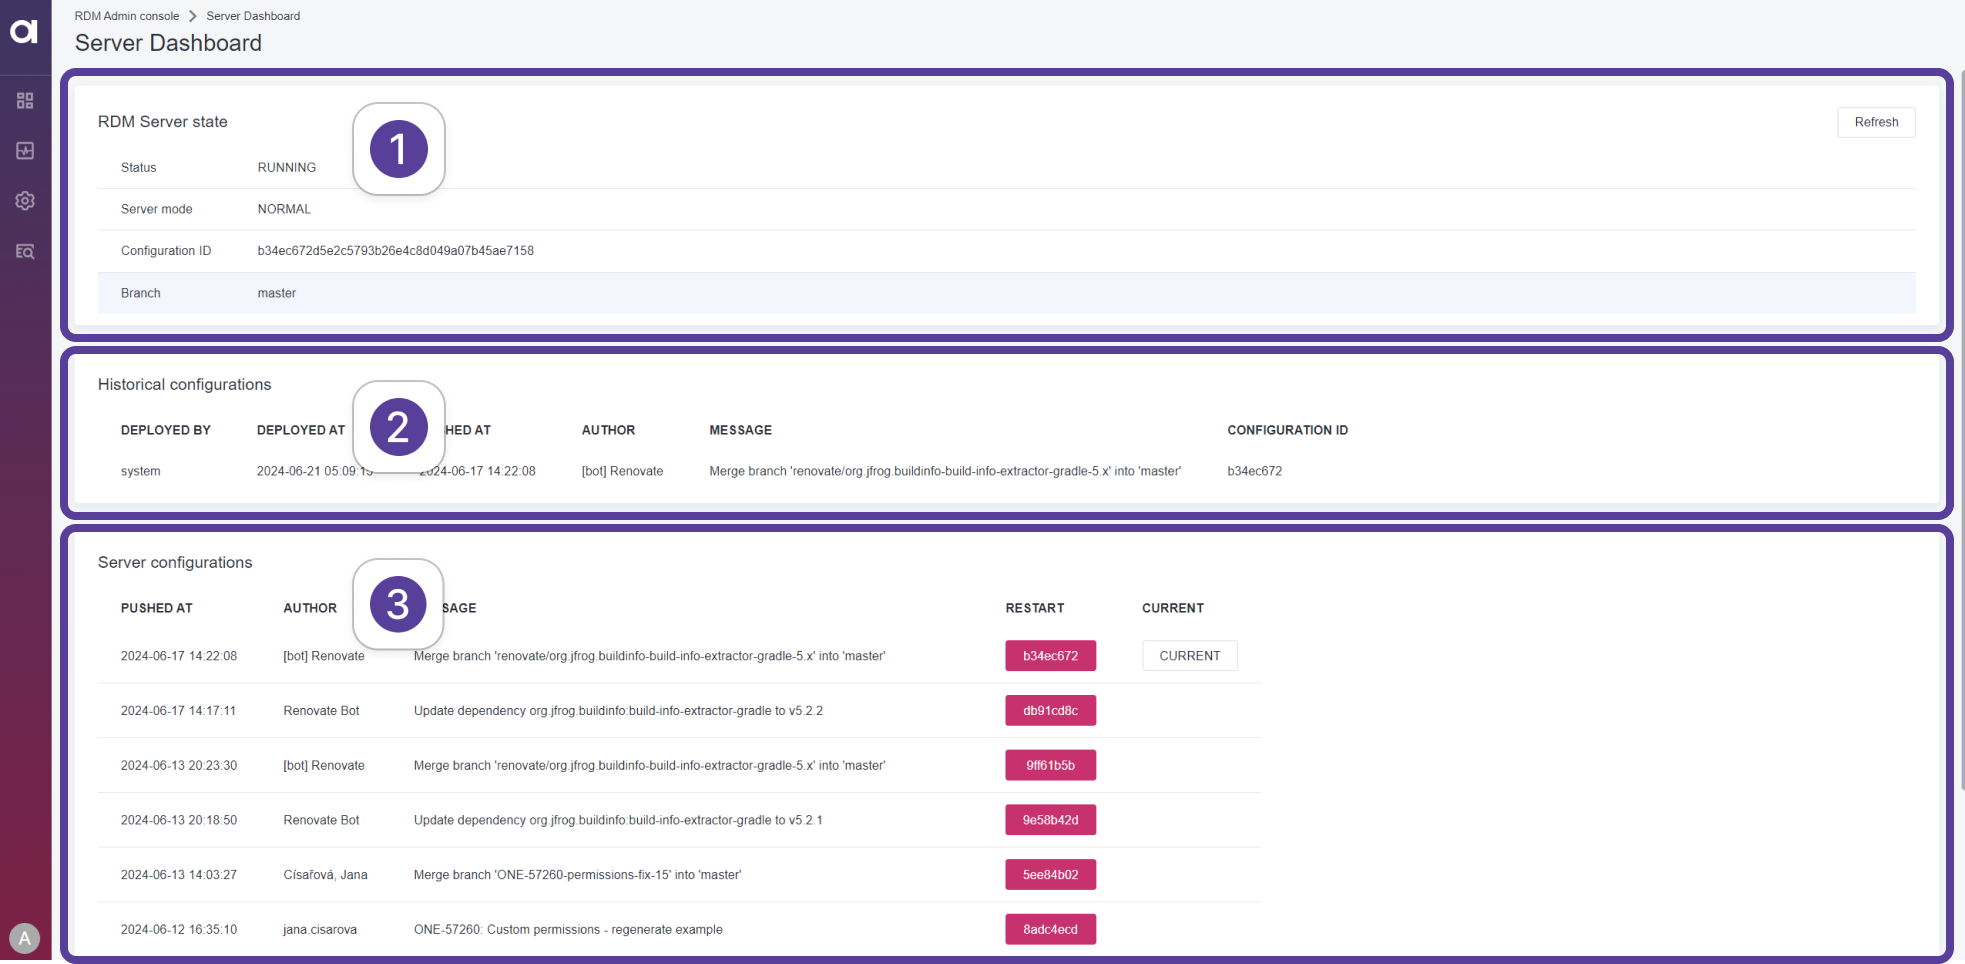
The Server Dashboard consists of the following sections:
-
(1) RDM Server state: Shows the current state of the RDM server. This includes the following:
-
Status
-
Server mode
-
Configuration ID
-
Branch
-
-
(2) Historical configurations: Shows information about previous configurations.
-
(3) Server configurations: Shows a list of configurations available on the connected Git server. You can switch to a configuration by selecting its ID in the RESTART column.
Was this page useful?

