
Understand Profiling Results
After profiling a catalog item, you can view results at both catalog item and attribute levels. The catalog item statistics provide a summary of attribute data, with detailed statistics available for each attribute.
Where can I find profiling results?
Catalog item statistics
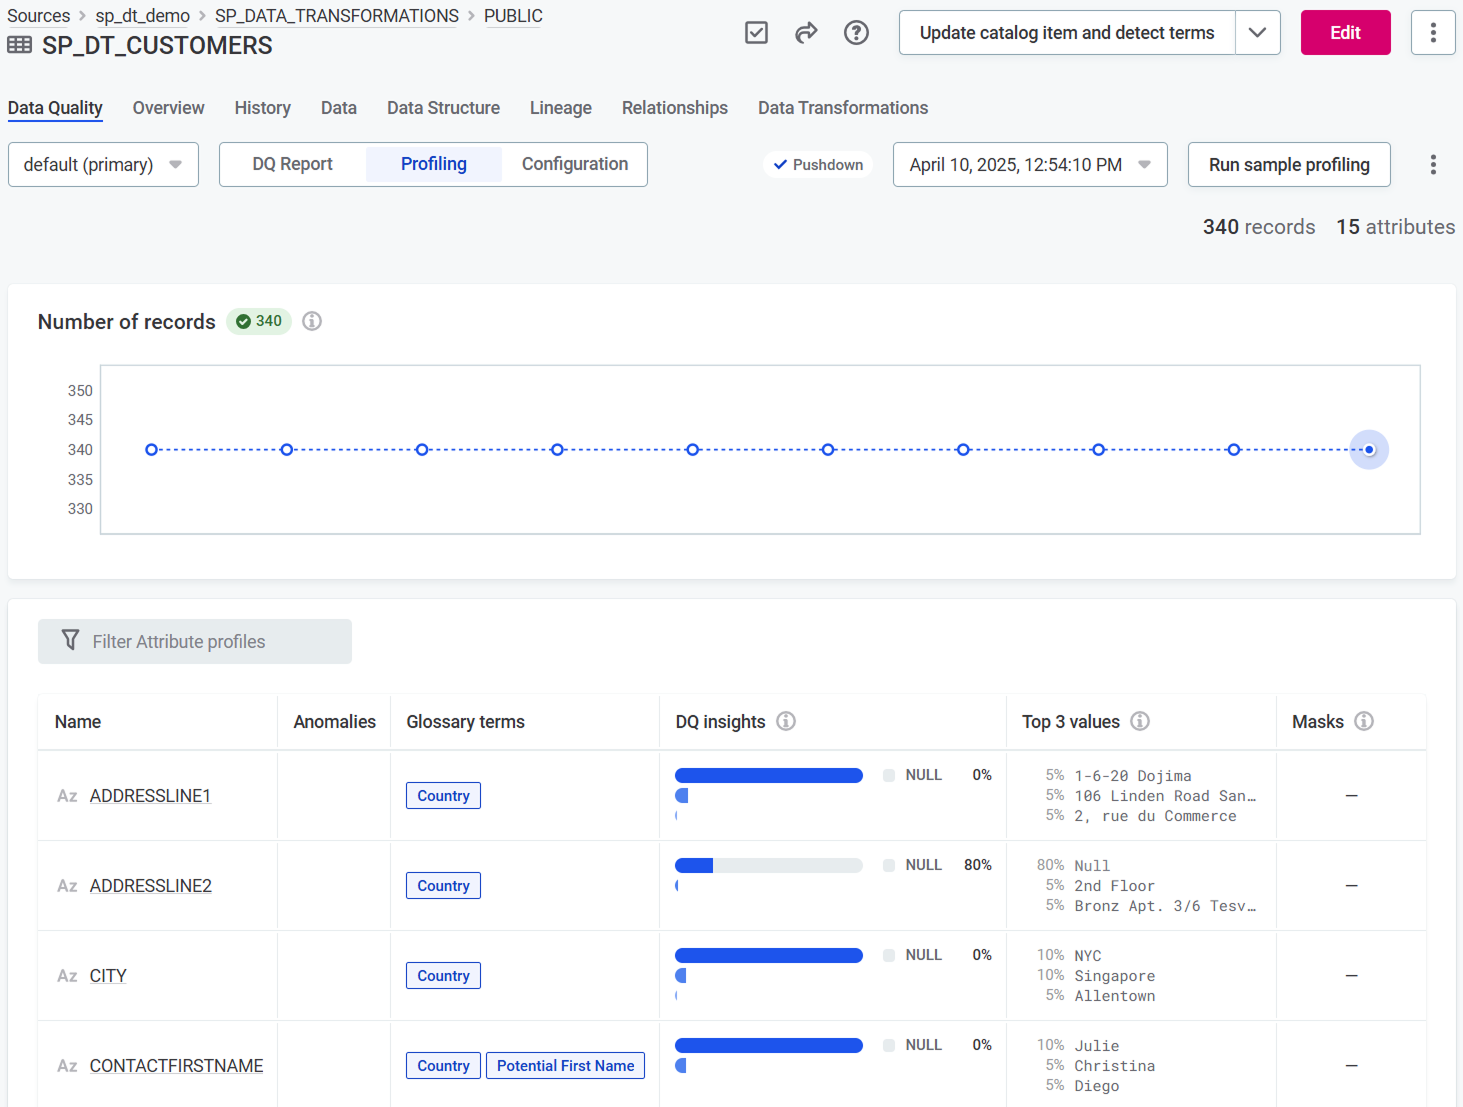
To view aggregated profiling results for a catalog item, open the catalog item Data Quality > Profiling tab. Here you see how the records and their number changed over time, and find out more about the catalog item attributes:
-
Number of profiled records and trend over time.
-
List of catalog item attributes with key profiling statistics:
-
General information, such as attribute data type (shown as icon) and Name.
-
Potential Anomalies, that is, unexpected values that might point to issues in your data. See also Next steps.
-
Applied terms. See also Next steps.
-
The count and percentage of values that are null, not null, unique, and distinct (see DQ insights).
-
Top 3 values showing three most frequent values and how often they occur in data.
-
Masks showing syntactic format of data for non-numeric attributes. See Mask, pattern, length statistics.
-
Profiling statistics explained
Frequency, frequency groups, quantile statistics
These statistics help you understand value distribution and uniqueness across your data. They are calculated for all attributes, regardless of their data type.
Use frequency groups and frequency analysis together to gain more insight into the data and determine what percentage of data contains duplicated values.
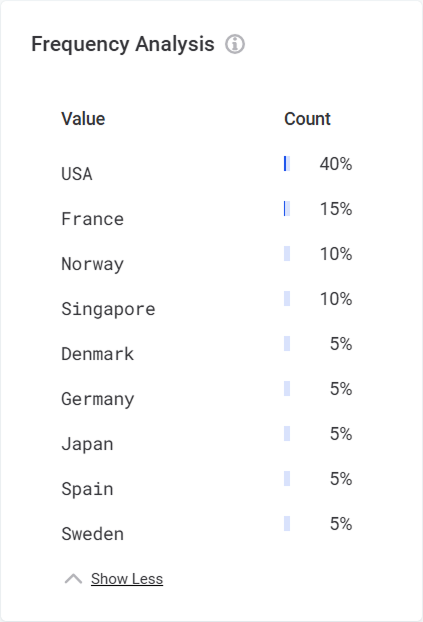
- Frequency Analysis
-
Shows how many times each value occurs in the data.
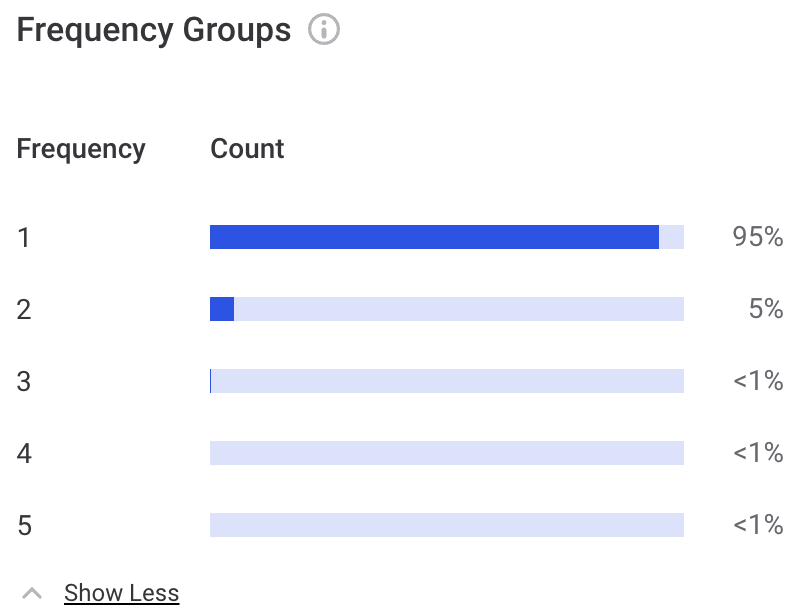
- Frequency Groups
-
Shows how many unique and duplicated values there are in the data. Null values are excluded from this analysis.
Each group represents values that occur the same number of times. For example, a group with size 2 represents all values that appear exactly twice in your data. If the data contains only unique values, the group size is 1.
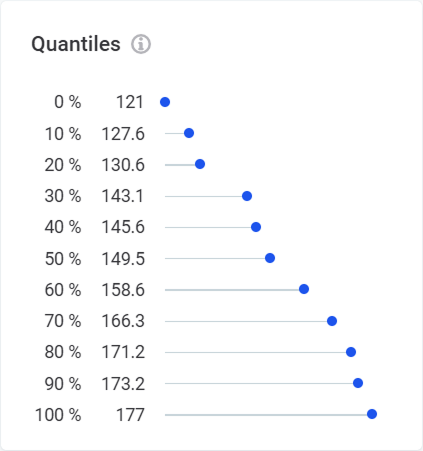
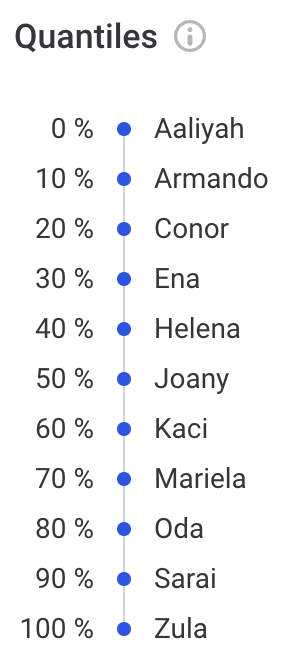
- Quantiles
-
Shows values at specific intervals in the ordered data set. The first value is shown at 0%, the last value at 100%, and median value at the 50% marker.
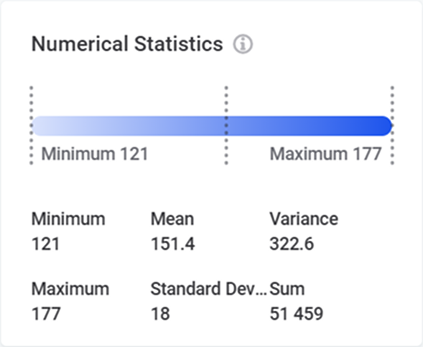
Numeric attributes show value distribution:
Non-numeric attributes show character distribution:
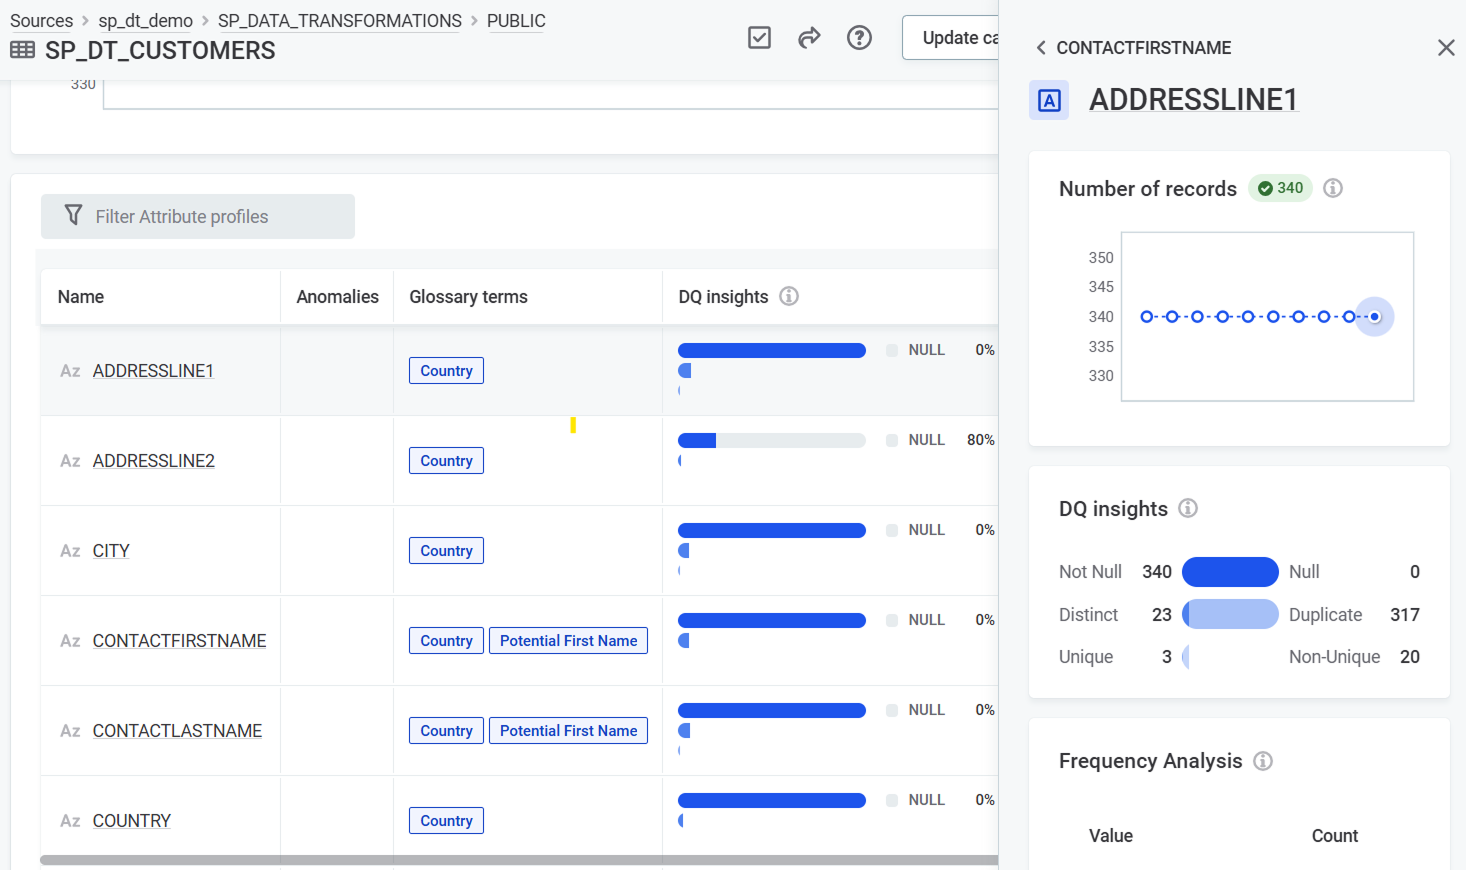
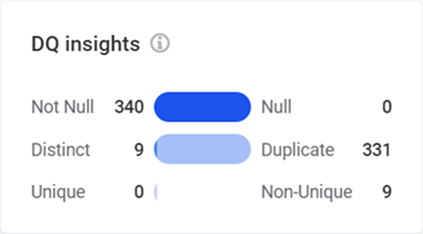
DQ insights
DQ insights display the following information:
-
Not Null: Count of non-null values.
-
Null: Count of
NULLvalues. -
Distinct: Count of different values (includes both unique and non-unique values).
-
Duplicate: Count of values occurring multiple times.
-
Unique: Count of values occurring exactly once.
-
Non-Unique: Count of values with at least one duplicate.
Mask, pattern, length statistics
These analyses help you identify format inconsistencies. They apply only to non-numeric attributes.
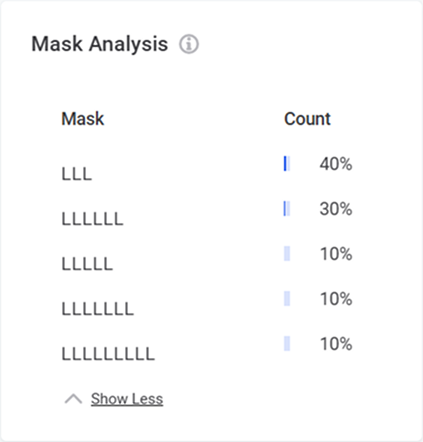
- Mask Analysis
-
Shows structure of values in the data, where "L" represents a letter and "D" represents a digit.
Helps identify unexpected patterns, such as single character records or records with digits in name fields.
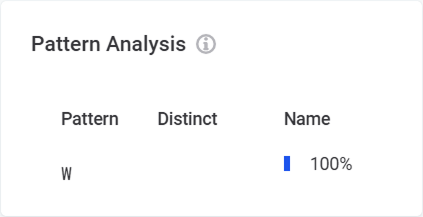
- Pattern Analysis
-
Shows higher-level structure of values in the data, where “W” represents a word, "N" a number, and “L” represents a letter.
It also shows how many records share the same pattern and how many of them are distinct.
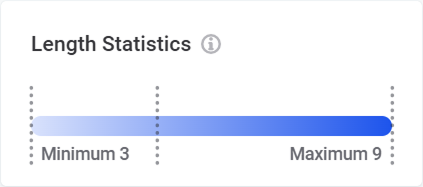
- Length Statistics
-
Shows minimum, maximum and mean character length of values.
Next steps
After viewing the profiling results, you can take first steps to evaluate and improve your data quality.
For each attribute, you can:
-
Apply additional terms: Navigate to the Data Quality > Configuration tab, open the attribute detail in a sidebar, and select Add Term.
-
Review anomalies: View anomalies in the profiling results. See Anomaly Detection for details.
-
Add DQ rules: To add rules, go to the Data Quality > Configuration tab, Applied Rules section:
-
Apply existing rules: Select Add and choose from available rules.
-
Check for rule suggestions: Select Check for Rule suggestions to see rules recommended based on profiling results, and accept or reject the suggestions.
-
Create new rules: Select Add and then Create Rule. See DQ Rules.
-
Was this page useful?