
DQ Reports
DQ Reports provide comprehensive quality assessment visualizations for selected data assets. These reports leverage pre-configured dashboards in ONE Reports to display critical quality metrics and insights.
Use DQ Reports to group and monitor catalog items most relevant to your business needs. Typically, these are the catalog items presented in BI reports, compliance reports, or those used for decision-making.
Key Features
-
Pre-configured dashboards with essential quality visualizations.
-
Customizable report generation based on selected catalog item DQ configurations.
-
Visual representation of quality trends and problem areas.
-
Detailed views of passed and failed records.
Create DQ Report
To create a report, select the catalog items that you want to include in the report:
-
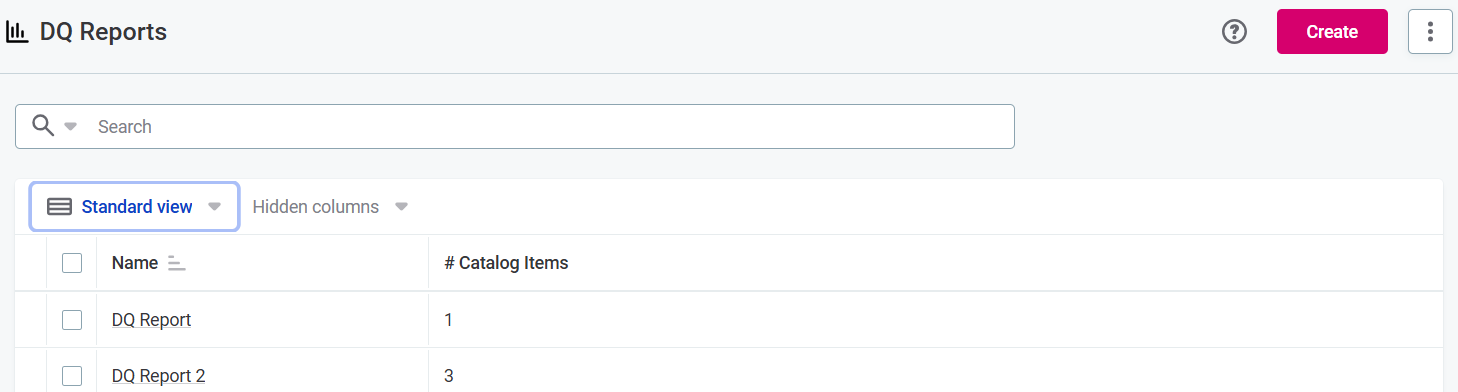
From the left navigation menu, select Data Quality > DQ Reports.
-
A DQ Reports screen opens, listing all available DQ reports. On the screen, select Create.
-
A Create a new DQ report dialog opens. In the dialog:
-
Select the catalog items (1) and specific DQ configurations (2) you want to include in your report.
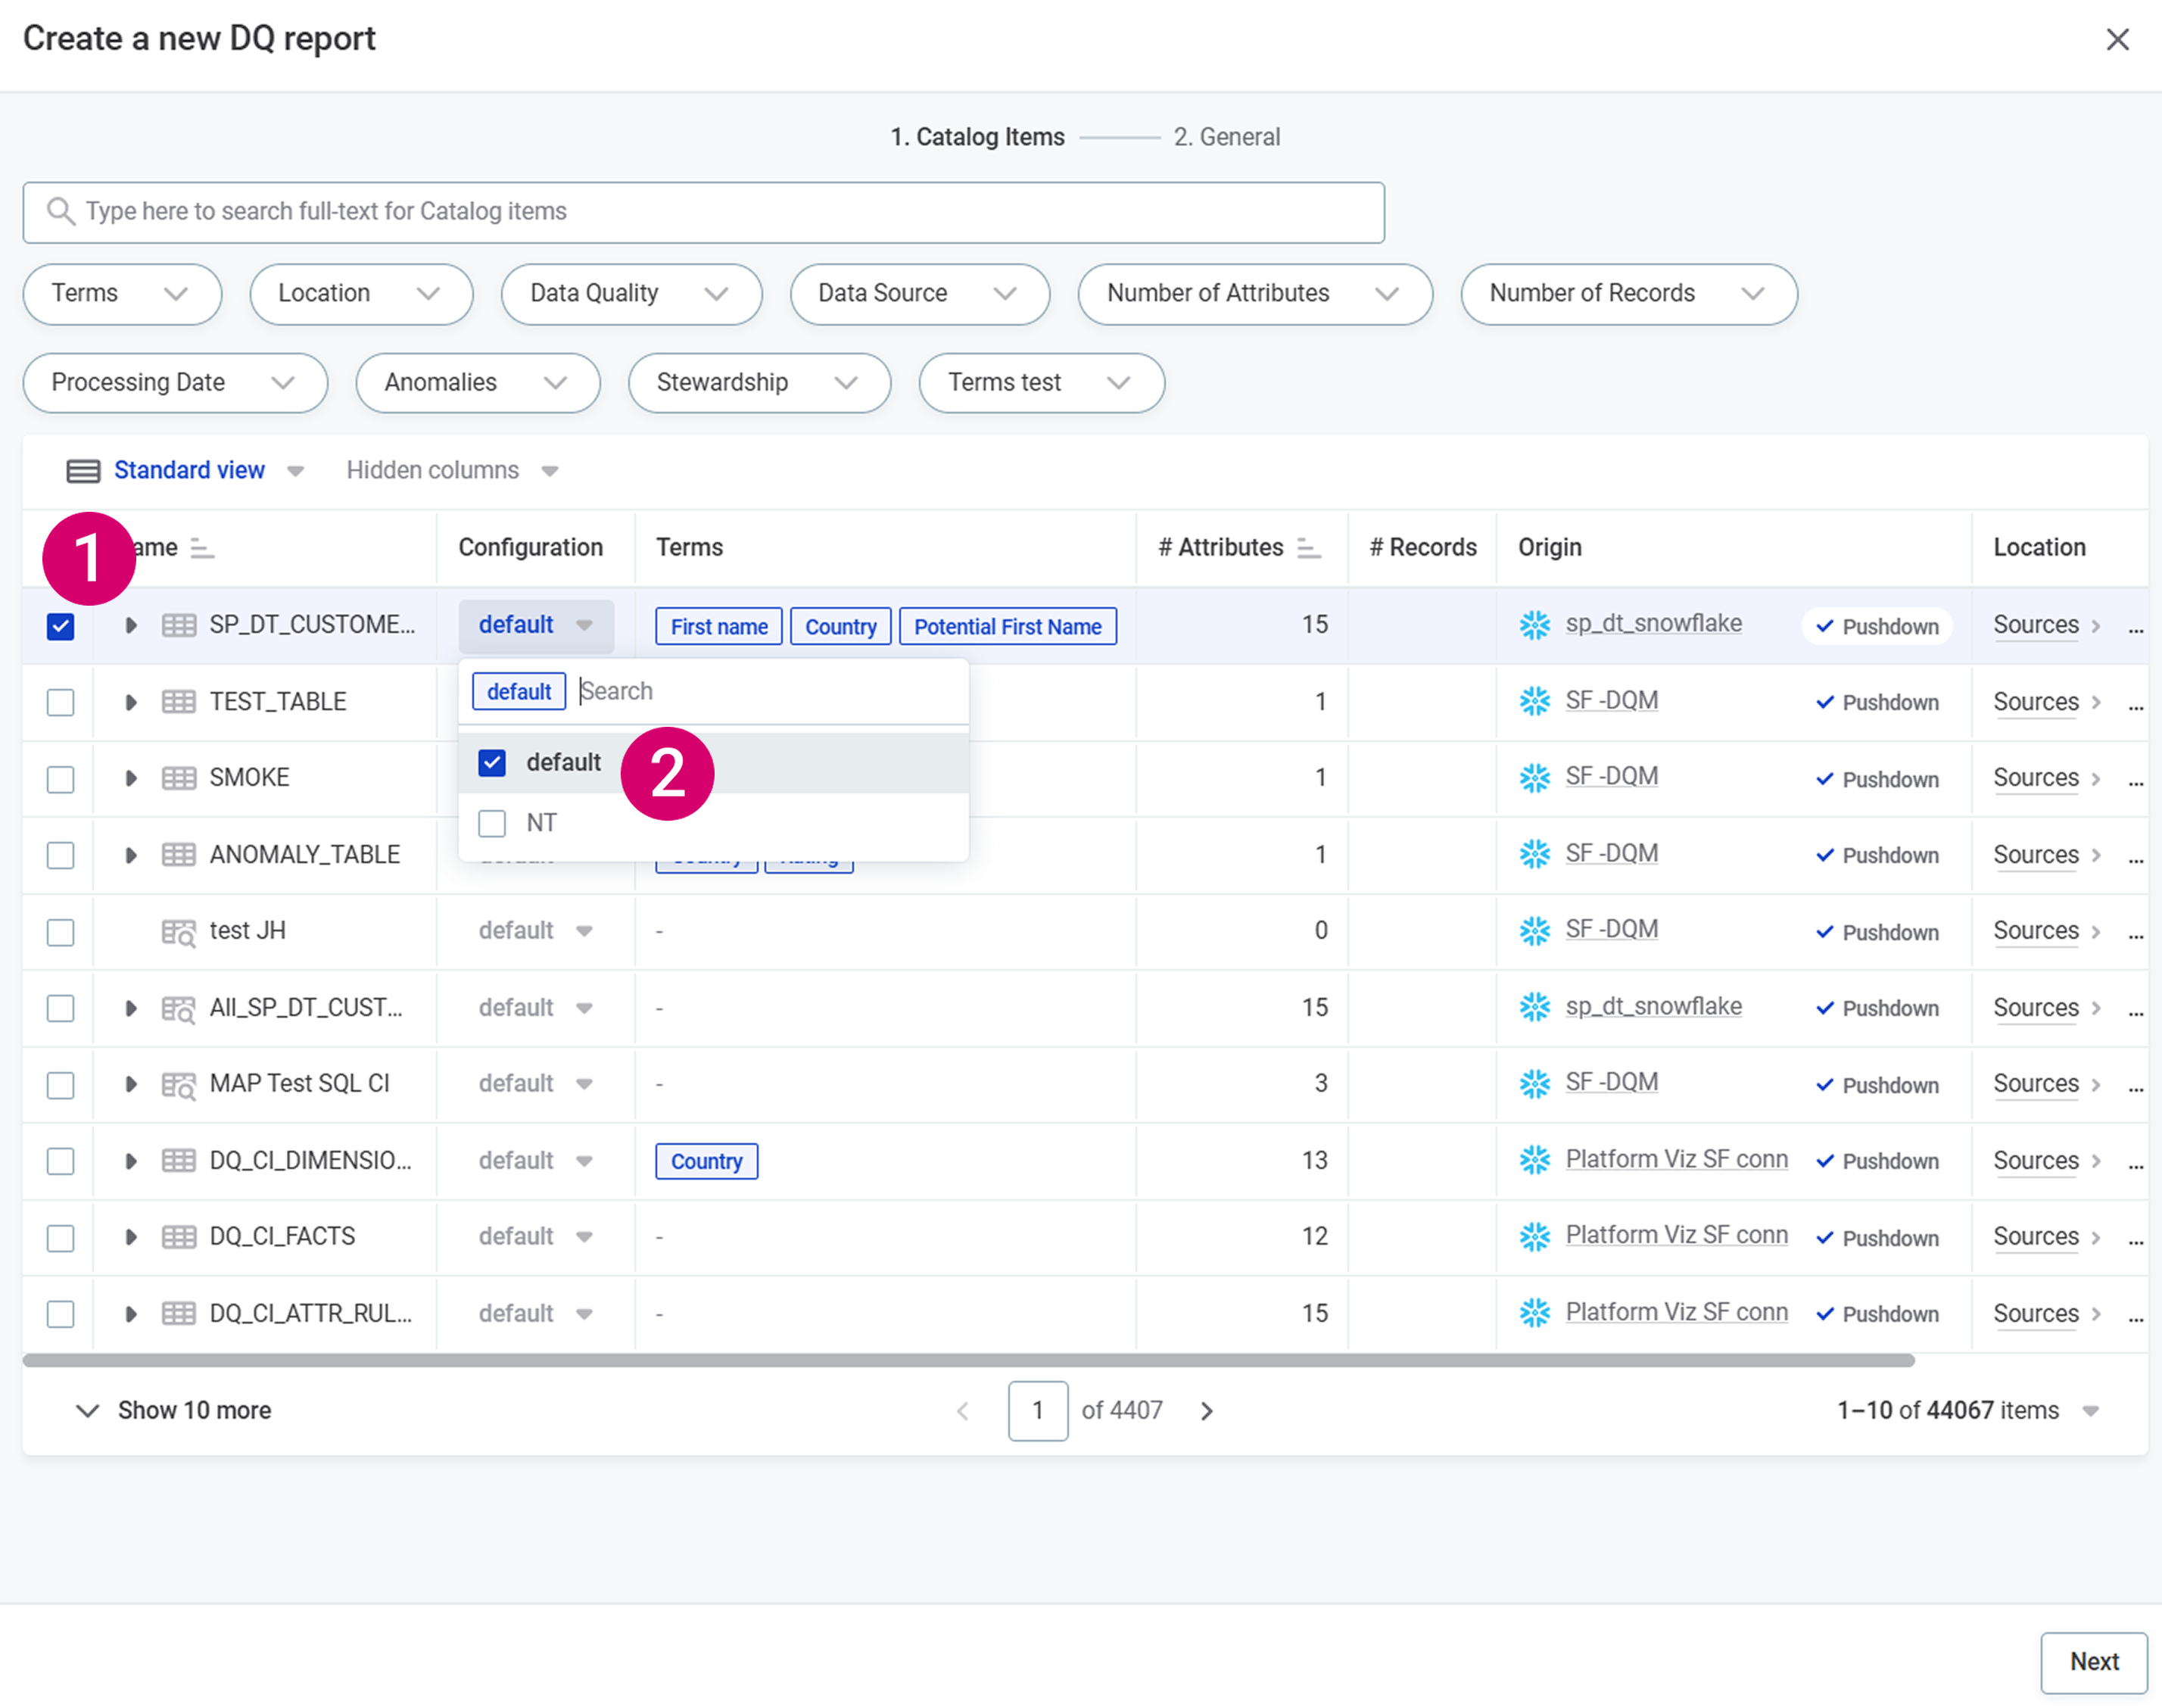
You can filter the catalog items by name, the data source they come from, and more. 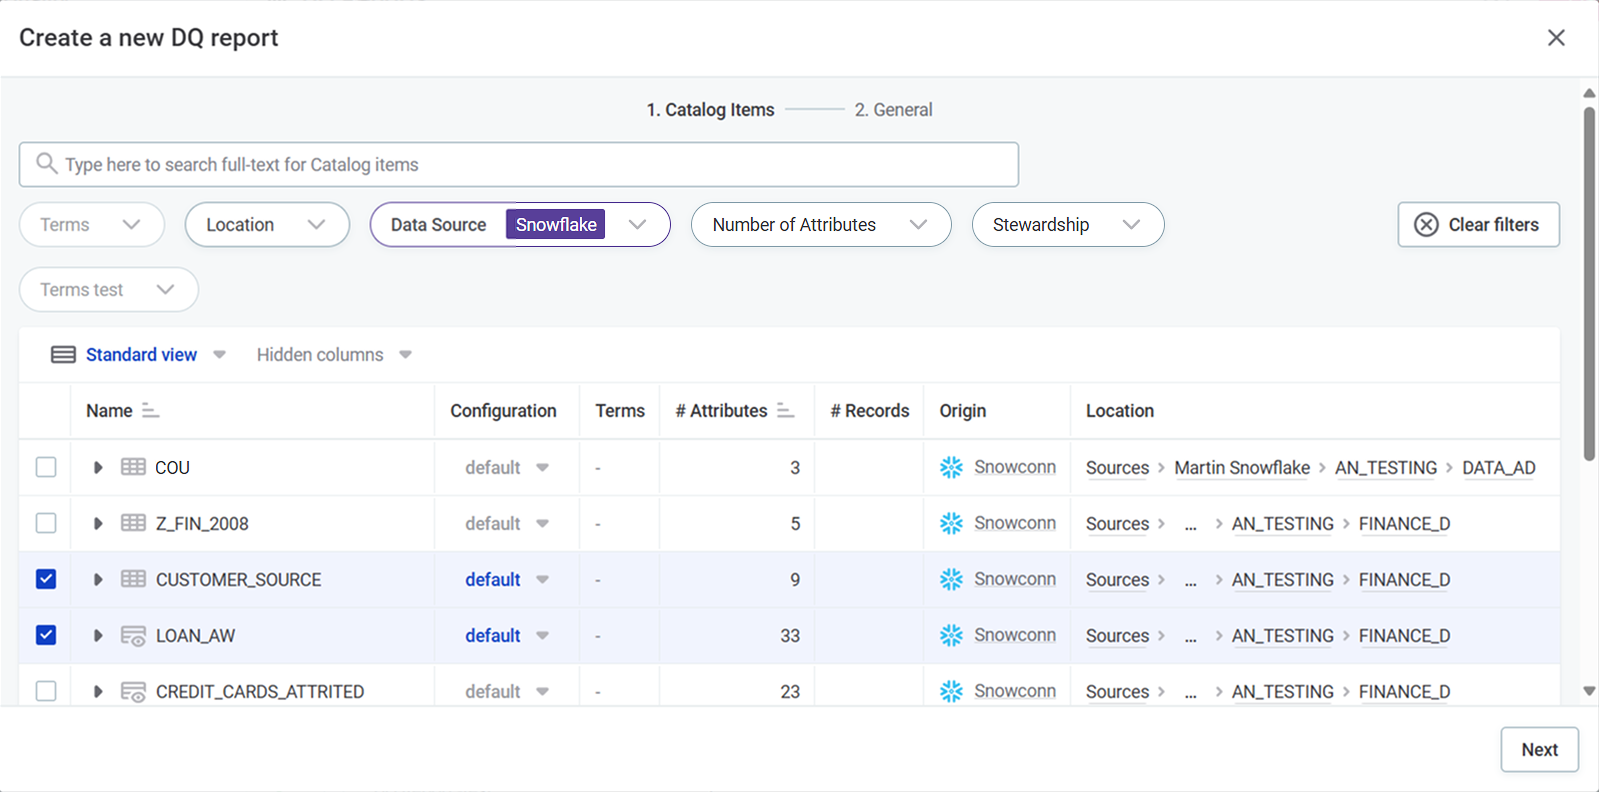
-
Select Next to create the report based on the ONE Reports dashboard configuration.
-
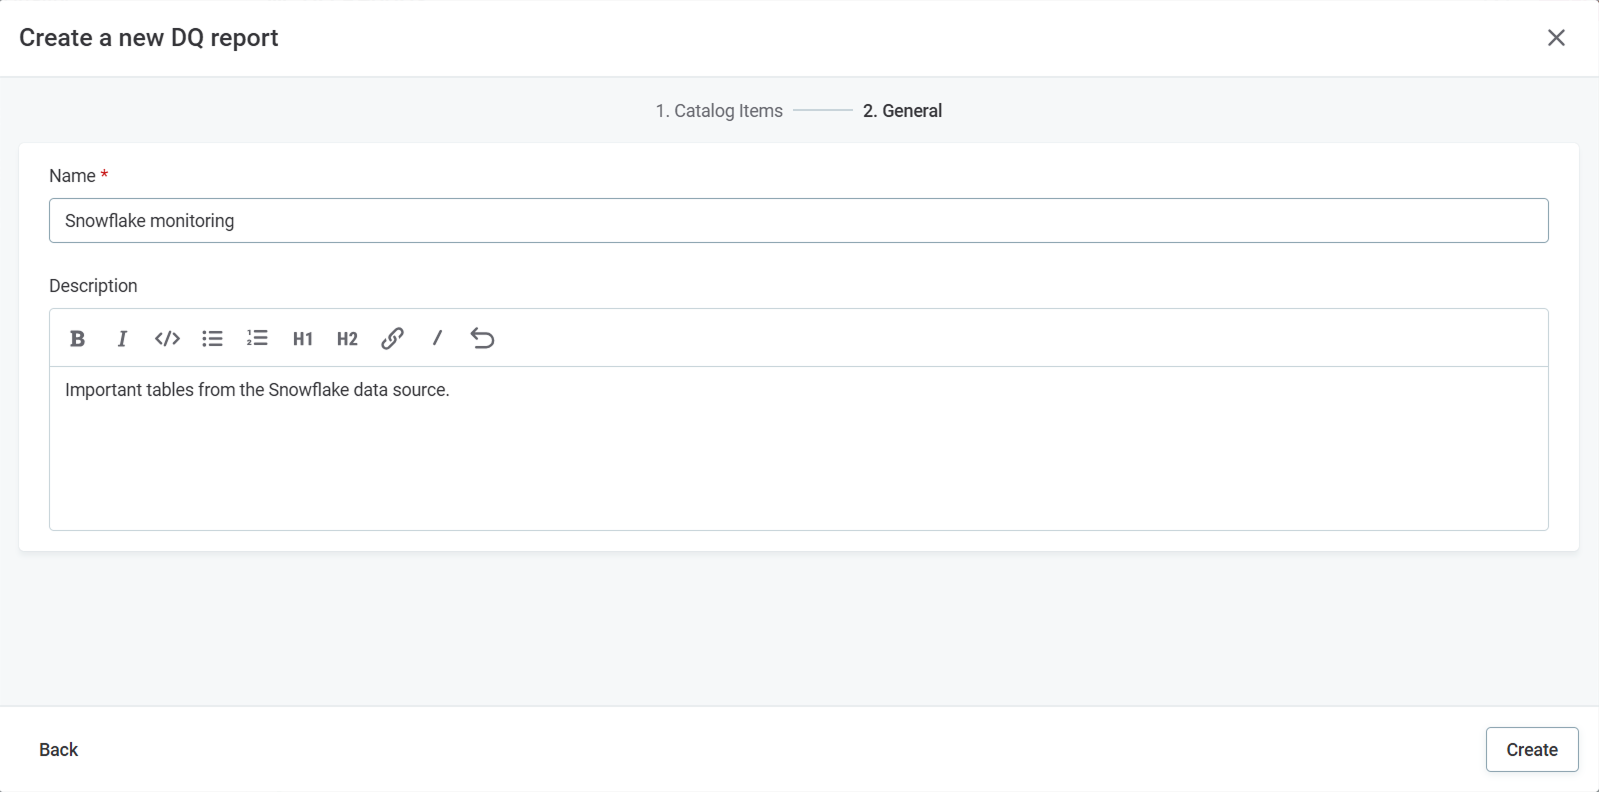
Fill in the report Name and Description, then select Create.
-
-
The report is created and you can find it any time under Data Quality > DQ Reports.
-
Publish the report.
Add and remove catalog items
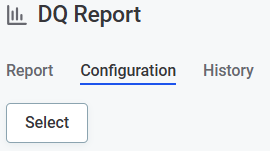
Add and remove catalog item DQ configurations via the Configuration tab:
-
To add additional catalog items:
-
Use Select.
-
Select the catalog items (1) and specific DQ configurations (2) you want to include in your report.
-
-
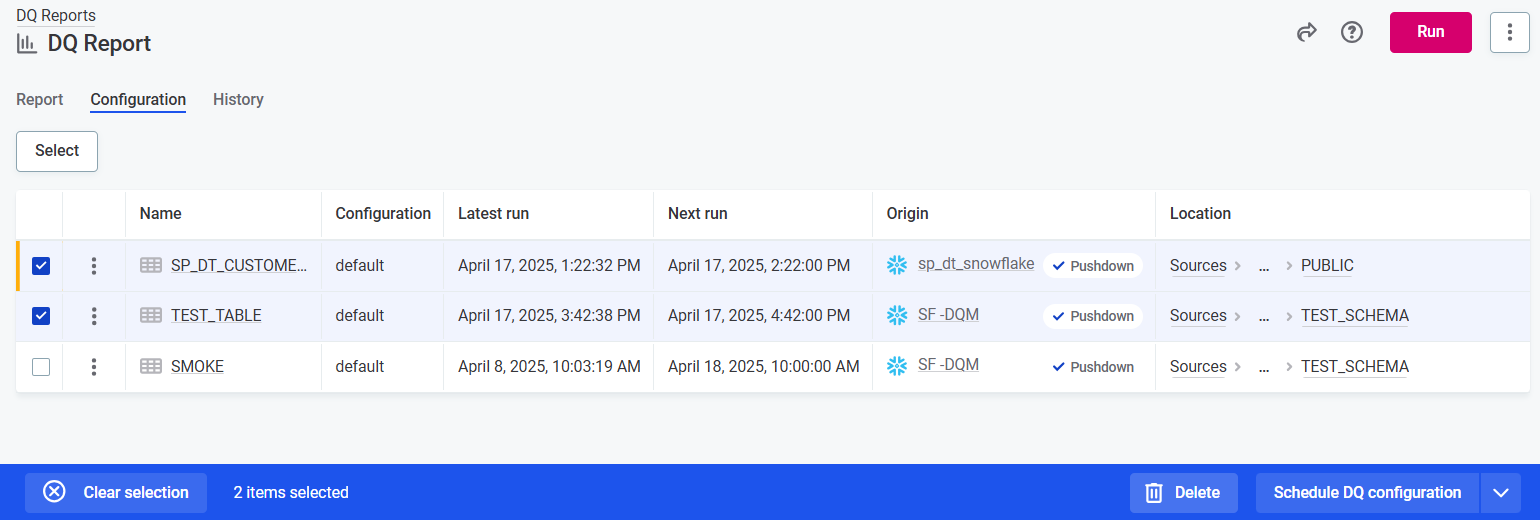
To remove catalog item DQ configurations, use the checkboxes and select Delete.
When you’re done, publish your changes.
View DQ evaluation results
DQ Reports show the latest results of DQ evaluation.
When does the DQ evaluation for DQ Report run?
For each catalog item in the DQ Report, DQ evaluation runs automatically at times specified in its DQ configuration schedule (if set up).
Additionally, you can run ad hoc DQ evaluation:
-
For all catalog items included in the DQ Report by selecting Run from the report.
-
For specific catalog items by selecting Run DQ Evaluation from the report Configuration tab, or from the catalog item Data Quality > DQ Report tab.
| DQ evaluation can be started from multiple locations. Regardless of the starting point, the results are synchronized and automatically updated in DQ Report, as well as in the data quality report found on the catalog item Data Quality > DQ Report tab, ensuring a single source of truth. |
Troubleshooting
Common issues
-
No data displayed: Verify that the selected catalog items have DQ evaluations completed.
-
Incomplete reports: Check if all selected catalog items are accessible to your user account.
-
Unexpected rule configuration: Make sure you selected the correct DQ configuration when adding catalog items - use the dropdown to select a different configuration than the default. Once you have verified the correct catalog item and configuration are selected, make sure the selected DQ configuration is set up as you want it. See Set up DQ Configuration for more information.
DQ Report template
DQ Reports are tightly integrated with ONE Reports:
-
Reports in ONE use a pre-configured dashboard in ONE Reports which is labeled as 'DQ Report Template'.
-
All visualizations are rendered based on the dashboard configuration in ONE Reports.
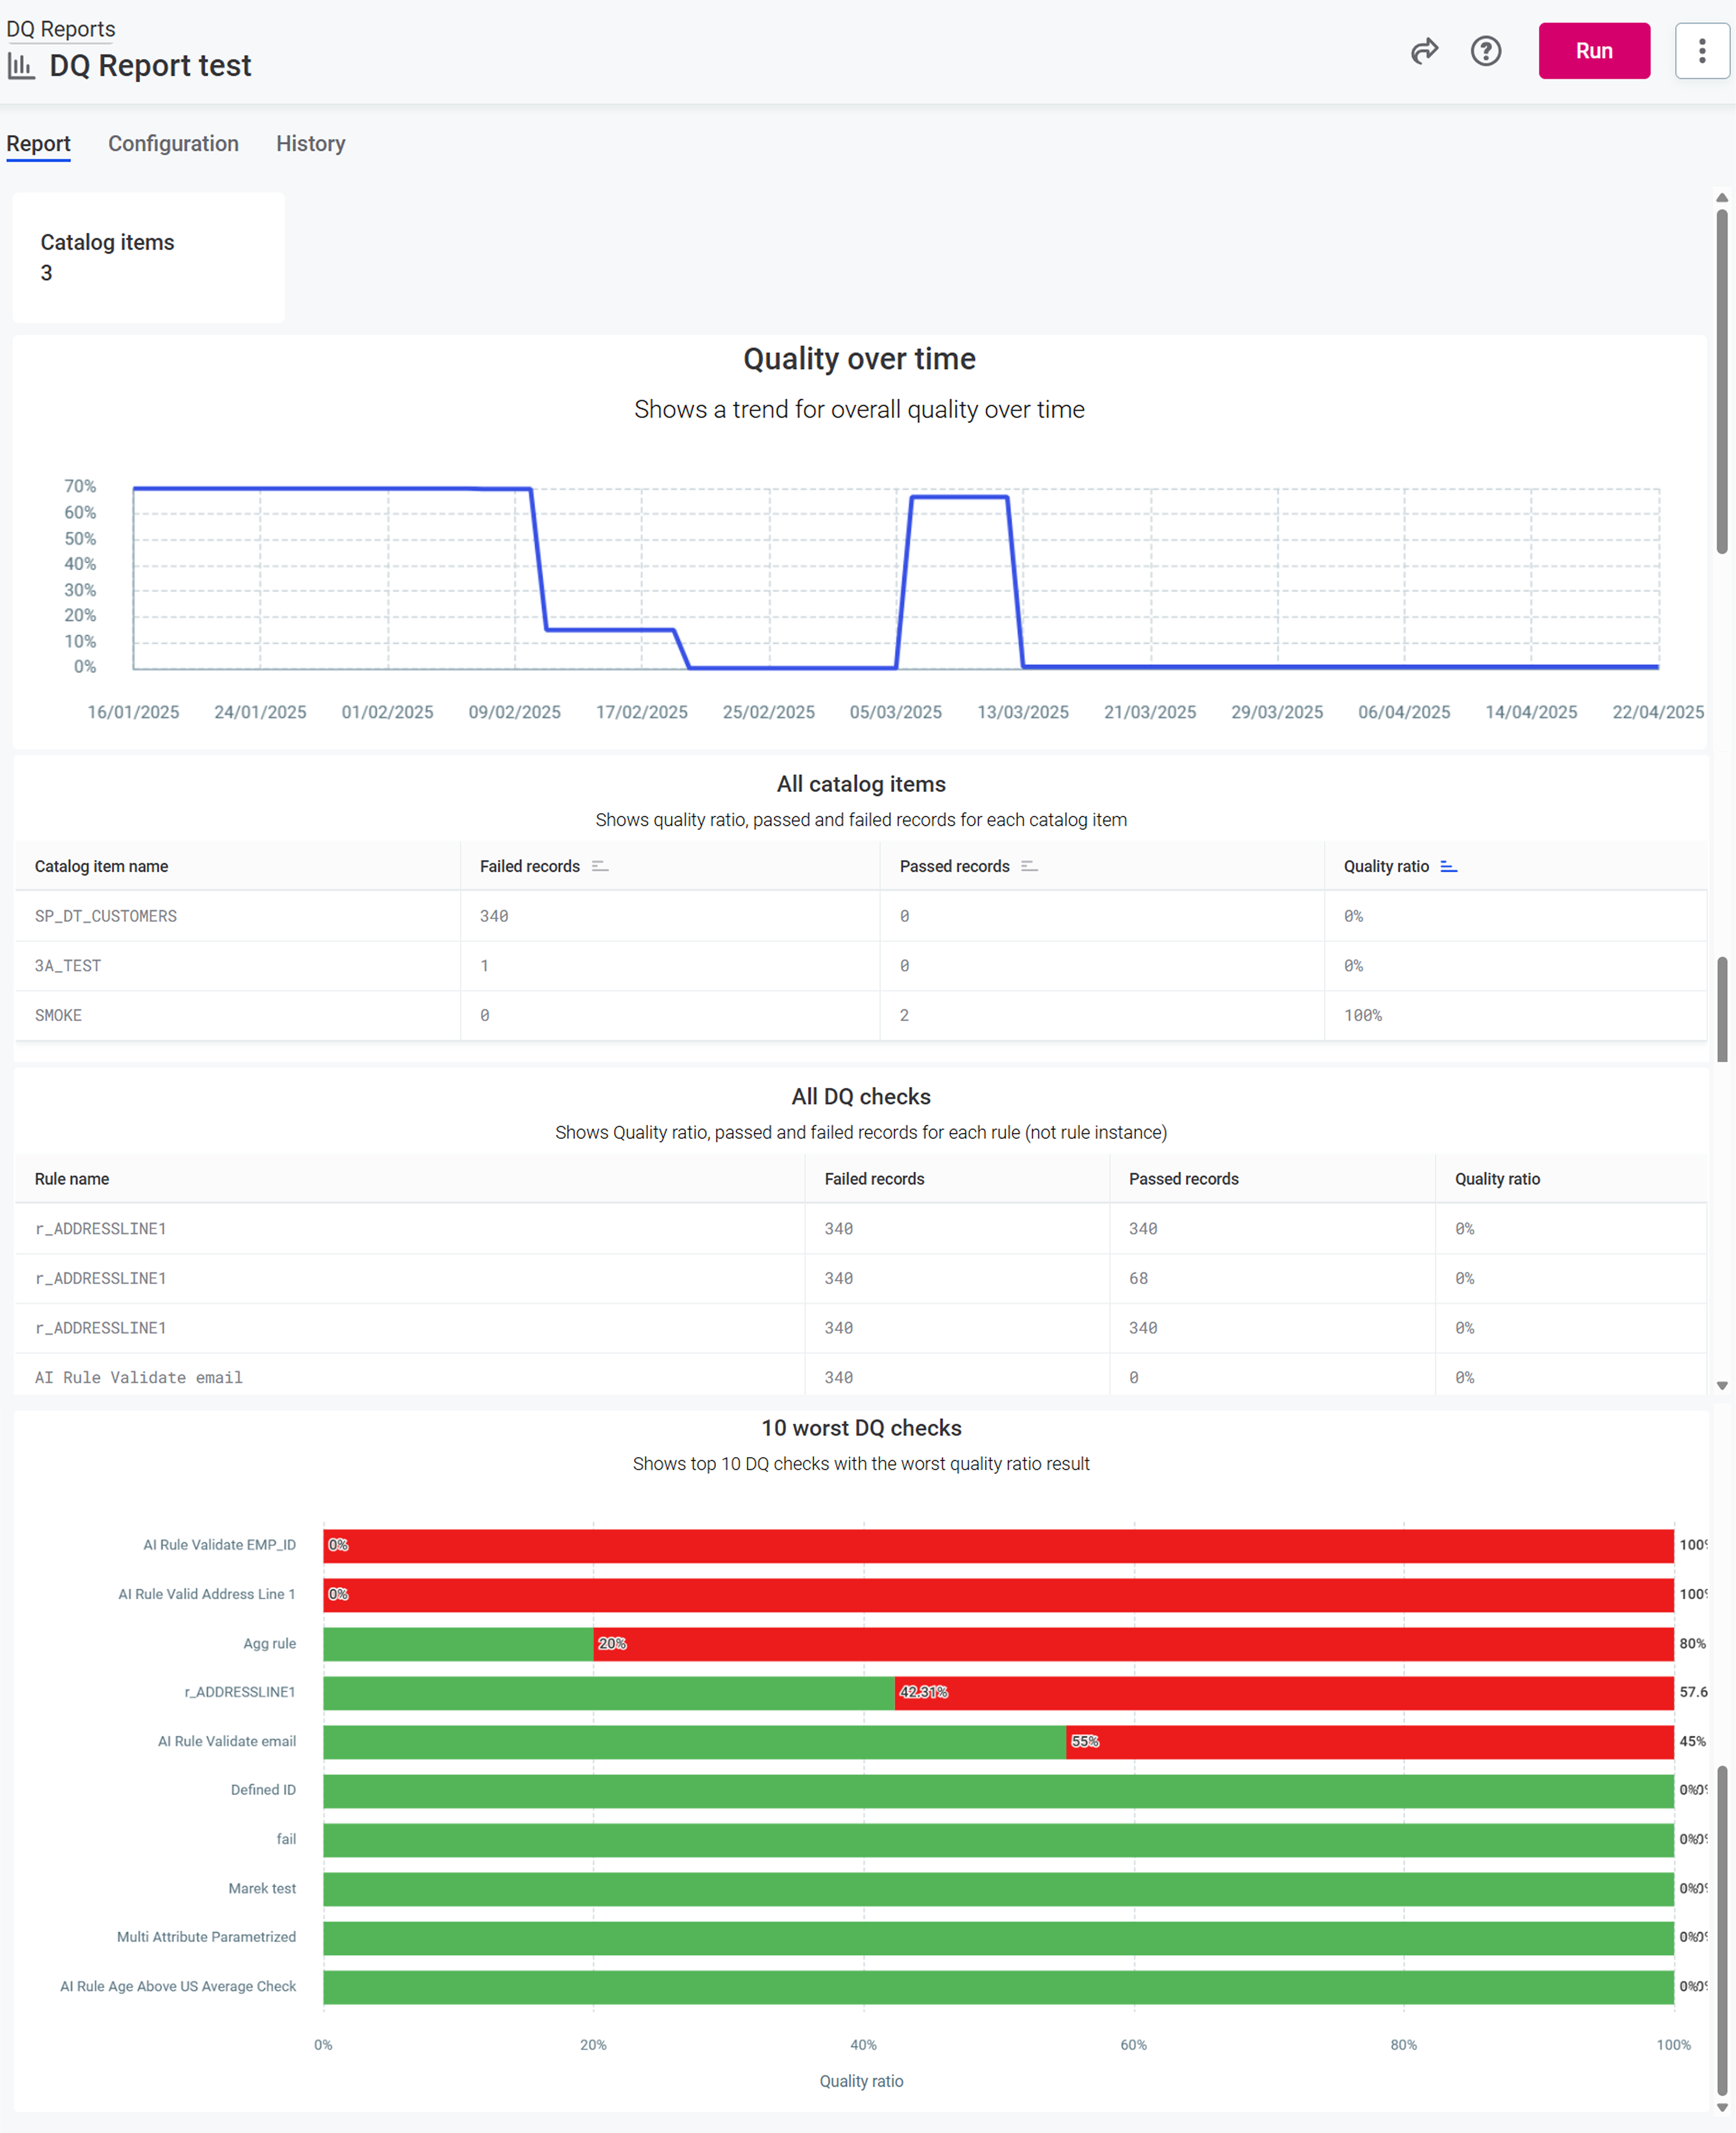
By default, DQ Reports consist of several key components derived from ONE Reports dashboards:
- Quality over time
-
A line graph visualization showing how data quality metrics have changed over time. This helps identify trends and potential areas for improvement in your data quality processes.
- Passed and failed records
-
Detailed tables displaying passed and failed records for each catalog item and for each rule. These tables provide granular insights into which specific records are meeting or failing quality checks. The catalog item view helps identify which data assets have quality issues. The rule view helps pinpoint which specific quality rules are causing the most failures.
- Lowest performing rules
-
A bar graph visualization highlighting the 10 rules with the lowest pass rates. This helps quickly identify the most problematic quality rules that may need attention.
Change DQ Report template
Admin users can create an alternative template, either from scratch or by duplicating and editing the existing template.
To change the template:
-
Open ONE Reports. Edit the current template or create a new one.
-
To edit the current template:
-
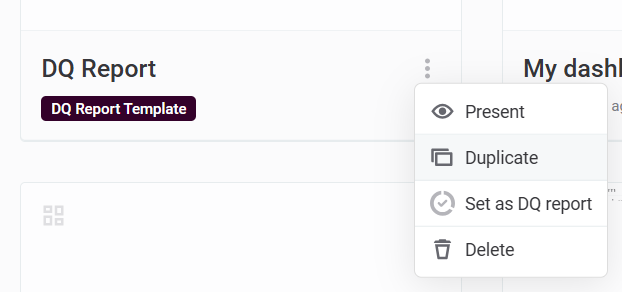
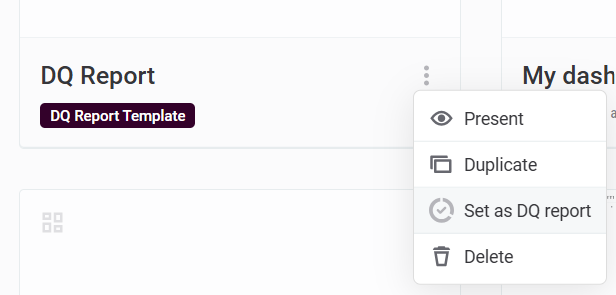
Locate the dashboard labeled DQ Report Template.
-
Use the three dots menu and select Duplicate.
-
Edit the dashboard as needed. For more information, see Dashboards.
-
-
To create a new template:
-
Select Create and set up your dashboard as needed. For more information, see Dashboards.
-
-
-
Use the three dots menu for the dashboard and then Set as DQ Report.
-
The new template is applied to all DQ Reports in ONE.
| Only one dashboard can be set as the DQ Report Template at any given time. |
Was this page useful?