
Anomaly Detection
Anomaly detection identifies unusual patterns in your data. Potential anomalies are detected during the profiling of catalog items on two levels:
-
Catalog item level: Anomalies in the number of records.
-
Attribute level: Anomalies in metrics such as value distribution, standard deviation, and numeric sums.
The value of a metric is considered an anomaly if it falls outside the expected range based on historical patterns. Anomaly detection covers two data observability concerns that are commonly referenced together:
- Data drift
-
Significant changes in the statistical distribution of data values over time. This is covered by attribute-level anomaly detection, which monitors metrics such as value distribution, standard deviation, and numeric sums.
- Data volume
-
Changes in the number of records in a dataset. A significant drop or spike in record count is covered by catalog item-level anomaly detection.
| Anomaly detection is available only with full profiling. |
Run anomaly detection
To detect anomalies in your catalog item:
-
Enable anomaly detection in the DQ monitor:
-
Open the monitor Settings tab.
-
In Processing settings, enable Detect anomalies.
-
Where can I see detected anomalies
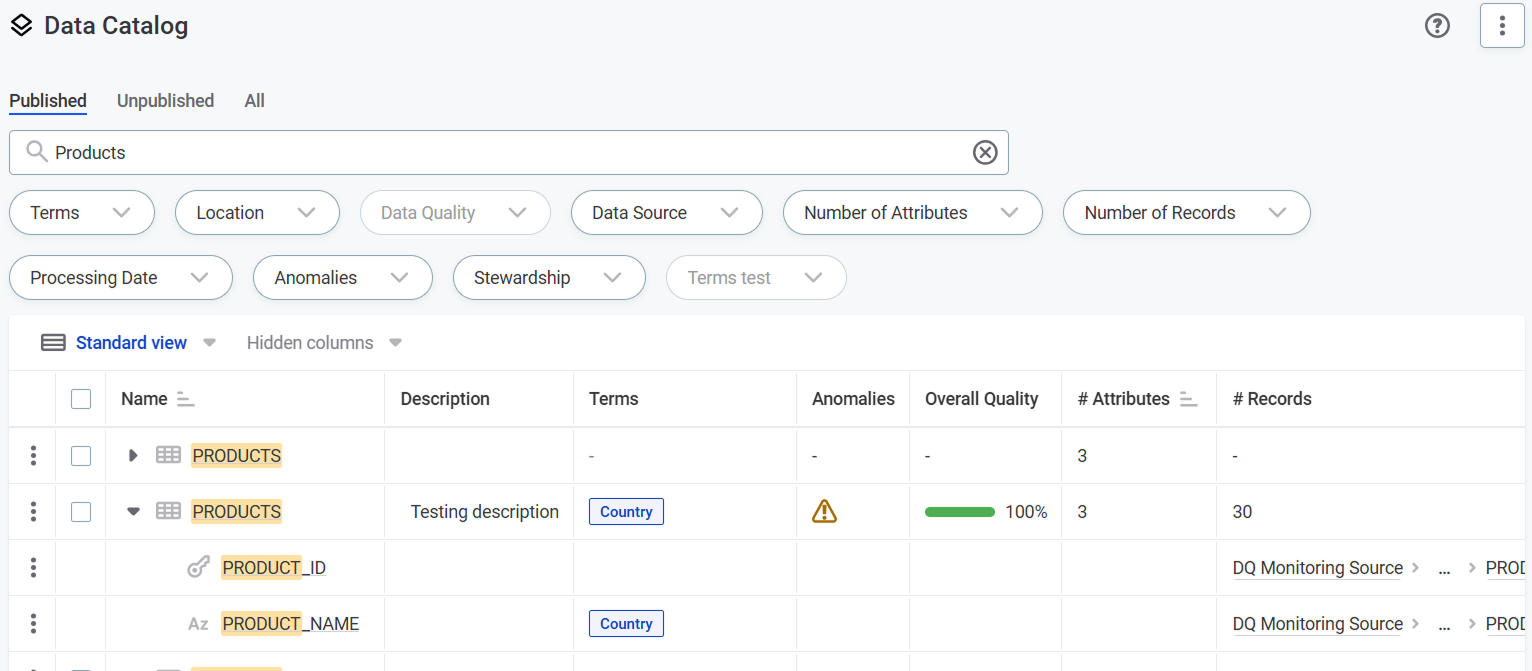
Detected anomalies are marked with a warning icon ![]() throughout the Data Catalog:
throughout the Data Catalog:
-
On the catalog item list view.
-
In the monitor Profiling & rules tab.
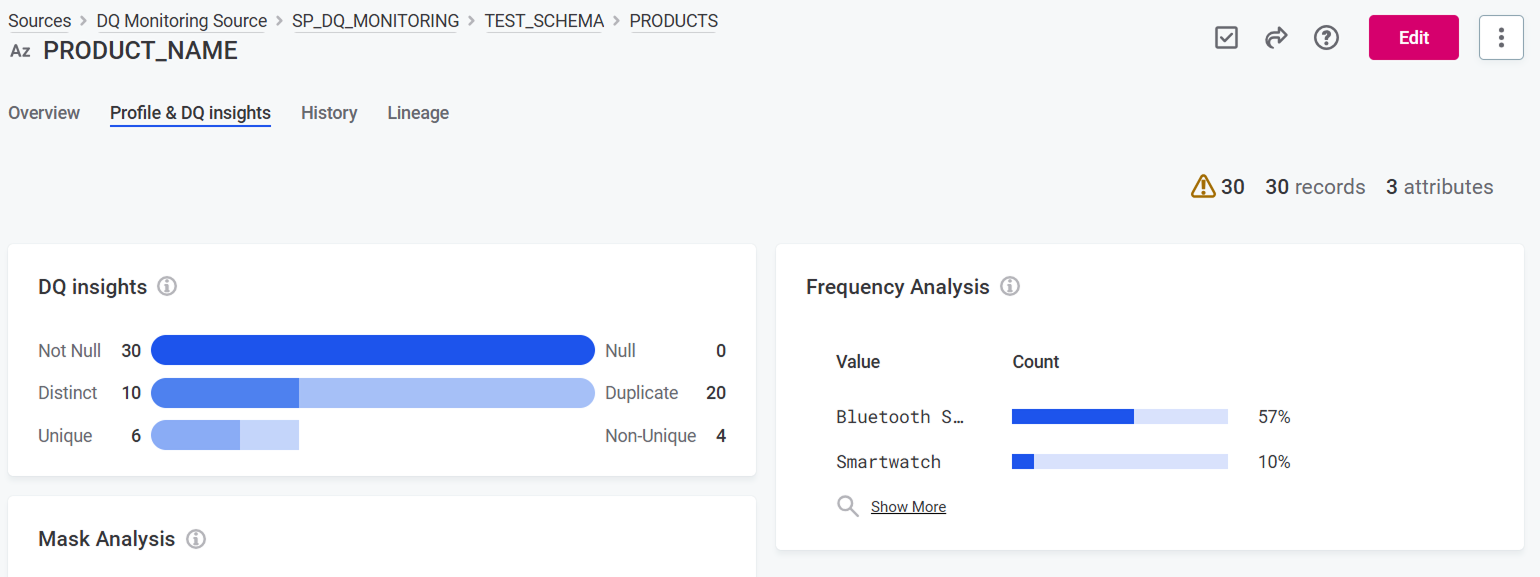
-
On the Profile & DQ insights tab of a catalog item attribute.
View anomalous metrics
To view specific metrics identified as anomalous:
-
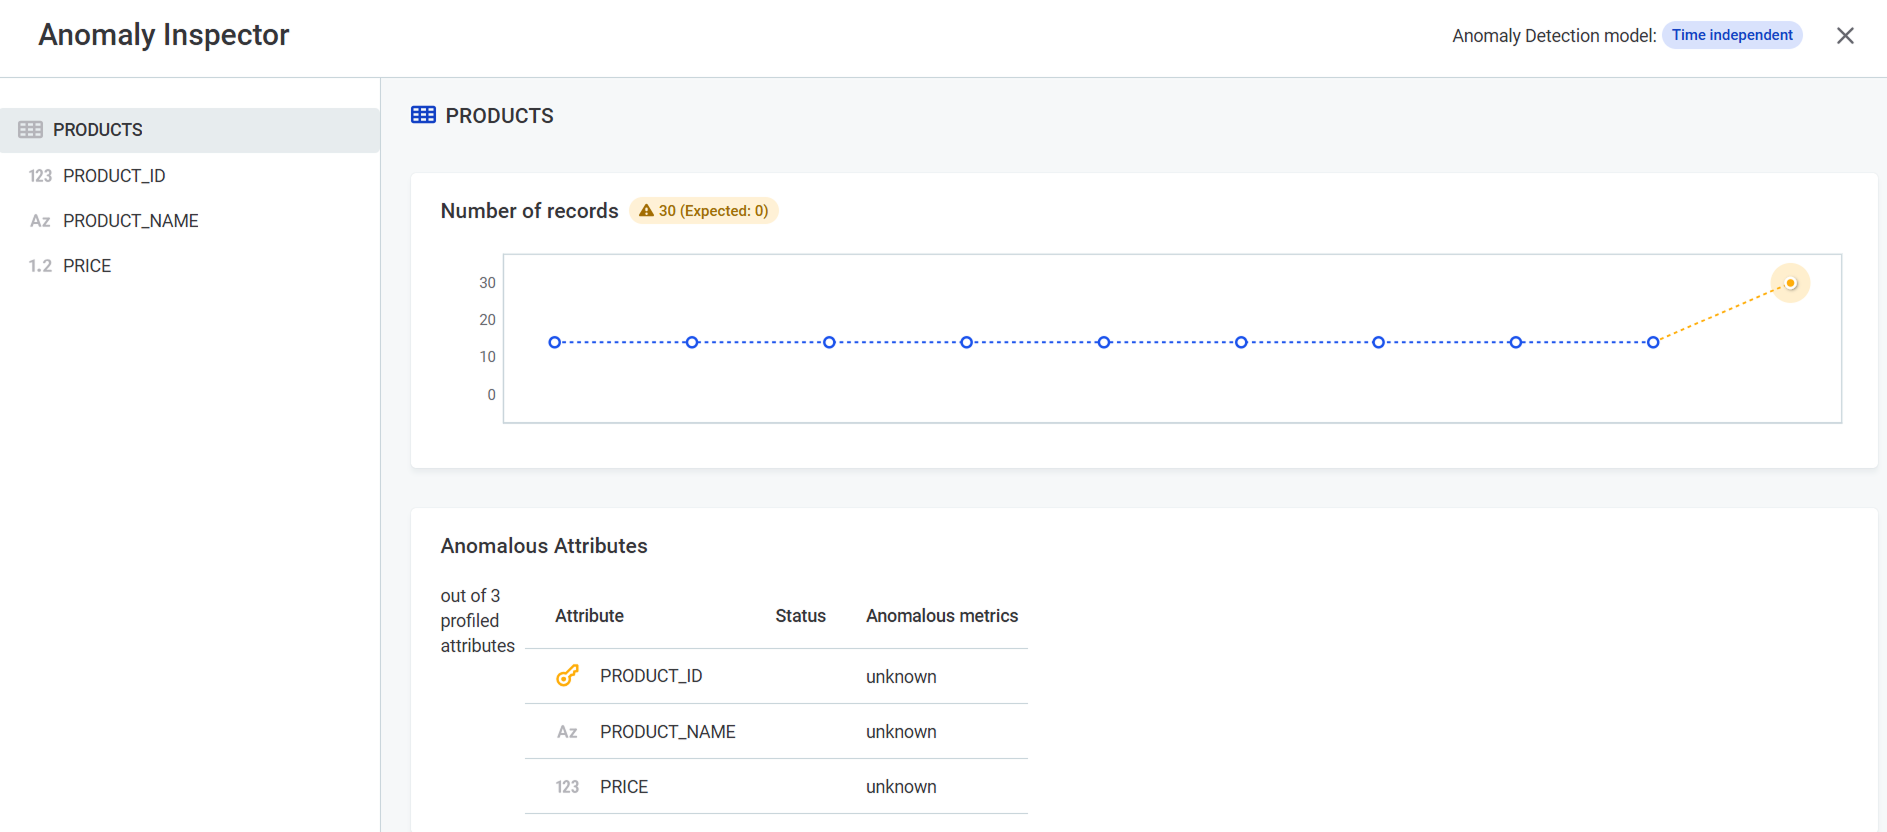
Select Show anomalous metrics.
-
The Anomaly Inspector opens, displaying the affected metrics.
How anomaly detection works
Detection timing
Anomaly detection starts working from the 6th profile on. It becomes more accurate the more data points there are available.
Detection model
The anomaly detection in Ataccama ONE currently uses time-independent model. This approach that analyzes data without considering the order or timing of events. It treats each data point as isolated, focusing on its value and how it compares to the overall distribution or expected patterns in the dataset.
This approach is particularly useful when:
-
The data doesn’t have a clear temporal component (e.g., customer demographic fields, transaction amounts without timestamps).
-
You want to detect outliers based on statistical deviations, unusual value combinations, or violations of data quality rules—regardless of when the data was collected.
Examples of anomalies that a time-independent model can catch include:
-
A numeric value far outside the expected range.
-
A text field with an invalid or unexpected category.
-
A record that violates a defined rule (e.g., age < 0 or email missing "@" symbol).
Time-independent models don’t capture patterns that evolve over time—so they may miss trends, seasonality, or sudden changes in data behavior over time.
Limitations of anomaly detection
-
An anomaly caused by variations in the number of records causes many other anomalies, particularly on count category (null-, distinct-, duplicate-, … count) in most of the attributes.
-
Anomalies are often detected on 'Frequencies' due to, for example:
-
New keys appearing (this is an extreme case of random sample and is partially fixed).
-
New keys added, lowering the relative occurrence of the existing keys.
-
-
Frequency keys are analyzed almost independently. It is not yet possible to reflect correlated changes among the keys.
-
The anomaly detection models start working optimally with more points, thus with few points it might be difficult to detect anomalies as expected.
-
Anomaly detection rules are applied but an explanation of such rules not yet provided in the application. Anomaly detection rules aid or block detection of anomalies but no information about it is shown to the user, it has the same visualization as the anomaly detection models.
Was this page useful?