
DPM Admin Console
What is DPM Admin Console?
DPM Admin Console is a browser-based tool that assists with supervising ONE jobs and provides the following information:
-
An overview of all jobs run in ONE, such as importing metadata, profiling, and DQ evaluation.
-
A list of events associated with each job.
-
A list of all Data Processing Engines (DPE) that are supervised by this instance of Data Processing Module (DPM).
Access permissions to DPM Admin Console can be limited based on user roles (by default, these include admin and DPP_admin roles) and it is also possible to set up single sign-on.
Jobs
On the Jobs tab, you can view all data processing jobs that you executed in ONE. Jobs can be filtered by job status (1) and sorted by Name, Type, Created (time of creation), Submitting User, Priority, or Progress. Additionally, if the job is still running, you can cancel it by selecting Kill Job in the three dots menu.
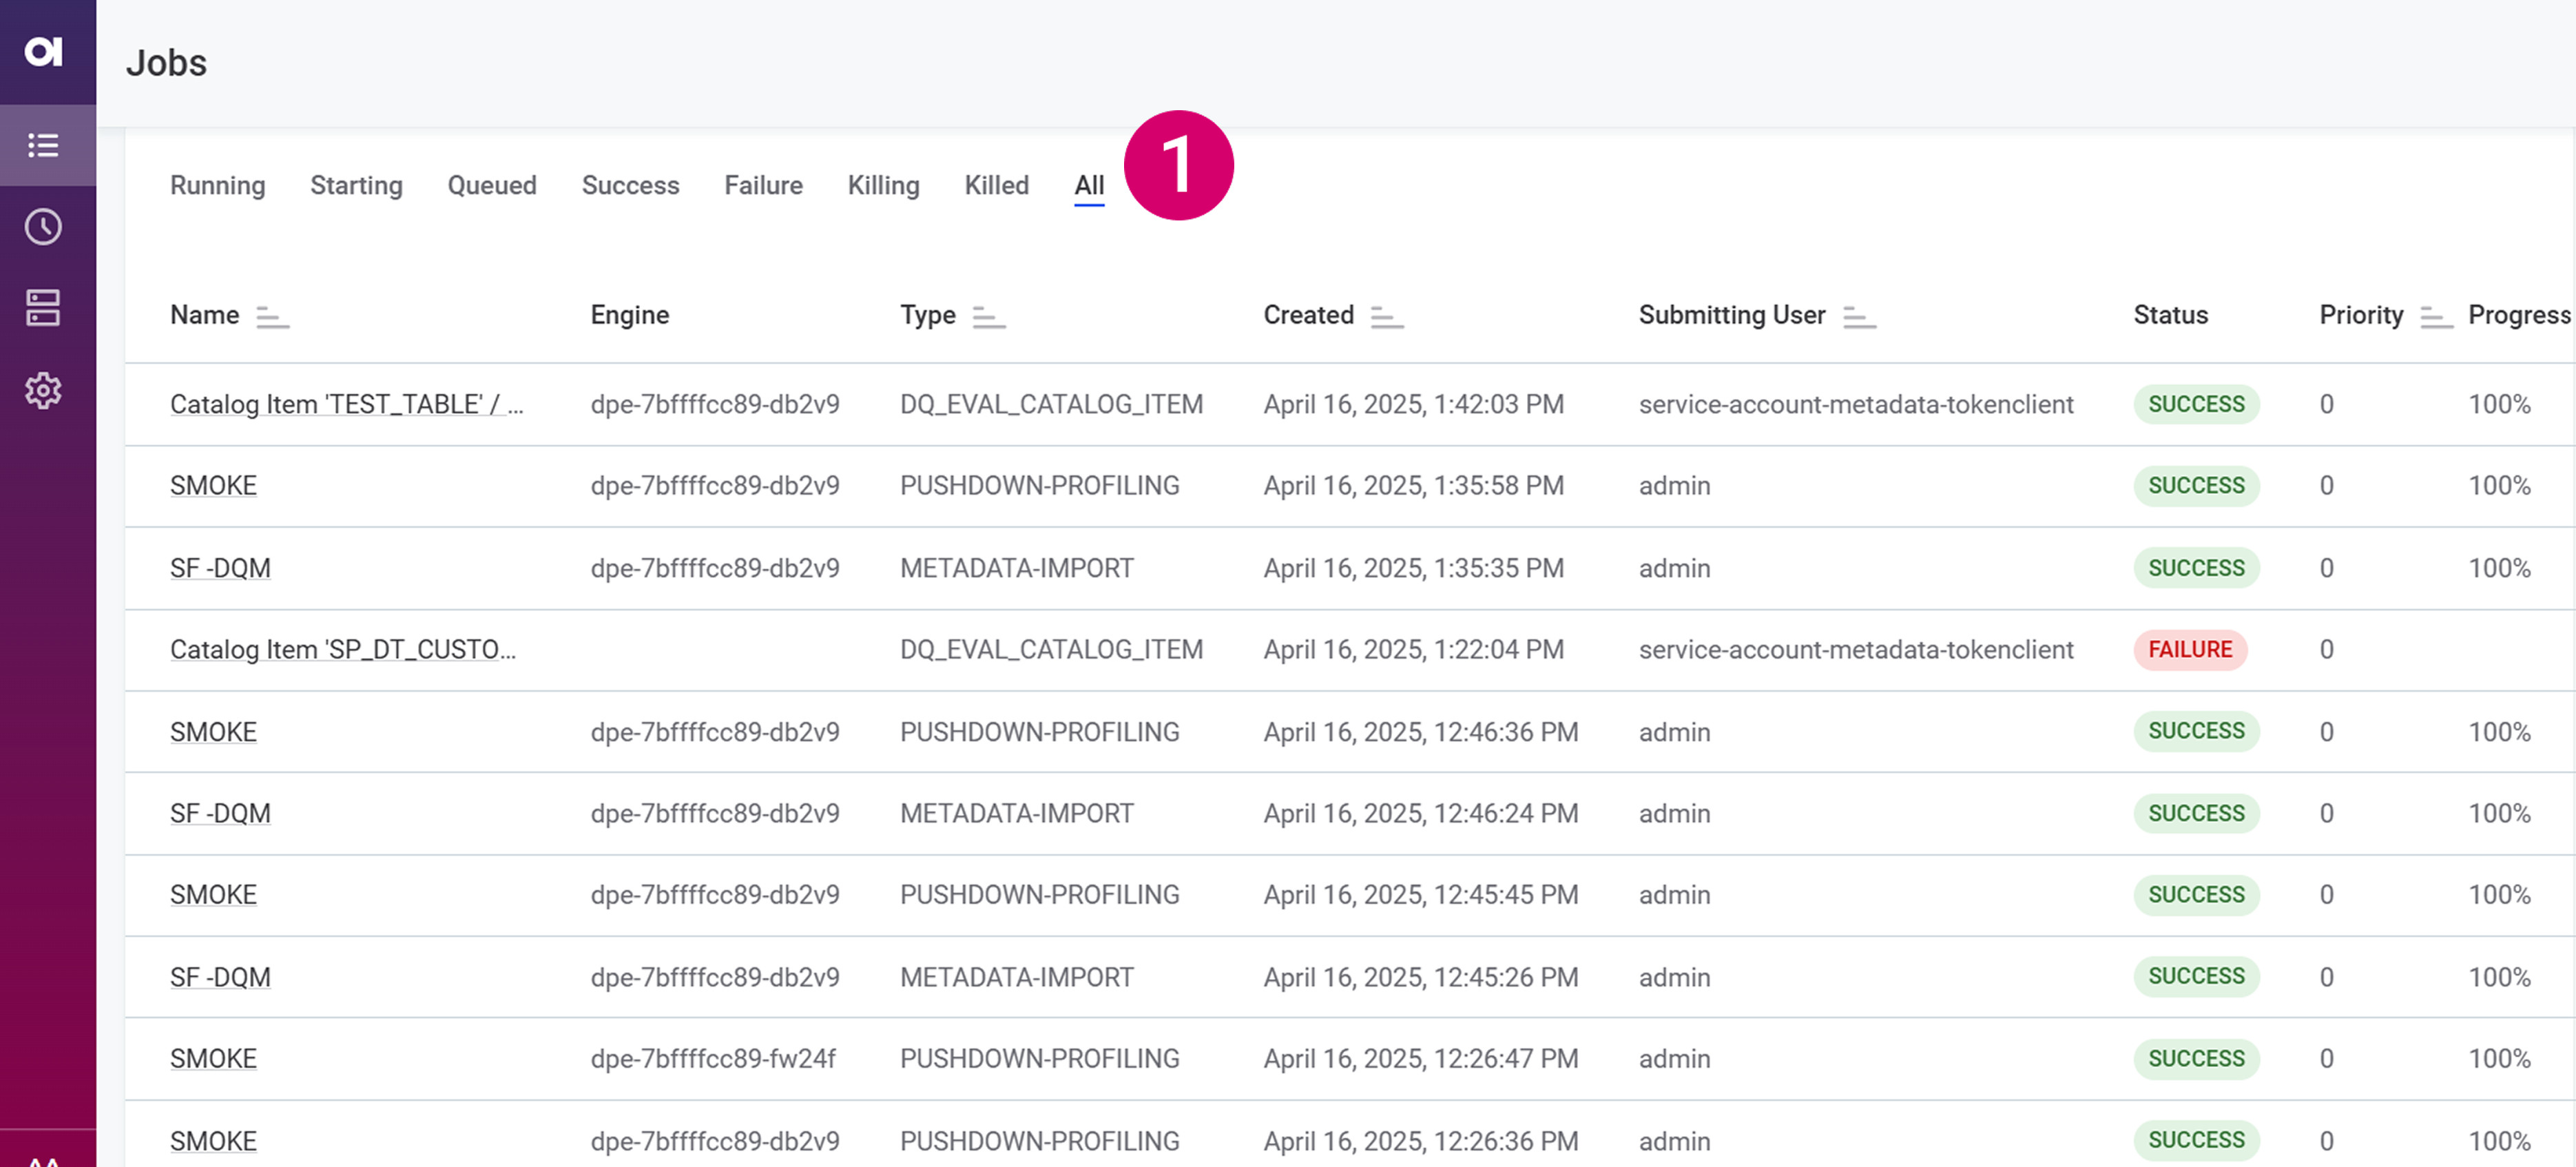
You can also see the status of the job in the Status tab.
See here for a full list of possible job statuses and their descriptions
-
UNKNOWN - Default initial state for newly created jobs.
-
SUBMITTED - Job has been submitted to the data processing pipeline.
-
PREPROCESSING - Job is in the preprocessing stage of the pipeline.
-
QUEUED - Job is waiting in queue to be sent to the data processing engine.
-
SUBMITTING - Job is being submitted to the data processing engine.
-
SUBMITTED_TO_ENGINE - Job has been successfully submitted to the data processing engine.
-
STARTING - Data processing engine is initializing the job.
-
RUNNING - Job is actively being processed by the engine.
-
PROCESSED - Job processing has been completed by the engine.
-
POSTPROCESSING - Job is in the final postprocessing stage.
-
SUCCESS - Terminal state indicating successful job completion.
-
FAILURE - Terminal state indicating job failure.
-
KILLING - Job has been selected for termination by user.
-
KILLED - Job has been successfully terminated.
-
DISCONNECTED - Engine has disconnected and associated jobs are marked accordingly. If the engine reconnects before timeout, the job will revert to its standard state.
-
EVICTED - Job requires restart due to pipeline rescheduling. This status indicates that part of the data processing pipeline needed to be rescheduled, and the job needs to be restarted at that stage of the pipeline.
To view more details about a particular job, select the job from the list.
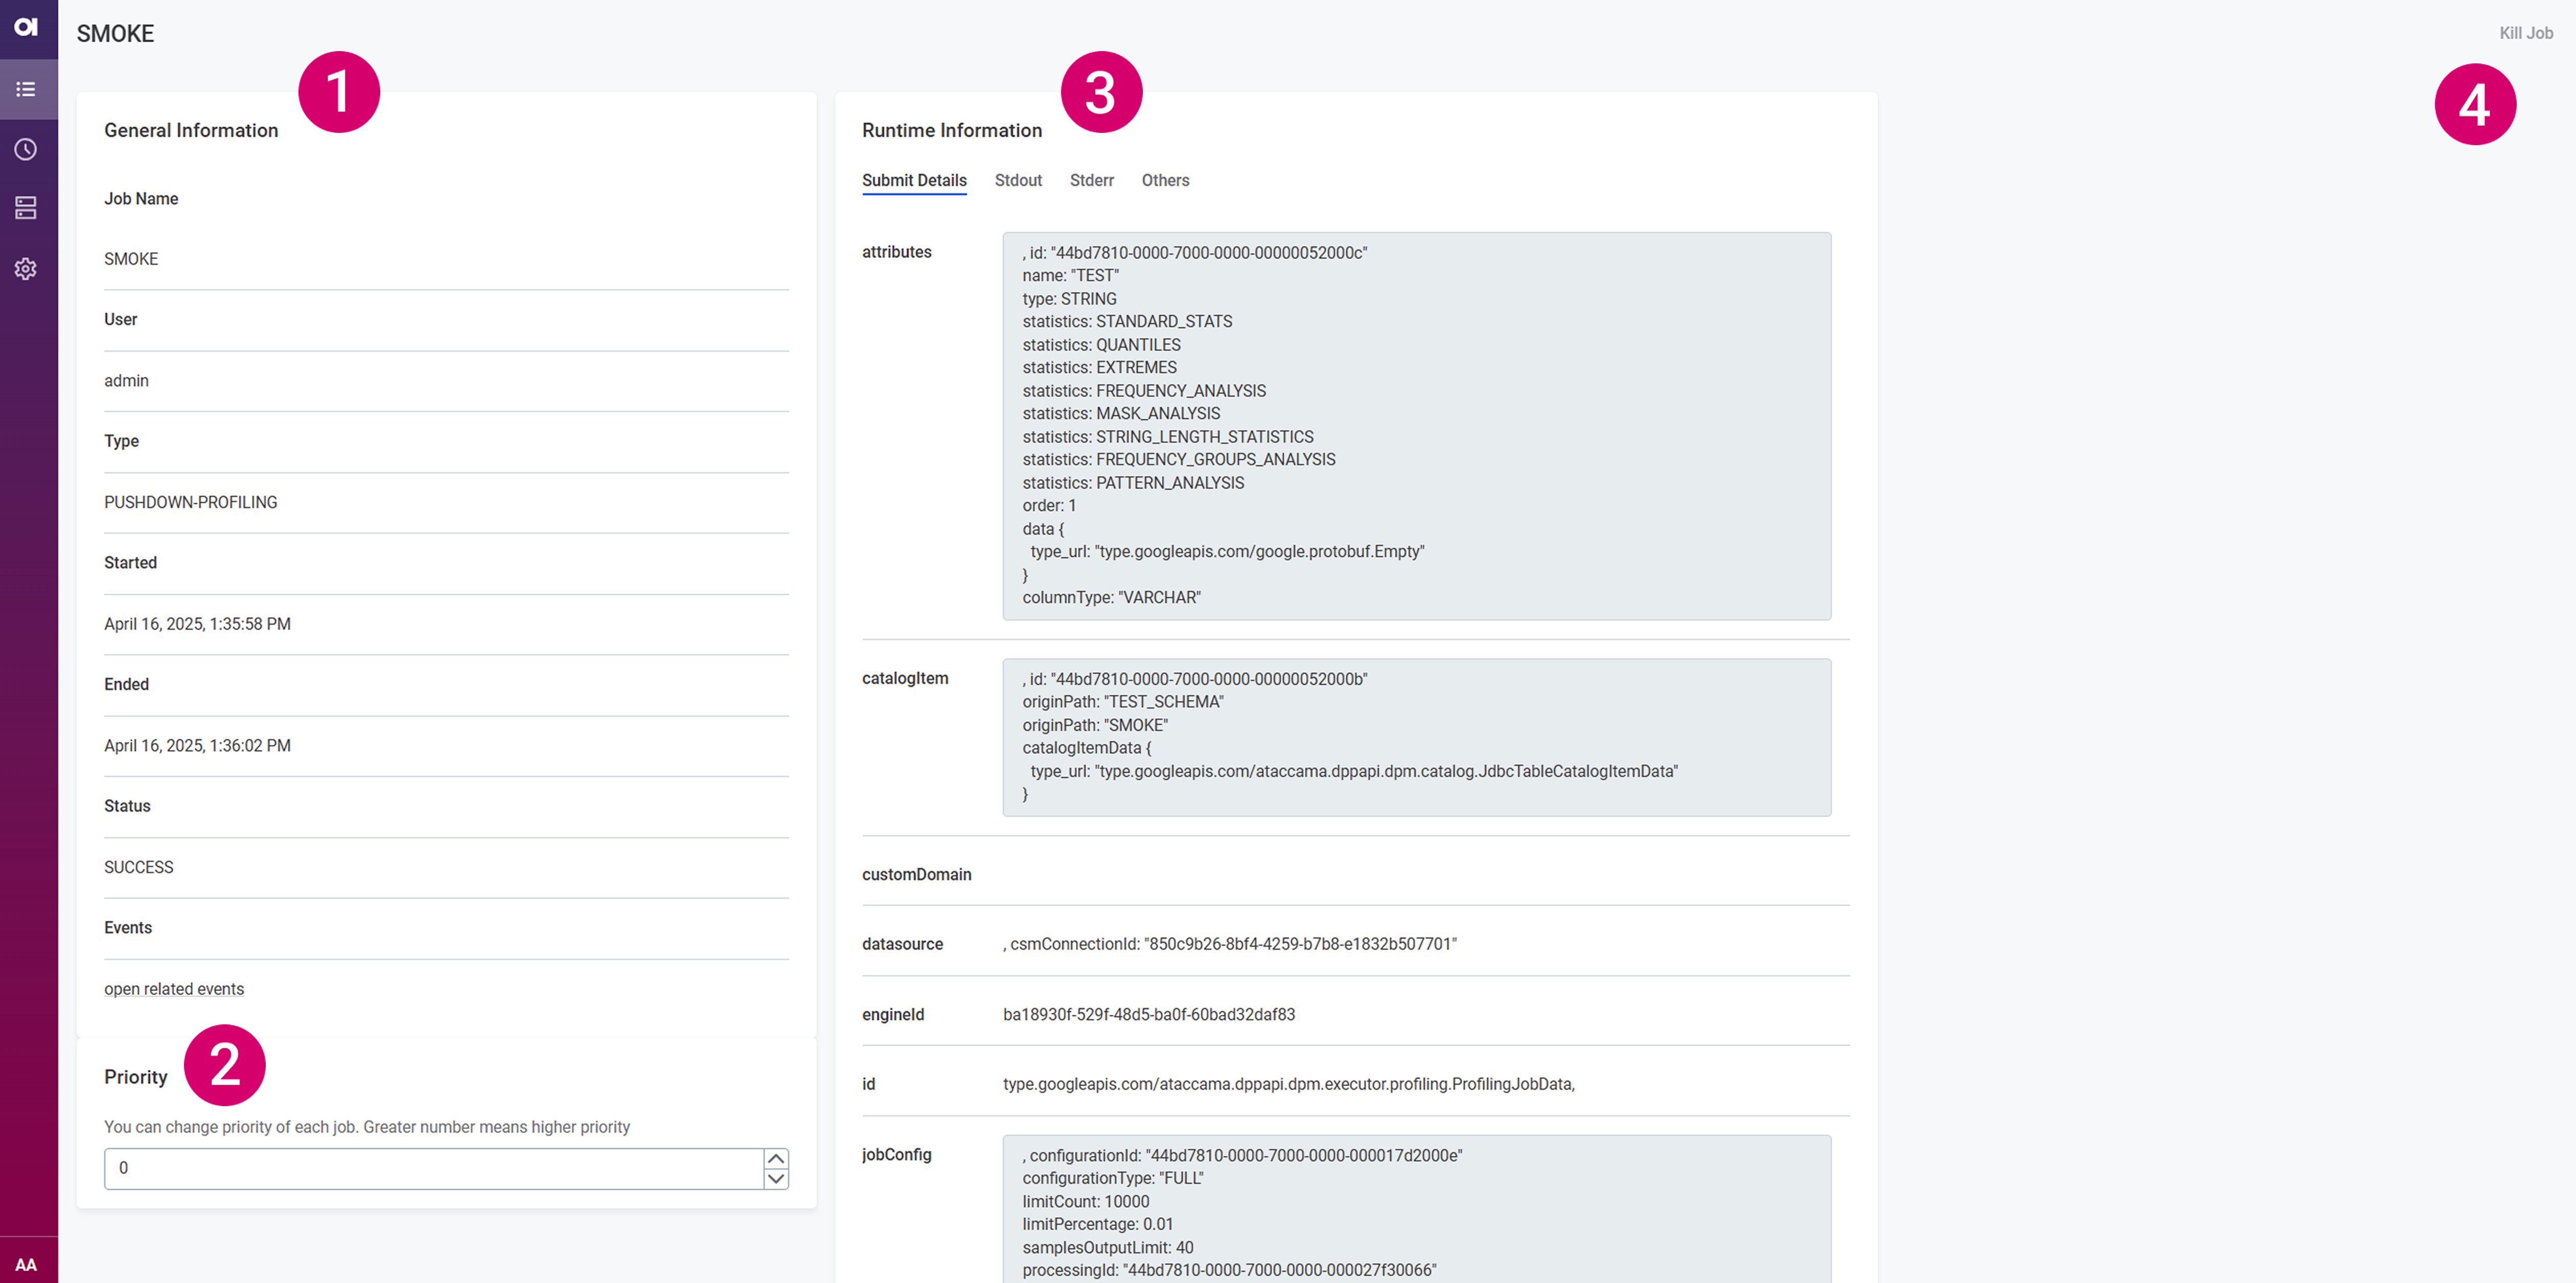
The job information is grouped as follows:
-
General Information (1) - Provides basic information such as the job name, type, and status, the name of the user who submitted the job, the date and time when the job was started and finished, as well as related events.
To view all events connected to this job, select Open related events. This initiates a search query based on the job identifier and displays all events associated with the job in question. For more information, see Events.
-
Priority (2) - Lets you adjust the priority of running jobs in the job queue. The priority level is expressed in integers.
-
Runtime Information (3) - This section is further organized into four tabs:
-
Submit Details: Job submit details include various information about files, directories, and configuration settings used when submitting the job.
For example, this covers the locations of working (
localRoot), job (dir), and runtime (runtime) folders, runtime (RuntimeConfiguration) and server (dqdServerConfig,config) configurations, data source and catalog item details, entity, component, and plan structures, entity attributes, launch type (for profiling jobs), and more.
-
-
Stdout: Shows the job processing STDOUT stream.
-
Stderr: Shows the job processing STDERR stream.
These two tabs, Stdout and Stderr, facilitate debugging as you do not need to search through the logs to retrieve the relevant information.
-
Others: Here you can find any additional information about the files and scripts used to submit the job, such as dependencies properties, which list the lookups and components used in the job, or the job PID.
-
Kill Job (4) - Use this to cancel running jobs. You can also cancel a job from the Jobs overview. When that is no longer possible, the option is grayed out.
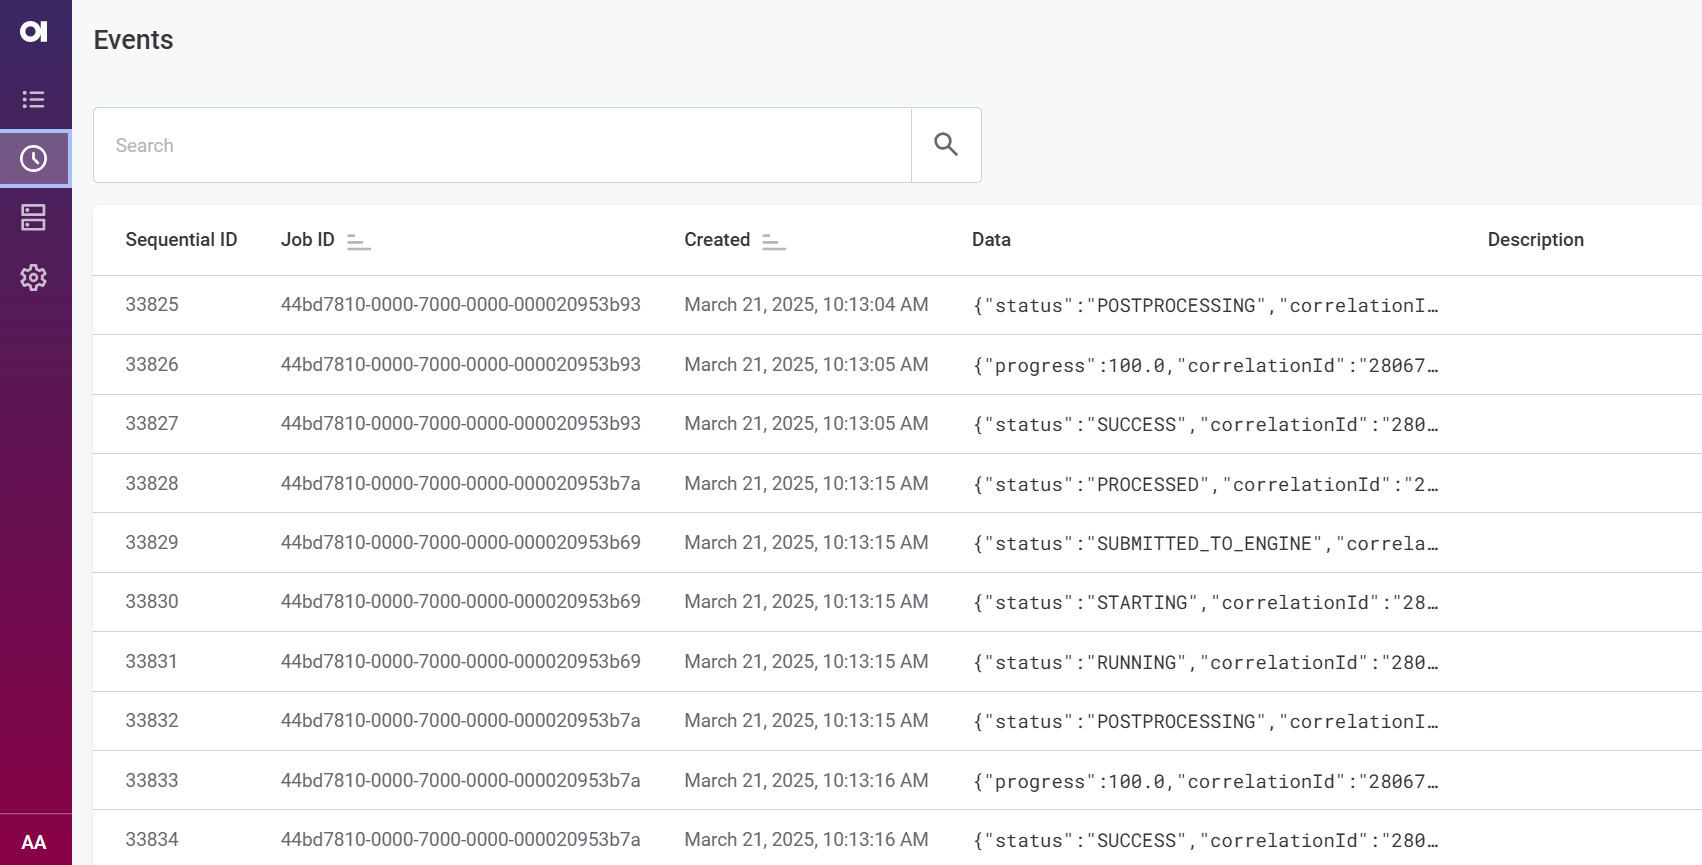
Events
Events help trace different stages through which a data processing job goes through from start to finish. This can make it easier to identify why a certain job failed and at which point.
The Events overview lists all events that DPM registered and provides the following details:

-
Sequential ID: The consecutive number assigned to the event when it was initiated.
-
Job ID: The identifier of the job to which the event is connected. This identifier can be used to retrieve all events related to a single job.
-
Created: The date and time when the event was created.
-
Data: Typically the status or the progress of the event.
-
Description: Any additional information relevant for the event.
Events can be sorted by the job identifier (Job ID) or the time of creation (Created). Selecting an event shows the event information in the sidebar.
Engines
The Engines tab shows all DPEs that are handled by your instance of DPM, which is particularly useful when you are running multiple instances of DPE.
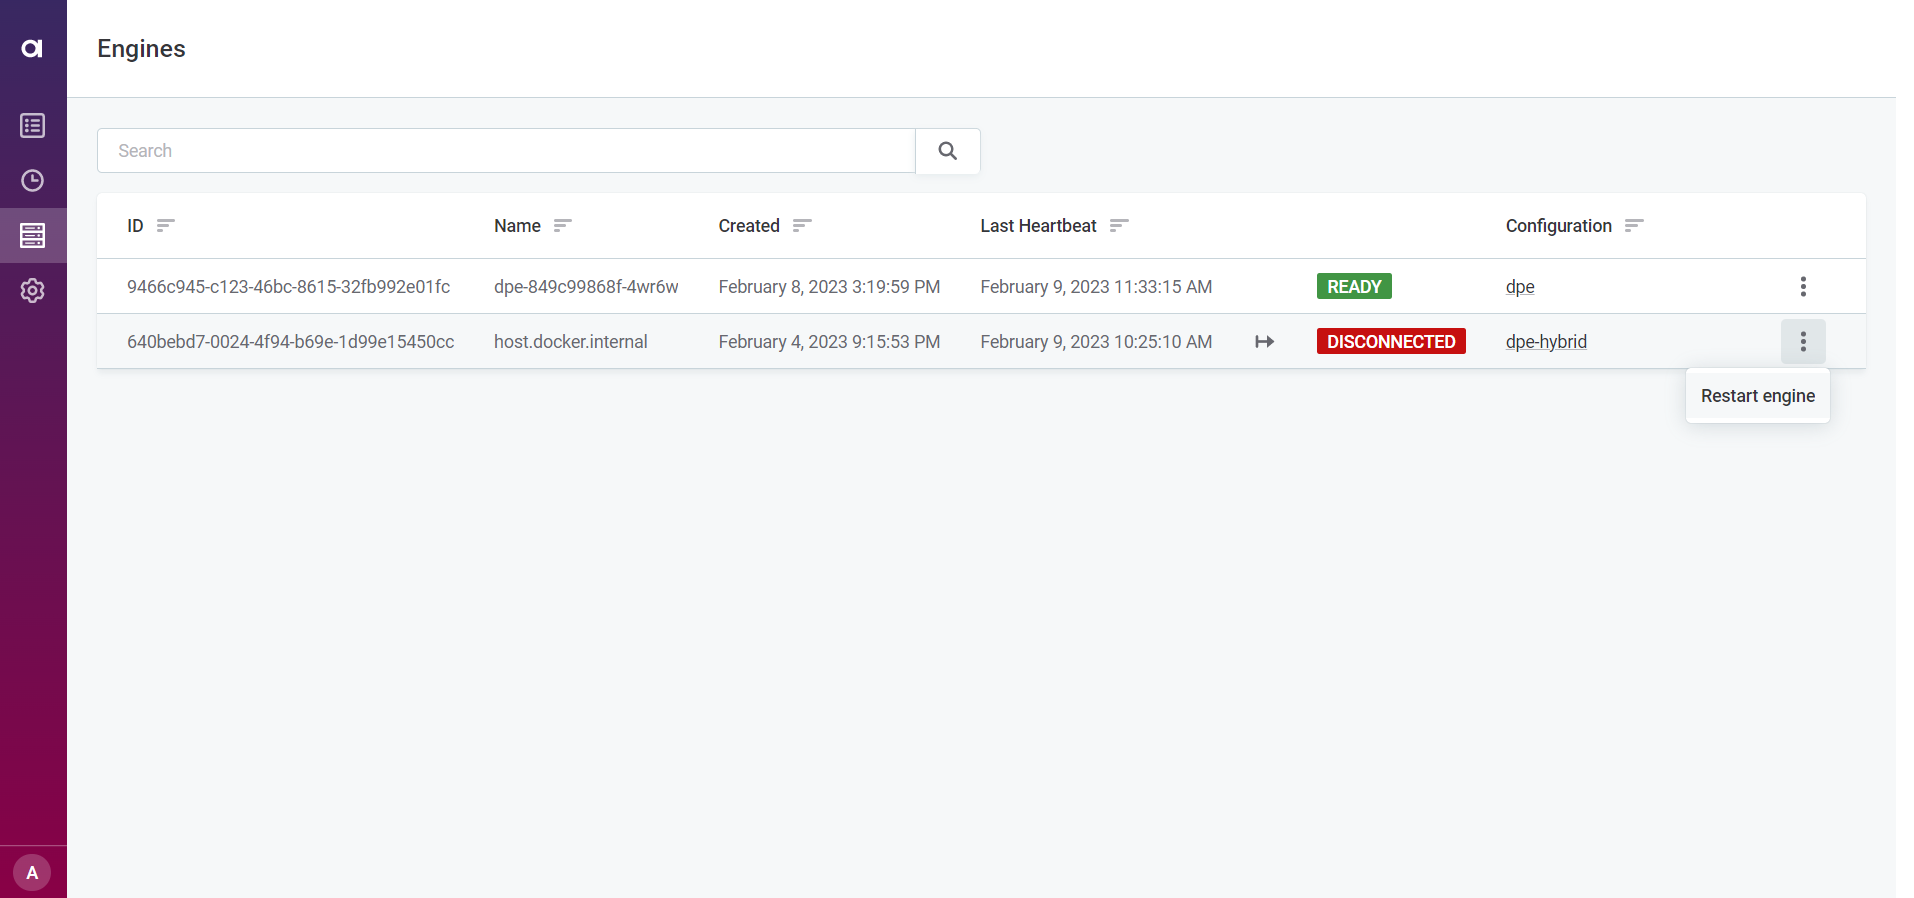
For each engine, you can see the following information:
-
ID: The engine identifier.
-
Name: A meaningful name for this engine.
-
Created: The date and time when the engine was registered with DPM.
-
Last Heartbeat: The last heartbeat that DPM received from this engine, that is, the last time that DPM was able to check the engine’s status.
-
Status: The current status of the engine. If the engine is running, the status is
READY. -
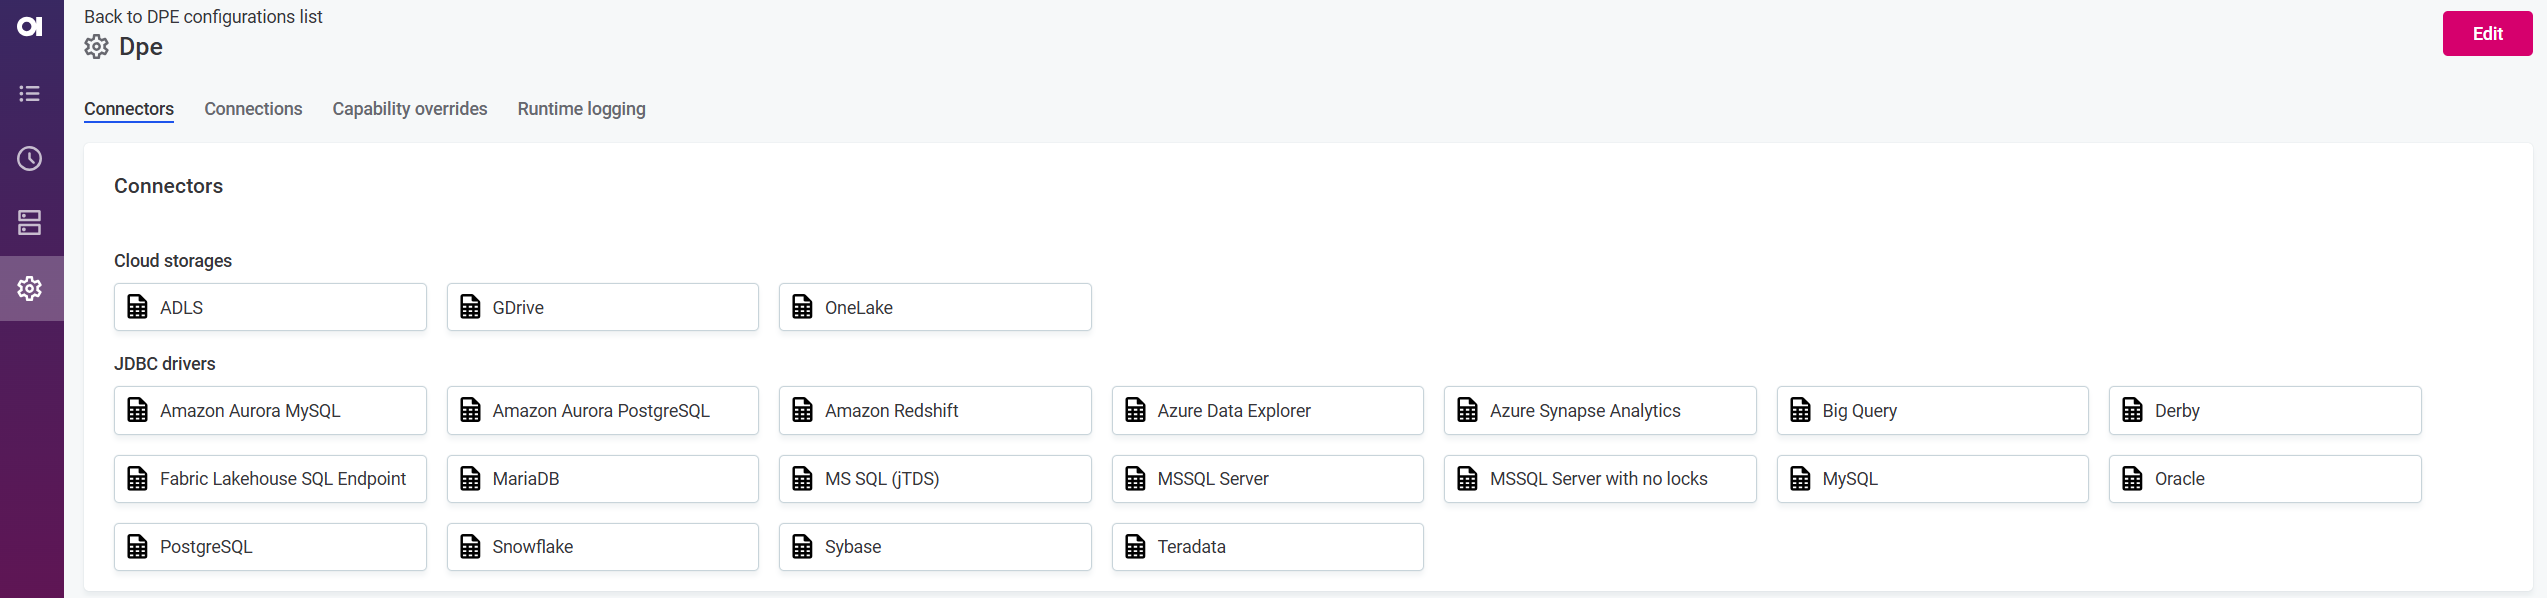
Configuration: Displays the DPE label assigned to each engine.
Select a label to see the configuration page for all DPEs grouped under that label.
DPEs with different configurations must have unique labels, as changes made to one DPE with a particular label affect all other DPEs with the same label. -
Restart: You might need to restart your DPEs for your changes to take effect. To do this, select the three dots menu next to the DPE you want to restart and then Restart engine.
Select an engine from the list to view the following additional information:
-
Address: The location (host and port) at which the engine is available.
-
Max Message Size: The maximum size of messages that can be processed by the gRPC server, specified by the property
ataccama.server.grpc.max-message-size. -
Constraints: Define the capabilities of each engine and help route jobs to particular DPEs based on those characteristics, such as the connected data sources, file systems, or job types.
Configuration
In Configuration you can see the connected data processing engines (DPEs).
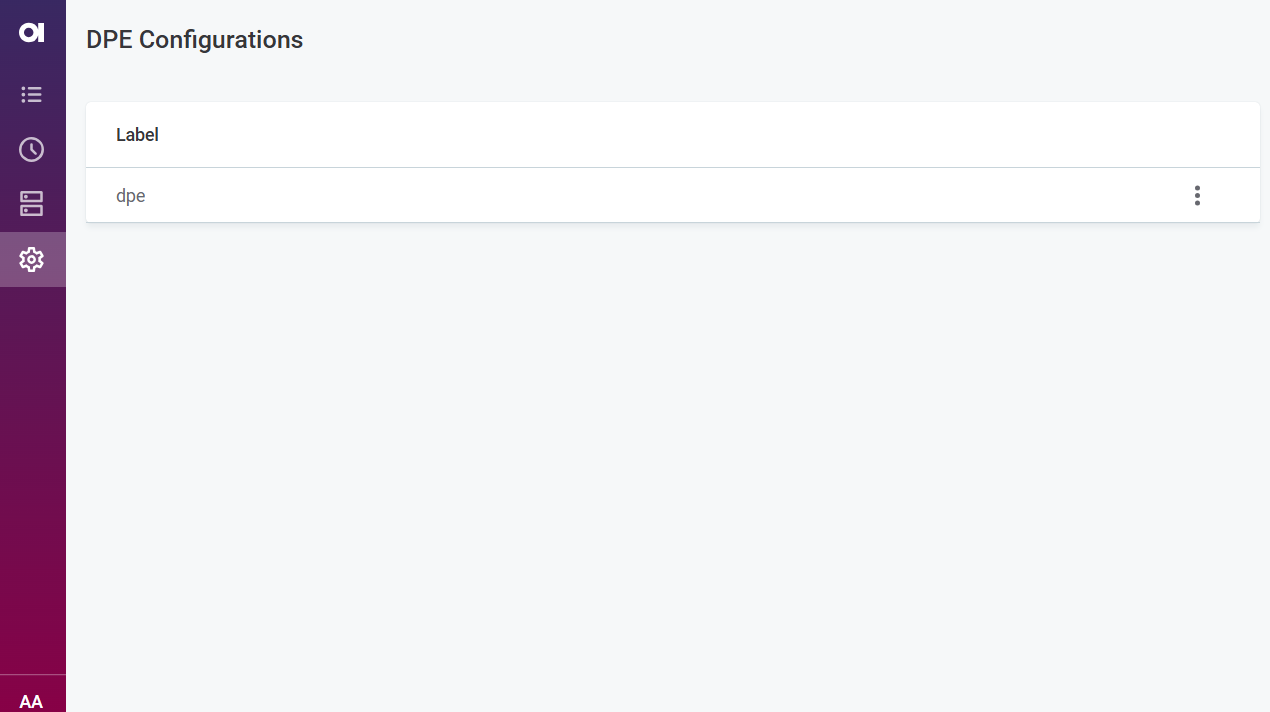
Select a DPE to see details about Connectors, Connections, Capability overrides, and Runtime logging. All values are read-only.
Was this page useful?