
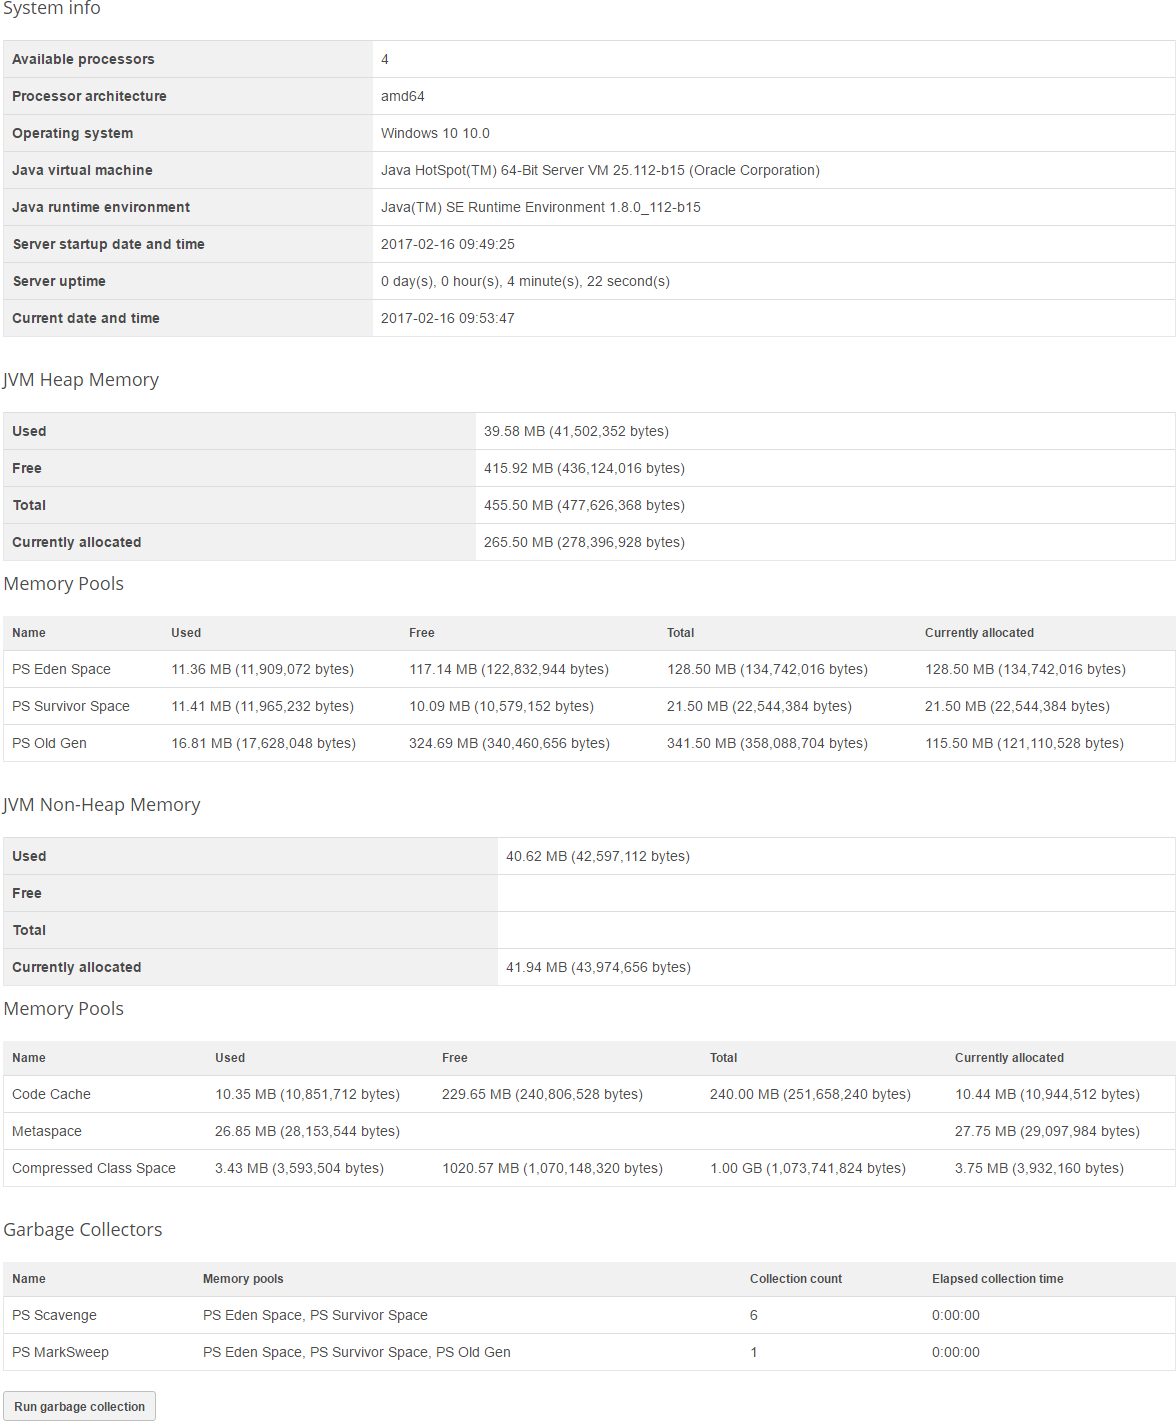
Resources
The Resources section provides information about the system, used resources, general health status of the server, database connections, and more.
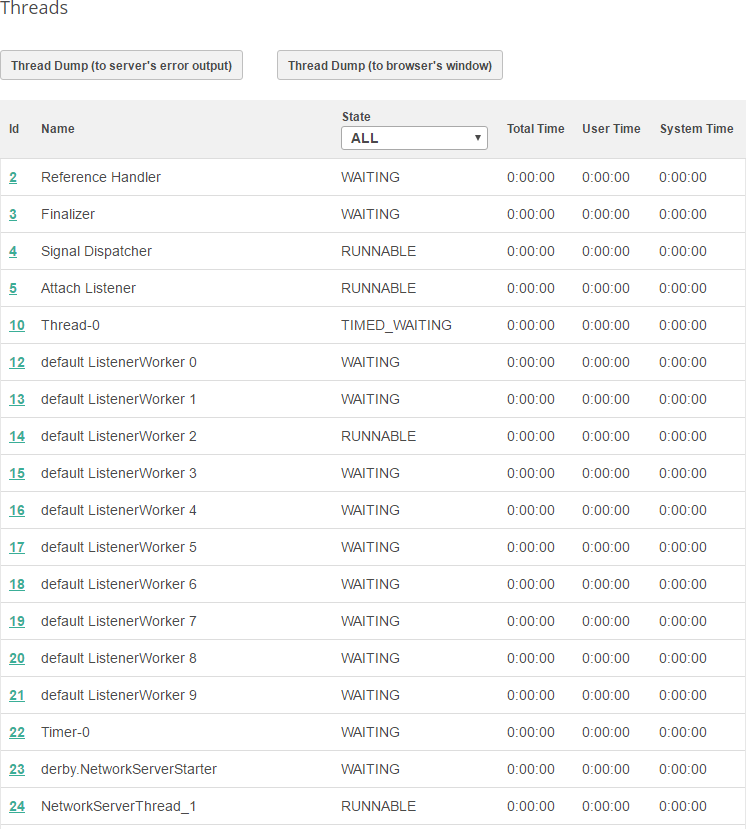
Threads
Provides information about the threads, their state and time used.
The two options (Thread Dump (to server’s error output) and Thread Dump (to browser’s window)) enable creating a dump with detailed information about the threads either to the standard output (console) or to the browser window.
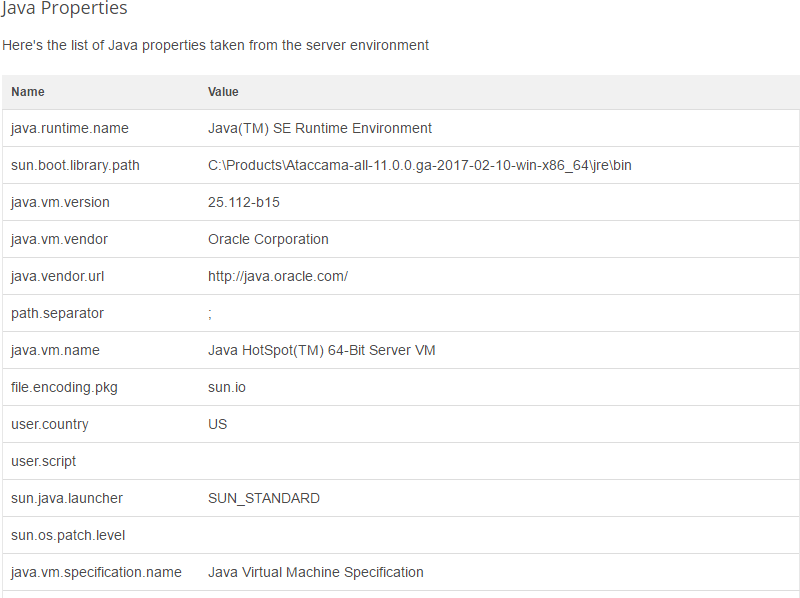
Java properties
The Java Properties section allows you to inspect the Java Virtual Machine configuration and variables. An excerpt is provided here:
Database connections
Provides information about the database connections defined in the Runtime Configuration.
<dataSources>
    <dataSource driverclass="org.apache.derby.jdbc.ClientDriver" name="derby"
        url="jdbc:derby://localhost:1527/myderby;create=true"
        user="test" password="crypted:DES:NsuAku14ipInv4Z7FZAFKRjAVIxjqxmTpX8HwSTGUlE="/>

<dataSource driverclass="oracle.jdbc.OracleDriver" name="oracle"
        url="jdbc:oracle:thin:@Spurlin:1521:test1"
        user="rdm_demo_nl" password="crypted:DESede:Pmc0Hz2JADIU4H070ypAum1Yb79gzMF/"/>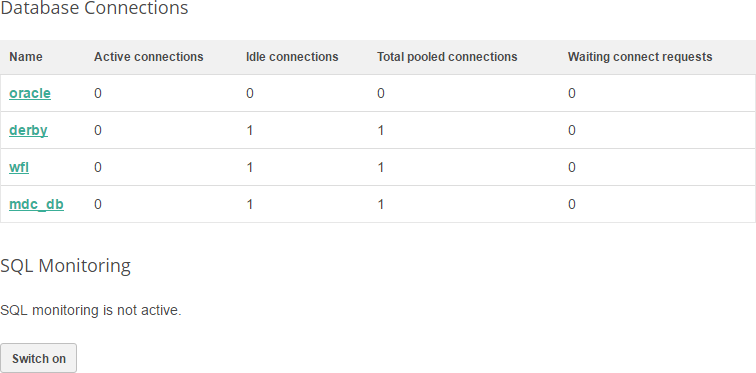
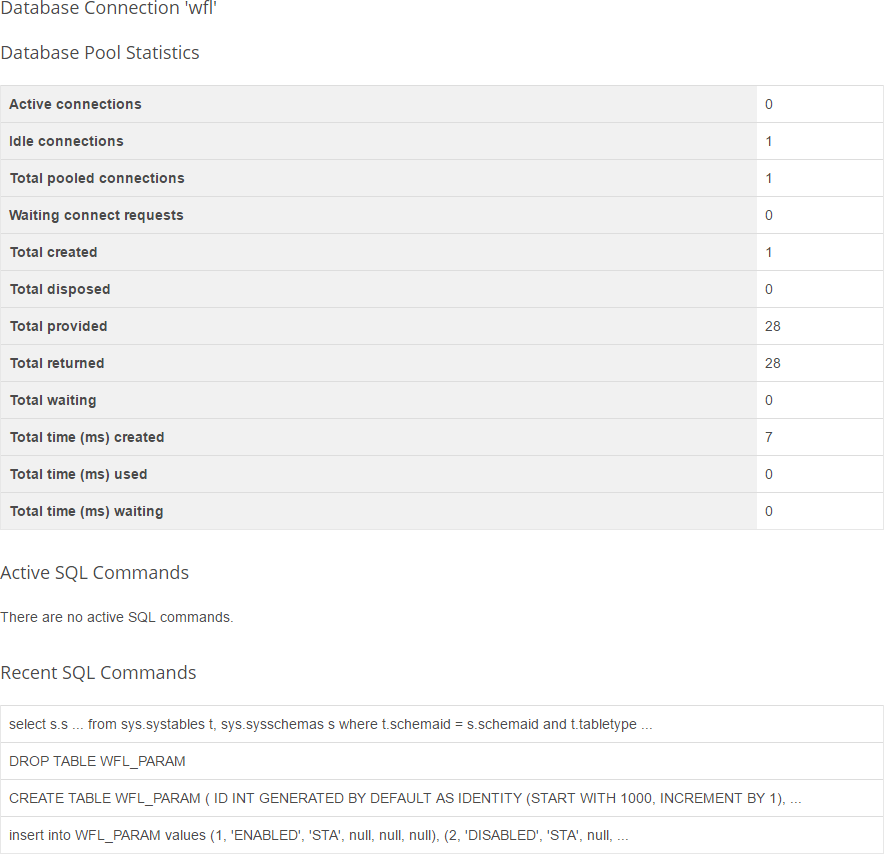
Select a database name to view the database details, including data pool statistics, active SQL commands, and recent SQL commands.
|
To see active or recent commands, turn on SQL monitoring on the previous screen. When SQL monitoring is switched on, you can reset all statistics (SQL commands, Database Pool Statistics) on the same screen or on the screen with an individual database connection. Statistics are reset after the online server is restarted. |
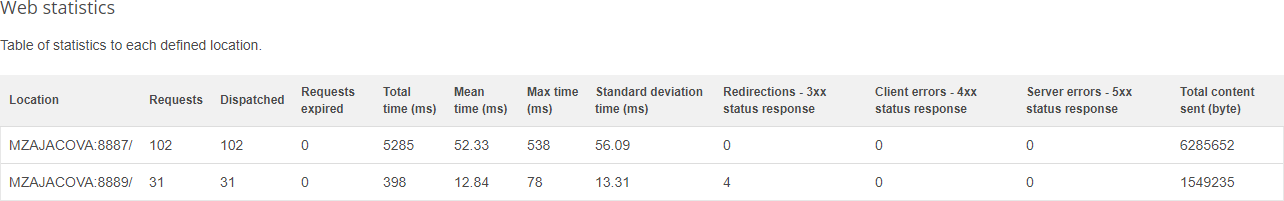
Web statistics
Shows web statistics for all endpoints (including online services endpoints, the endpoint for the web console, and so on).
Server health status
Provides an overview of the state of the server and its components: HTTP listeners, database connections, scheduler, and more. Whether the server health status is shown in the Navigation Panel or not depends on whether the Server Health State Components is defined in the Server Configuration.
Additionally, you can control whether certain sensors in the Server Health Status section are displayed by configuring the following server components:
-
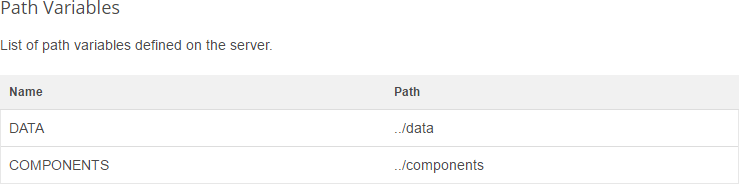
Health State Providers component: Displays the health status of database connections and path variables.
-
S3 Health State Provider component: Displays the health status of the Amazon S3 server connections.
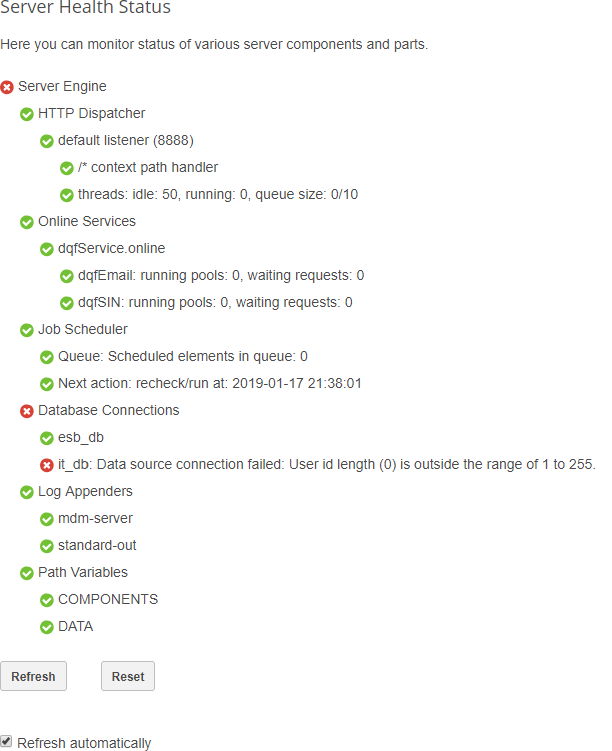
The equivalent machine-readable health status in XML is available at <host>:<port>/health?format=xml:
Click here to view the server health status in XML
<component name="Server Engine" stateCode="30" id="server" state="FATAL_ERROR">
    <component name="HTTP Dispatcher" stateCode="5" id="HttpDispatcherInstance" state="OK">
        <component name="default listener (8889)" stateCode="5" id="default" state="OK">
            <component name="/* context path handler" stateCode="5" id="/*" state="OK"/>
        </component>
        <component name="default2 listener (8887)" stateCode="5" id="default2" state="OK">
            <component name="/* context path handler" stateCode="5" id="/*" state="OK"/>
        </component>
    </component>
    <component name="Online Services" stateCode="30" id="OnlineEngine" state="FATAL_ERROR">
        <component name="services.online" stateCode="30" id="services_online" state="FATAL_ERROR" message="Error message: Online configuration is not valid!"/>
    </component>
    <component name="Job Scheduler" stateCode="5" id="SchedulerServerComponentInstance" state="OK">
        <component name="Queue" stateCode="5" id="scheduledElements" state="OK" message="Scheduled elements in queue: 1"/>
        <component name="Next action" stateCode="5" id="schedulerNextAwake" state="OK" message="recheck/run at: 2018-11-20 16:57:08"/>
    </component>
    <component name="Database Connections" stateCode="5" id="dataSources" state="OK">
        <component name="wfl" stateCode="5" id="wfl" state="OK"/>
    </component>
    <component name="Log Appenders" stateCode="5" id="logAppenders" state="OK">
        <component name="online" stateCode="5" id="online" state="OK"/>
        <component name="stdout" stateCode="5" id="stdout" state="OK"/>
    </component>
    <component name="Path Variables" stateCode="5" id="pathVariables" state="OK">
        <component name="COMPONENTS" stateCode="5" id="COMPONENTS" state="OK"/>
        <component name="DATA" stateCode="5" id="DATA" state="OK"/>
    </component>
</component>
Each component and its subcomponents have a state and stateCode attributes, with the following meanings:
We recommend using the state attribute for parsing states.
|
| State | Code | Description |
|---|---|---|
UNKNOWN |
0 |
The implementation cannot report to HealthState at this time. |
OK |
5 |
The element is fully functional and operating within expected operational parameters and without errors. |
WARNING |
10 |
The element is in working order and all functionality is provided. However, the element is not working to the best of its abilities. For example, it might not be operating at the optimal level or it might be reporting recoverable errors. |
MINOR_FAILURE |
15 |
All functionality is available but some might be degraded. |
MAJOR_FAILURE |
20 |
The element is failing. It is possible that some or all functionality of this component is degraded or not working. |
CRITICAL_FAILURE |
25 |
The element is non-functional and recovery might not be possible. |
FATAL_ERROR |
30 |
The element has completely failed and recovery is not possible. All functionality provided by this element has been lost. It is recommended to use the state attribute for parsing states. |
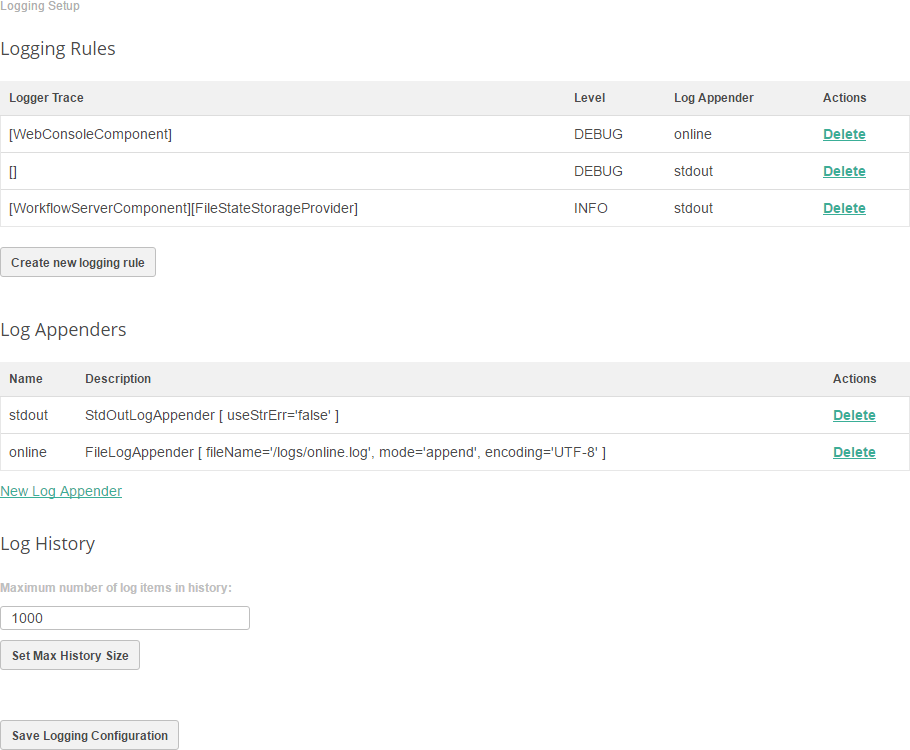
Logging setup
Lets you configure the log file by information type. Whether the Logging Setup is displayed or not depends on how the Logging Component is defined in the Server Configuration.
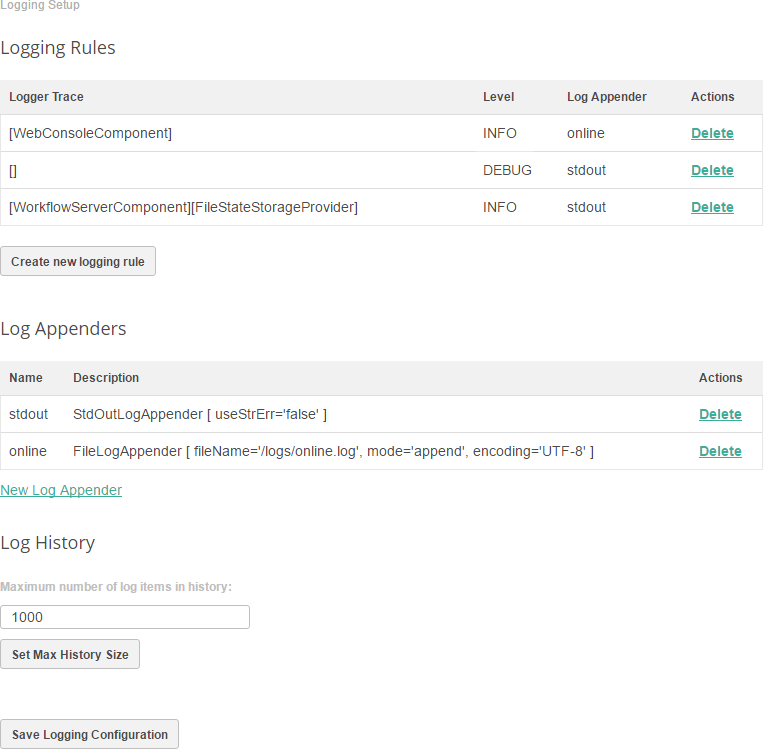
To create a new logging rule, select Create new logging rule. This opens the following dialog:
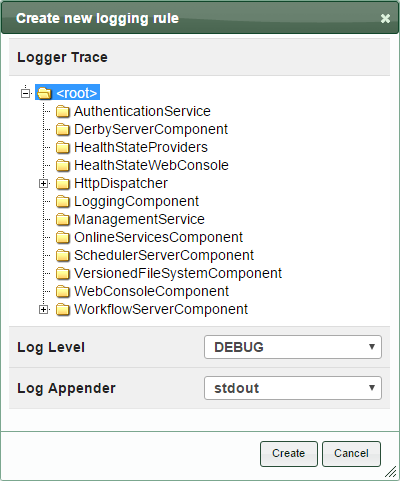
Select the component to which the logging rule should be applied, the log level, and the log appender. To add a new log appender, select New Log Appender.
For more information, see Logging Configuration and How to Log Workflow Execution.
| Don’t forget to select Save Logging Configuration when you are done making changes. |
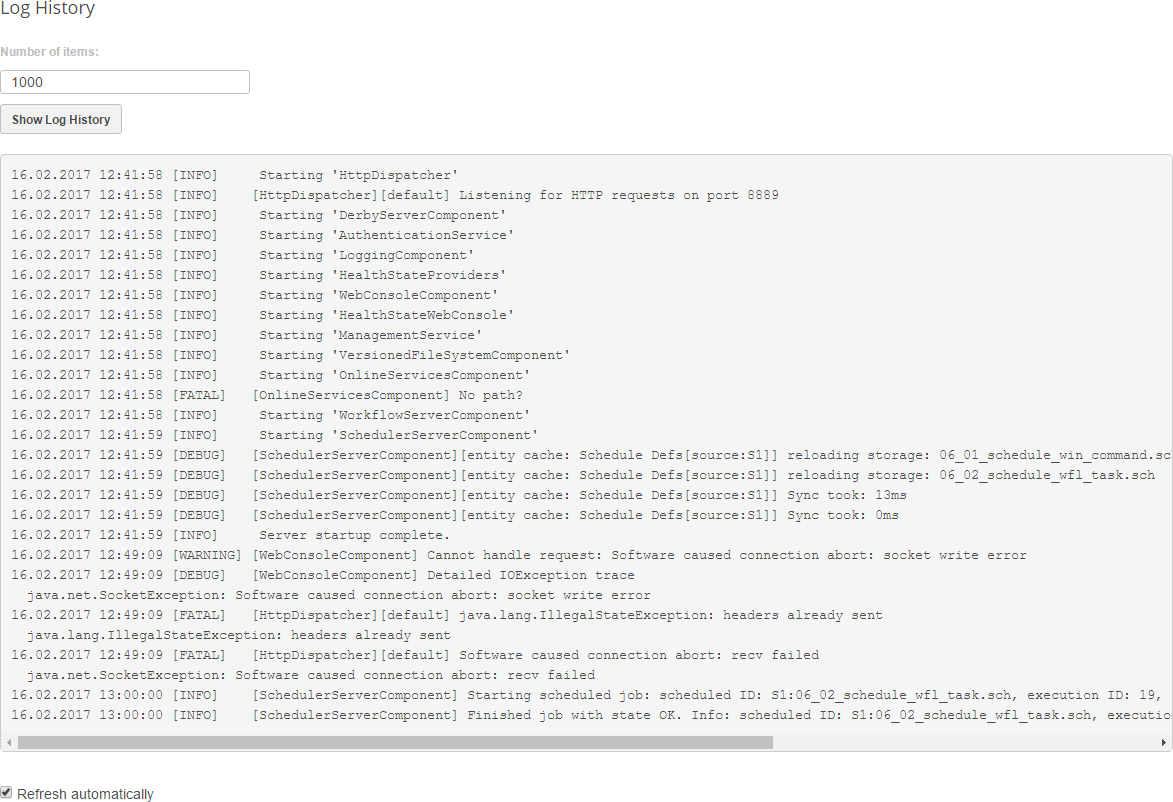
Log history
Shows the server log. The number of lines can be limited in the Number of items field.
Whether the Log History is displayed or not depends on how the Logging Component is defined in the Server Configuration.
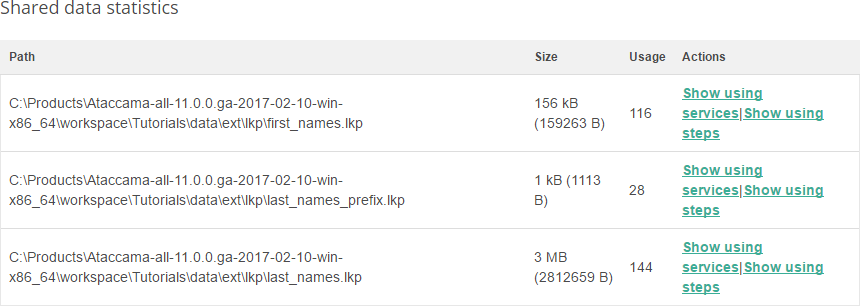
Shared data statistics
Displays a list of files used by the online services. To track a given file to the specific services and steps it is used in, select Show using services and Show using steps respectively.
When browsing through the steps the file is used in, you can also see information about the connections between the steps. To show this section in the ONE Runtime Server Admin, add the Server File System Service Component part into the Server Configuration.
Was this page useful?