
Performance Tuning
The following parameters are expert settings intended for advanced users. Improper configuration can lead to performance degradation instead of improvement.
Key considerations
Basic principle
When tuning performance, consider the impact of settings within the context of the entire system. High values for parallelism, typically exceeding 8-12, can exhaust resources and reduce performance.
Resource allocation
It’s essential to monitor hardware utilization (CPU, memory, disk operations, and temporary storage space usage) for all services, especially the application and database servers, when adjusting these settings.
Ensure that the hardware used for MDM is not shared with other services that might degrade performance and stability.
MDM transformation plans
When using MDM transformation plans, avoid steps that interact directly with the MDM repository (for example, SQL Select, SQL Execute) or MDM read and write steps, as well as external calls (for example, Web Lookup, Json Call).
These actions typically cause performance issues that are outside product support and need to be addressed on a project basis. Using such steps in load and export interfaces can also cause localized performance issues.
Parallelism setup
MDM processing parallelism can be influenced in several ways. Individual tasks can run in parallel, and operations and entities within the processing can run concurrently.
Task parallelism (processing parallelism)
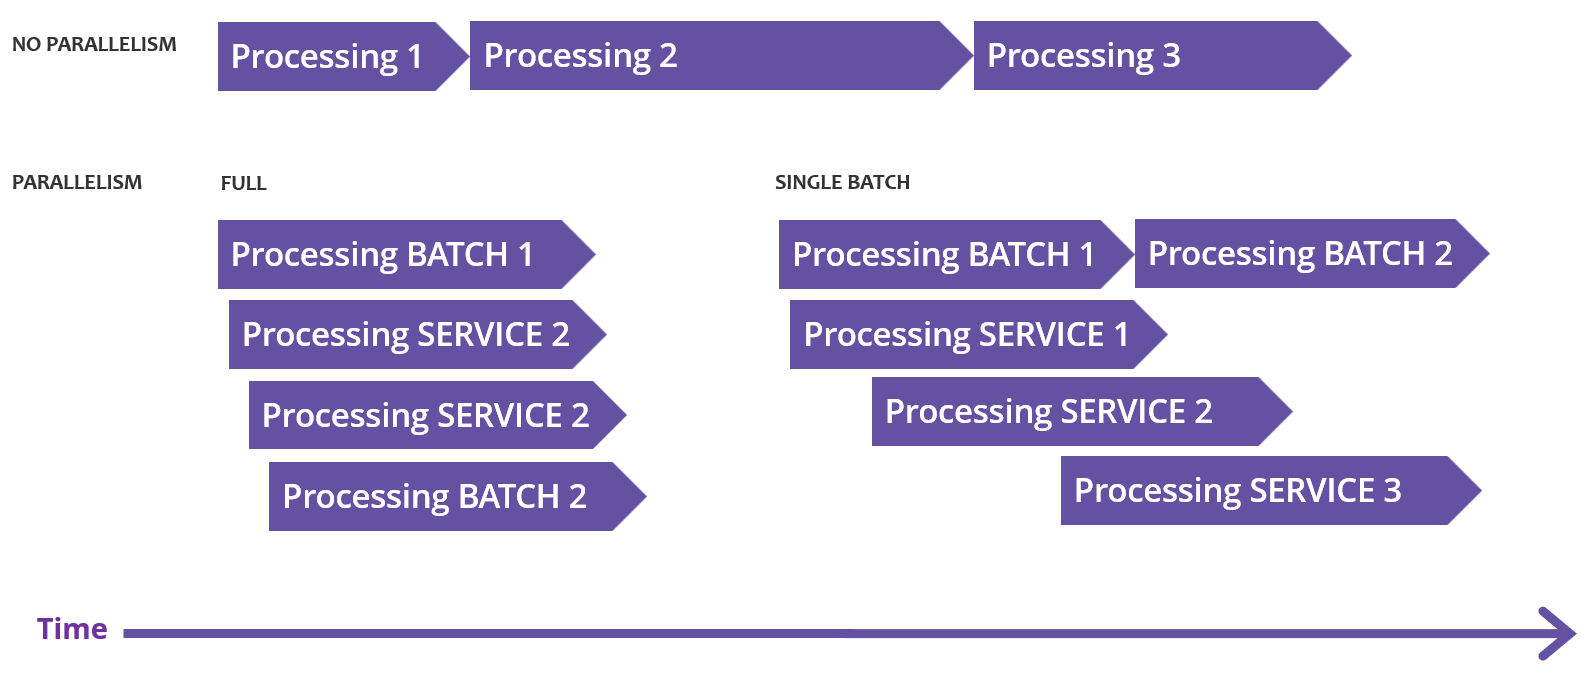
This setting determines the number of jobs of a given type that can run concurrently. By default, parallelism is disabled, which is suitable for batch-oriented, analytical solutions where no modifications are made using MDM Web App.
For most other scenarios, we recommend using a single batch parallel strategy nme.parallel.strategy=single_batch.
This approach allows for processing service requests from MDM Web App and APIs while also handling streams, which are considered a type of online processing.
Currently, only one batch load can run.
Reprocessing is considered a type of batch processing.
We recommend scheduling these batches outside of business hours or dividing them into smaller chunks (microbatches) to minimize possible conflicts and restarts of the batch load, or using streams instead.
A full parallelism strategy is recommended only when the majority of traffic is through streams and APIs, and there are no long-running batch loads. Combining this strategy with large batches can lead to unpredictable job conflicts, subsequent restarts, and extended processing times.
Operation parallelism
Operation parallelism within each processing phase needs to be managed independently. There are three main areas that are always sequential:
-
Input data preparation
-
Master data consolidation
-
Committing
The next phase can start only after the previous one is completed. Each phase has a distinct method for setting up parallelism.
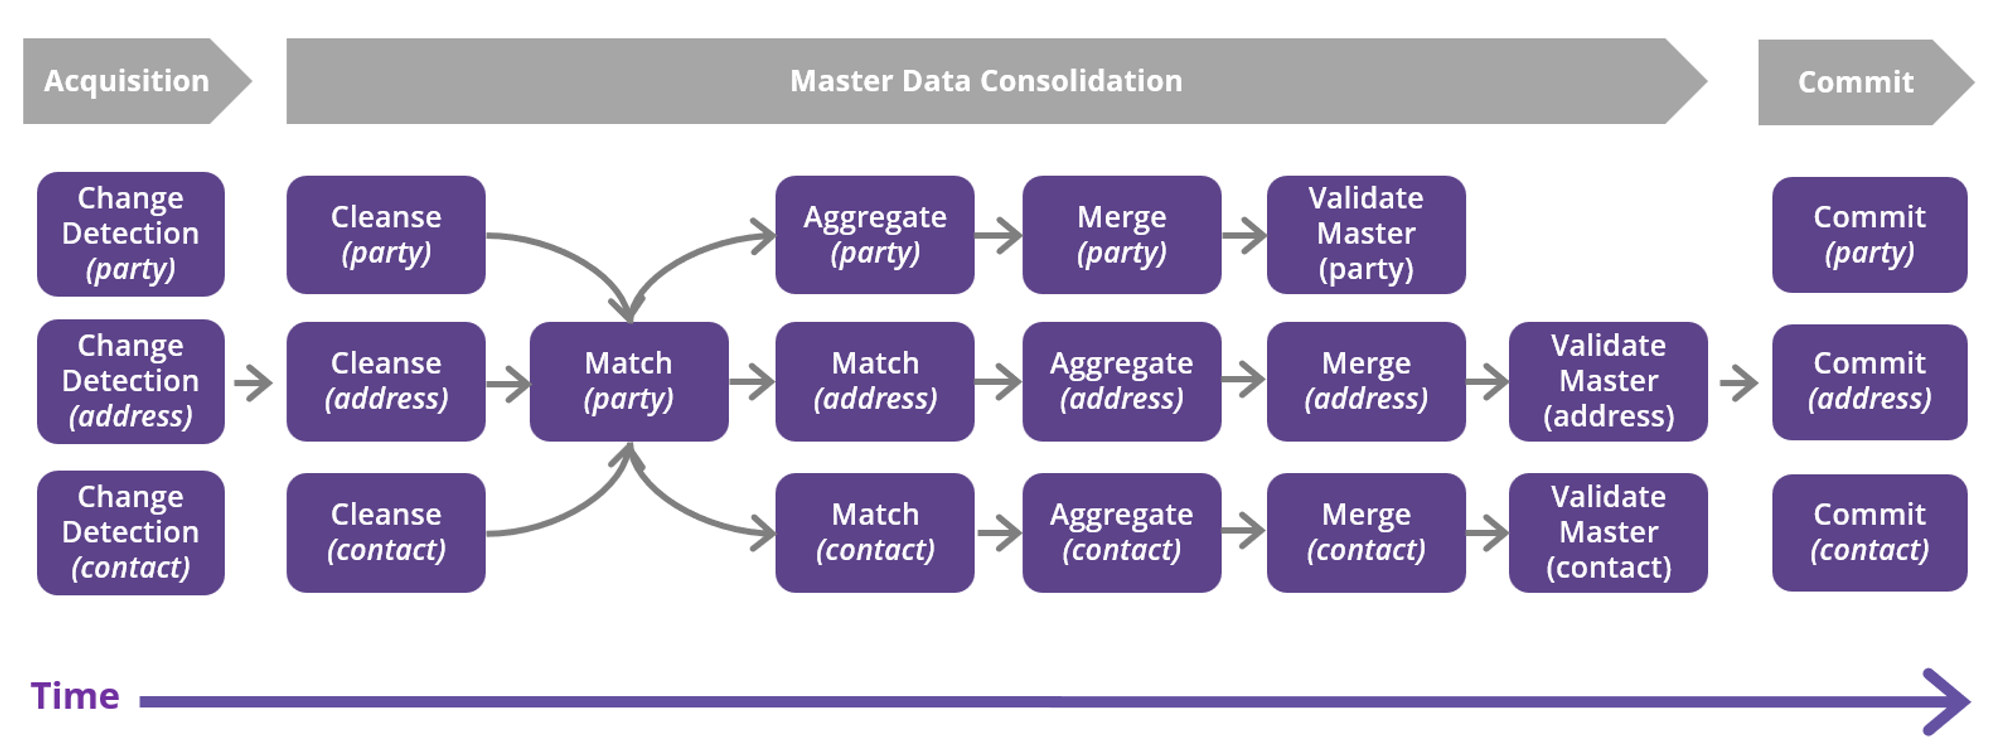
Input data preparation parallelism
This is a generic name for the phase in which MDM reads input data and generates a list of changes for further processing, if applicable. The specific name for this phase might vary depending on the type of data load. Performance optimization in MDM is applied only to batch loads, specifically in the subtasks called data acquisition and change detection.
Batch load parallelism
This phase applies to batch data loads.
It controls the number of entities for which the system detects changes (insert, update, delete, or no change) and generates a delta load for further processing.
You can set the level of parallelism using the nme.delta.parallel runtime parameter, see Runtime Parameters, section Performance.
Keep in mind that this operation is typically database-intensive. Increasing parallelism will result in a higher load on the database.
Master data consolidation parallelism
Start with consolidation parallelism, allowing individual operations (subtasks) to run in parallel if constraints allow.
Consolidation parallelism can be configured using the nme.consolidation.parallel runtime parameter.
Keep in mind that the described parallelisms multiply with the consolidation parallelism.
In service-oriented MDM setups where only a small group of input records is processed, parallelism might not provide any performance benefit.
You can define a threshold to avoid parallelism for small transactions using the nme.consolidation.parallel.threshold parameter.
If the number of records is below the defined threshold, the system will ignore the parallel settings.
For more information, see Runtime Parameters, section Performance.
Cleanse and master validation operation
For a low number of entities or underutilized hardware, increase cleanse or validate parallelism.
To configure it, use the nme.clean.parallelism and nme.validate.parallelism runtime parameters.
See Runtime Parameters, section Performance.
Typically, plan step parallelism is unnecessary despite being available as a standard option.
Matching
Typically, a central matching entity (for example, Party, Customer, Vendor, Patient) is processed as a single entity. Configure matching parallelism only for this central entity, because it usually runs standalone. Related or secondary matching plans generally run in parallel due to consolidation parallelism and do not require additional internal parallelism unless hardware is underutilized.
For more information, see Matching step performance tuning.
Operation plan optimization
This fine-tuning option optimizes the order of individual operations, their interference, and shortens processing time.
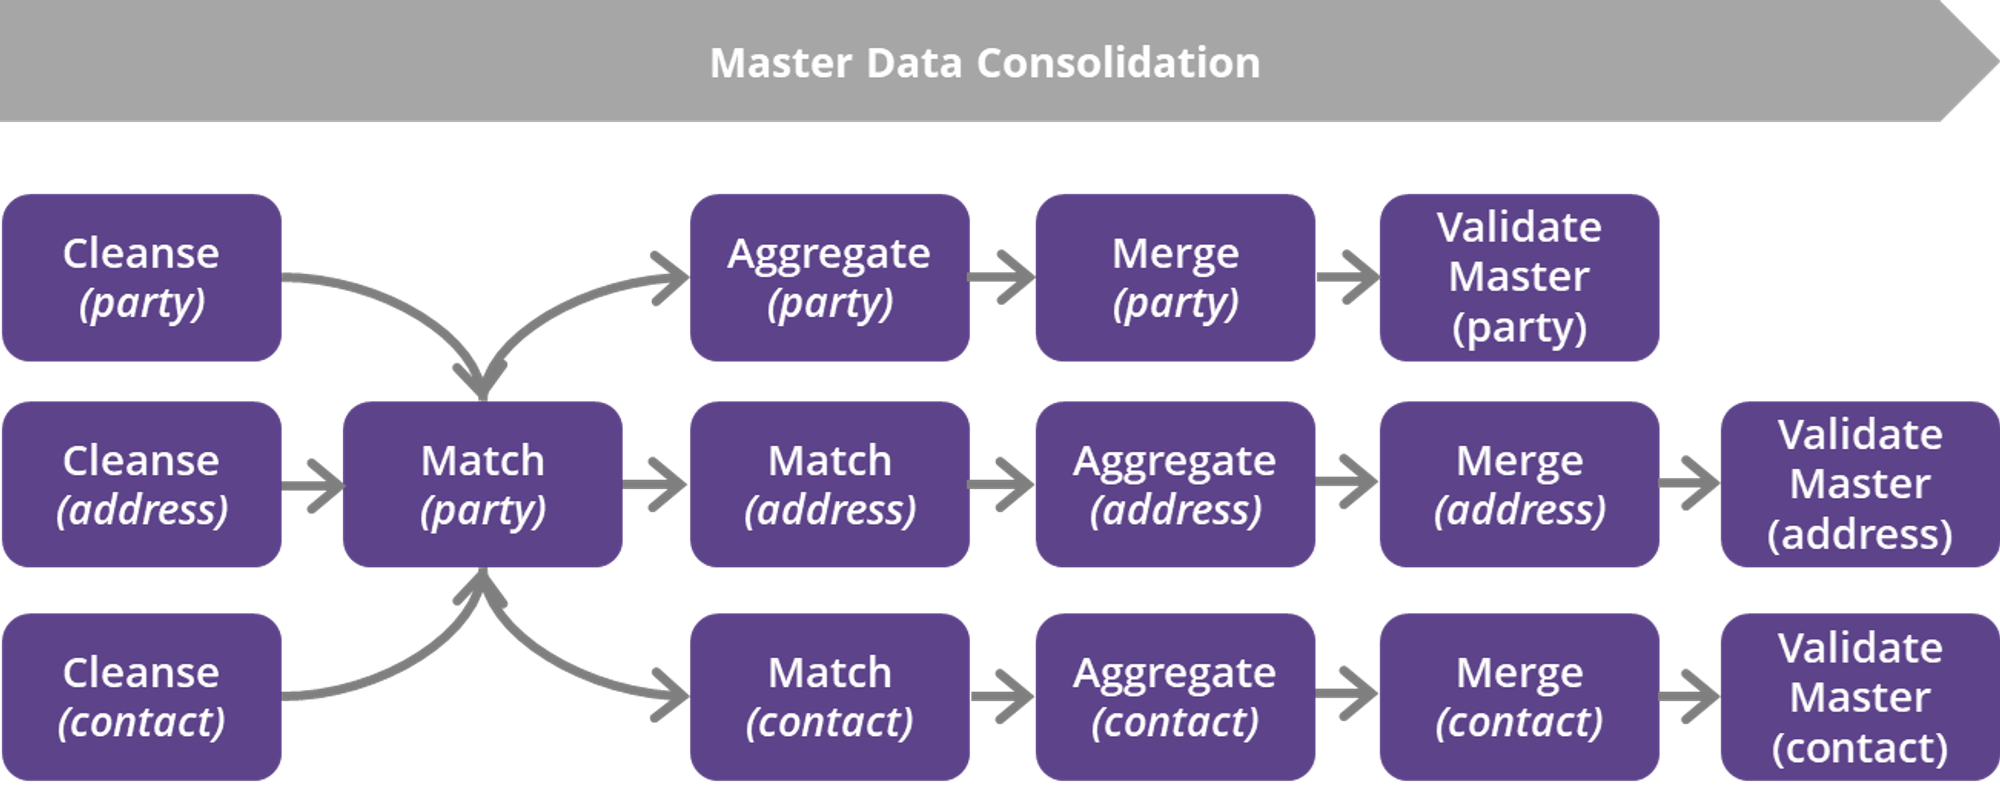
For optimal performance, order the operations or subtasks by:
-
Operation type: cleansing, matching of the gold (central) matching entity, related matchings, aggregate, merge, master validation.
-
Data volume and complexity, prioritizing the most time-consuming operations.
Consider operation plan constraints. If the data model has more independent parts, start with the largest one. Place the cleansing of smaller parts around the matching of the largest part.
For more information, see Operation Plan.
Committing parallelism
For a low number of entities or underutilized hardware, increase the number of workers per entity. If there are more workers than entities, use elastic assignment of workers based on data volumes.
Committing parallelism can be configured using the nme.commit.parallel runtime parameter, see Runtime Parameters, section Performance.
Keep in mind that this operation is typically database-intensive. Increasing parallelism will result in a higher load on the database.
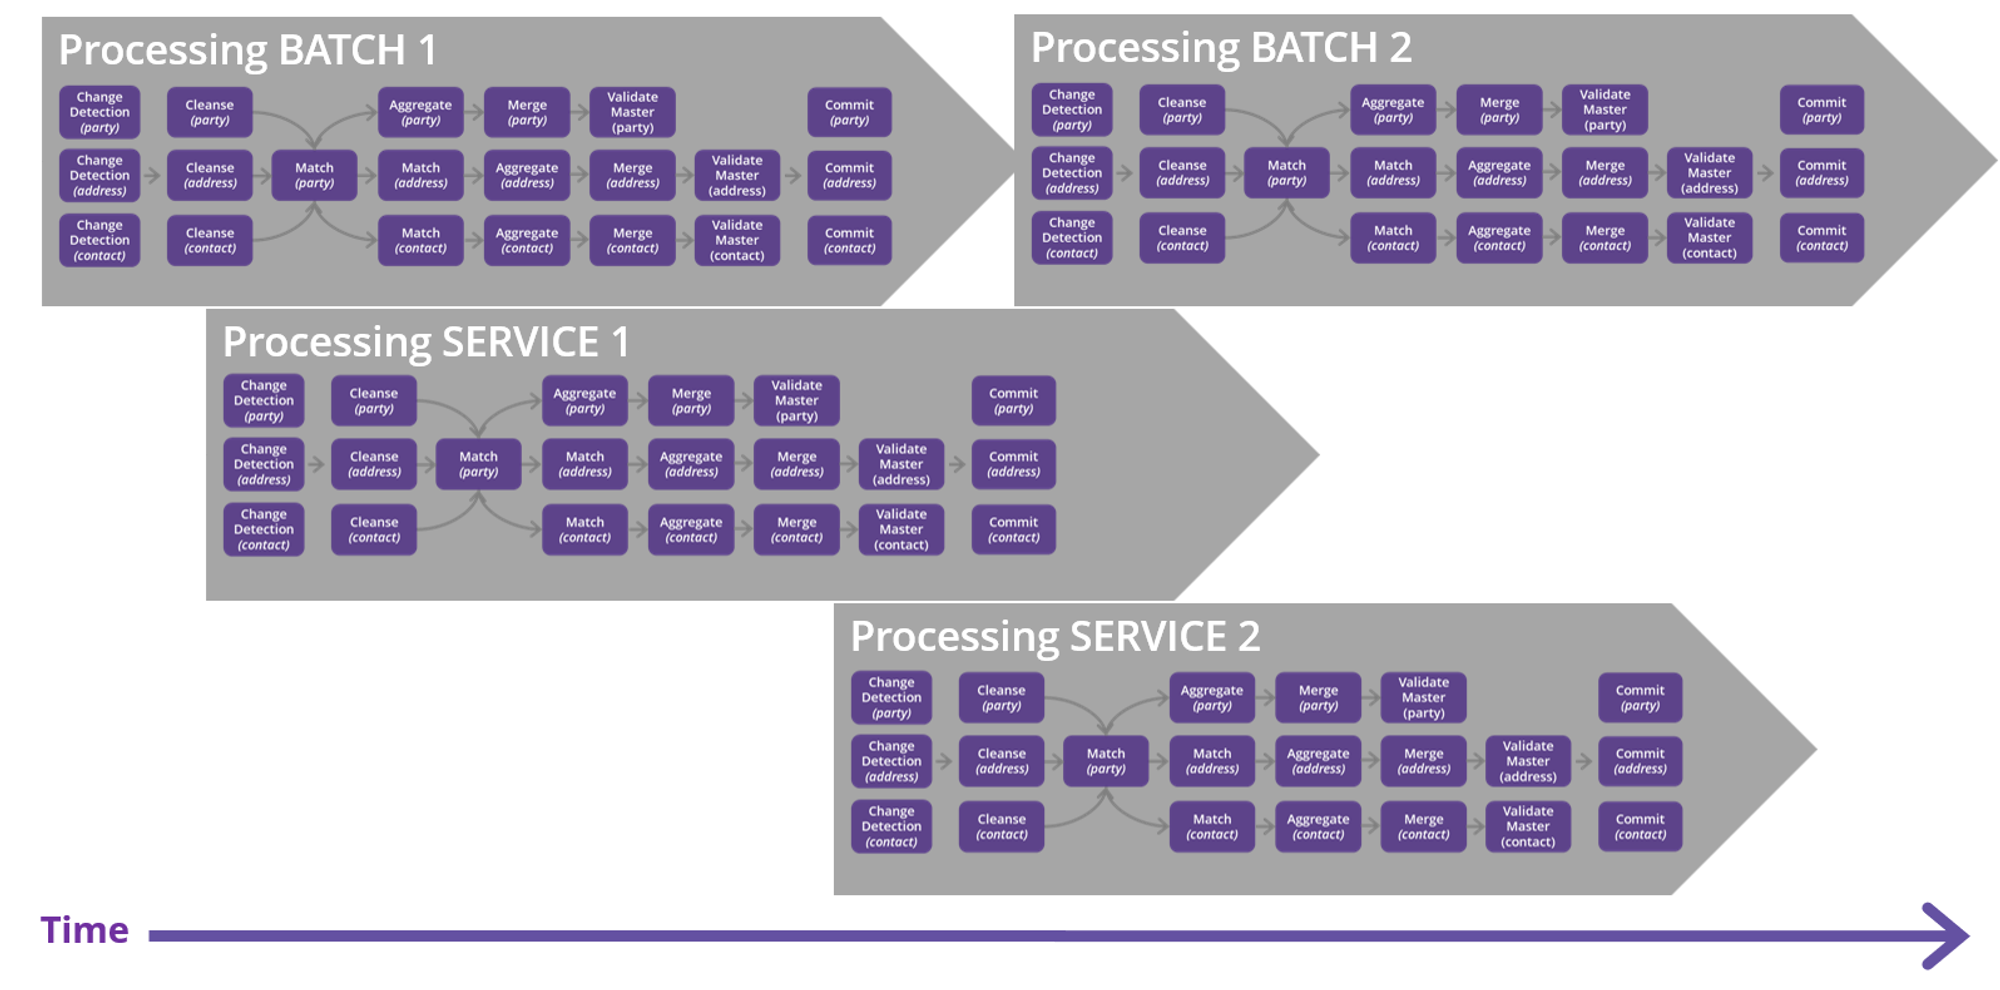
Overall parallelism settings
Align parallelism settings with the number of available CPU cores, typically not exceeding 8-12. Be aware that during consolidation and committing phases, enforcing parallelism among entities and within entities is highly resource-demanding (especially the application server and database for committing), particularly when parallelism on each entity is enabled (not depicted in the schema below).
JVM parameters
The most relevant Java Virtual Machine (JVM) settings are described in JVM Configuration.
|
XMX memory settings
MDM uses both heap space (XMX memory) and non-heap space. The size of XMX memory should not exceed 70% of physical memory. Do not use |
MDM Server performance tuning
For the list of various parameters that influence the performance of MDM Server, see Runtime Parameters.
To use some of these parameters, define them in the runtime properties file, as in the following example.
For settings that are rarely modified, such as SMTP SSL flags or global JVM flags, you can add them as a Java parameter (for example, -Dnme.copyColumns.skipUnchanged=true).
The values of runtime parameters set during the engine startup are available in the Admin Center under Runtime Parameters (see MD Process Monitoring, section Runtime parameters).
...
nme.parallel.strategy=single_batch
nme.delta.parallel=4
nme.consolidation.parallel=4
nme.commit.trimTooLongStrings=true
...
Runtime and steps performance tuning
It is possible to pass various runtime parameters in bulk in a runtime properties file or create a performance file for any plan.
In case of MDM, take note of the specific parameters used to configure parallelism of the Matching step, as described in the following section.
Matching step performance tuning
The Matching step can have the parallelism set on three levels—partition, key, and matching rule—with the following parameters:
-
mduPartitionParallelism: Partitions defined in the Matching step are processed in parallel. -
mduKeyParallelism: Key rules defined within each partition are processed in parallel. -
mduMatchParallelism: Matching rules defined within each key rule are processed in parallel.
Allowed values:
-
0 - Parallelism disabled (default).
-
1 - Parallelism enabled.
...
mduPartitionParallelism=1
mduKeyParallelism=1
mduMatchParallelism=1
...|
Once the parallelism is enabled, it is the actual number of Partitions, Key Rules, and Match Rules in the Matching step configuration that determines the resulting level of parallelism. For example, if there are two partitions, five keys, and ten matching rules configured, and the parallelism is set on all 3 levels, as in the example settings (with all 3 parameters set to 1), the overall parallelism will require 100 threads. |
Setting parallelism on step level
While it is possible to specify a global parallelism value that will be used by any Matching step, it is also possible to specify each parallelism setting separately for each Matching step with a specific notation.
For example, the following setting will be applied only on the Matching step whose ID is Party Matching.
Party\ Matching.mduPartitionParallelism=1|
Spaces must be escaped using a backward slash ( To avoid escaping, you can use underscores in the |
It is also possible to combine both global and step-specific settings.
...
### Global Matching Parallelism Settings ###
mduPartitionParallelism=1
mduKeyParallelism=0
mduMatchParallelism=0
...
### Party Matching ###
Party\ Matching.mduPartitionParallelism=1
Party\ Matching.mduKeyParallelism=1
Party\ Matching.mduMatchParallelism=1
MDM database performance tuning
| We recommend using PostgreSQL database as the storage for MDM. Oracle and MS SQL databases are supported, however, no further enhancements will be made for these platforms starting from version 16. |
PostgreSQL
Certain parameters for PostgreSQL databases can be configured in the MDM Server application.properties file, see MDM Server Application Properties, section Database Performance.
Oracle and MS SQL
MDM allows hinting for all SQL queries used internally.
SQL queries are available in the <ONE_HOME>/vldb-commands_<DB>.xml and the file is referenced in the MDM configuration file.
Currently, only Oracle hints are pre-prepared: see the vldb-commands_oracle.xml file.
| The ability to hint database queries was previously implemented using the runtime parameters. This method still works without any manual interventions. |
MDM database settings
Amazon Aurora PostgreSQL configuration
If the apg_plan_mgmt extension is enabled, set the apg_plan_mgmt.use_plan_baselines to false.
Any other configuration should be confirmed by your database administrator.
Persistence layer debug logging
Logging for persistence layer SELECT operations can be set up in the MDM Server application.properties file (see MDM Server Application Properties, section Logging):
logging.level.com.ataccama.mdm.persistence=INFO
ataccama.one.mdm.db.logging.enabled=true
ataccama.one.mdm.db.logging.long-running-operation=10s
ataccama.one.mdm.db.logging.show-parameters=false
If you want to log all operations, set the value of the ataccama.one.mdm.db.logging.long-running-operation to -1s.
|
Query tuning
| Query tuning is only available for PostgreSQL databases. |
MDM Web App allows you to monitor and optimize performance of SQL queries from the MDM Web App Admin Center by downloading the CSV file containing performance settings and adjusting it as needed.
To identify a specific SQL query, the selector is used. It typically includes multiple fields, some of which might remain unfilled. When a more detailed selector is defined, it takes priority over a less specific one.
The selector includes the following fields:
-
callId: Typically, the call identifier within the application code, often in the format
<ClassName>.<MethodName>. -
planFilename: The name of the plan file if the query originates from a specific execution plan or file.
-
layer: The persistence layer name relevant to the SQL query, if applicable.
-
instanceEntity: The name of the instance entity if the query relates to a specific instance entity in the application.
-
masterEntity: The name of the master entity if the query is associated with a master entity in the application.
A sample CSV file looks as follows:
"layer";"callId";"planFilename";"masterEntity";"instanceEntity";"subselectOrder";"fetchSize";"inClause";"analyzeResults";"expectedDataSize"
"C_";"PlanMergingOperation.collectBatchOutput";"../engine/trans/rel_party2party/norm_rel_org_org_merge.comp";"rel_org_org.master.norm";"rel_party2party.instance";"ASC";;"OR";"false";"LARGE"
"C_";"NmeHistoryEventProc.loadValidFromRecords";;;;;;"OR";"false";"LARGE"
"C_";"PlanMergingOperation.collectBatchOutput";"../engine/trans/provider_credentials/provider_provider_credentials_merge.comp";"provider_credentials.master.provider";"provider_credentials.instance";"ASC";;"OR";"false";"LARGE"
"C_";"PlanMergingOperation.deleteEmptyGroups";;;;;;"OR";"false";"LARGE"
"C_";"NmeModelStatistics.sumAndCleanup";;;;;;"OR";"false";"SMALL"
"C_";"NmeInstanceAccessor.createUnorderedInList.2";;;"party";;;"OR";"false";"SMALL"
"C_";"FullLoadBatchProc.processEntity";;;;"ASC";;"OR";"false";"LARGE"
"C_";"PlanMergingOperation.collectBatchOutput";"../engine/trans/party/norm_person_merge.comp";"person.master.norm";"party.instance";"ASC";;"OR";"false";"LARGE"
"C_";"VldbTableAccessor.findFirst";;;;;;"OR";"false";"SMALL"
"C_";"MduAccessor.addOldKeys";;;;;;"OR";"false";"LARGE"
"C_";"PlanMergingOperation.insertBatchRecords";;;;;;"OR";"false";"LARGE"
"C_";"PlanMergingOperation.collectBatchOutput";"../engine/trans/party/provider_party_merge.comp";"party.master.provider";"party.instance";"ASC";;"OR";"false";"LARGE"
"C_";"MduAccessorBase.fetchMasterRecords";;;;;;"OR";"false";"LARGE"
"C_";"MduMasterMatchingOperation.recalculateDuplicateIds";;;;;;"OR";"false";"LARGE"
Some of possible optimization settings include:
-
Insert sorting into subqueries: Sorts subquery results for improved performance.
-
Set fetch size: Controls the number of rows retrieved at once, impacting the performance.
-
Change the expected data size: Adjusts the estimated data size.
Query tuning parameters are stored in a database table named querytunning.
To define the data source for this table, use the ataccama.one.mdm.performance.datasource property.
Data is loaded from this table during application startup and saved when new calls are registered. Keep in mind that manual changes to this table might be overwritten during runtime.
Query tuning parameters can be exported and imported into a CSV file, enabling easy modifications and sharing across different application installations.
Database statistics
This component monitors and records statistics for each SQL query used in the application. The statistics include the following:
-
Total Time: The cumulative time spent executing this query.
-
Min Time: The shortest duration for the query execution.
-
Max Time: The longest execution time for the query execution.
-
Request Count: The number of times the query was executed.
-
Last Finished Time: The date and time of the most recent completed execution.
-
Last Unfinished Time: The date and time of the last incomplete execution.
-
Completion Time: The date and time when the SQL query was finished.
A sample statistics CSV file looks as follows:
"layer";"callId";"planFilename";"masterEntity";"instanceEntity";"totalTime";"minTime";"maxTime";"requestCount";"lastFinishedCallTime";"lastUnfinishedCallTime"
"C_";"NmeModelStatistics.getInstanceStatistics";;;;"4";"0";"3";"2";"2023-09-20T11:10:32.142115612Z";"2023-09-20T11:10:32.139954465Z"
"C_";"VldbUnorderedResultIteratorDirect.ensureNextRecord";;;;"0";"0";"0";"0";;"2023-09-20T11:10:33.917376469Z"
"C_";"NmeModelStatistics.sumAndCleanup";;;;"7";"0";"7";"1";"2023-09-20T11:06:29.523252194Z";"2023-09-20T11:06:29.516591436Z"
"C_";"VldbTableAccessor.findFirst";;;;"10";"0";"2";"21";"2023-09-20T11:10:33.654213860Z";"2023-09-20T11:10:33.654027005Z"
Statistics are stored in a dedicated table called sqlcallstatistic.
To define the data source for this table, use the ataccama.one.mdm.performance.datasource property (see MDM Server Application Properties, section Database Performance.
The statistics are updated every 20 seconds, providing real-time query performance monitoring.
To facilitate query performance analysis, you can export these statistics to a CSV file using the designated endpoint /api/performance/statistic/download to facilitate query performance analysis.
Was this page useful?