
DQ Monitors
DQ monitors control how DQ evaluation and profiling operate for catalog items, and display their processing progress and results. They determine which rules are applied, how processing runs and when it executes.
Each catalog item can have one or multiple DQ monitors to support different use cases, such as testing different rule combinations or running evaluations at different frequencies.
Where to find DQ monitors
To see all configured monitors:
-
Navigate to Data quality > Monitors in the left navigation menu.
-
Select a monitor to open it.
| Use search to find monitors by name. |
To find monitors for a specific catalog item:
-
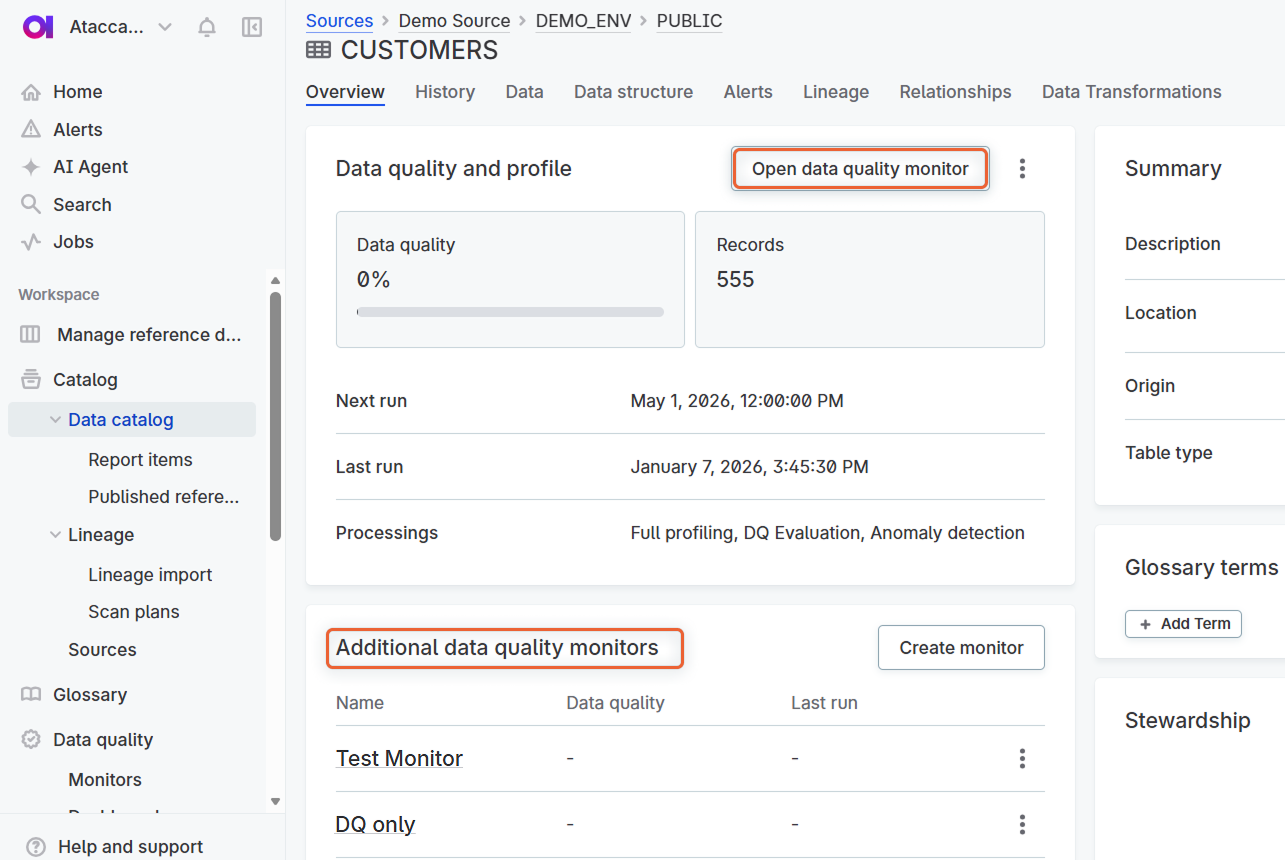
Open the catalog item Overview tab.
-
Select Open DQ monitor in the Data quality and profile widget.
If there are multiple monitors, see them in the Additional DQ monitors widget.
What DQ monitor displays
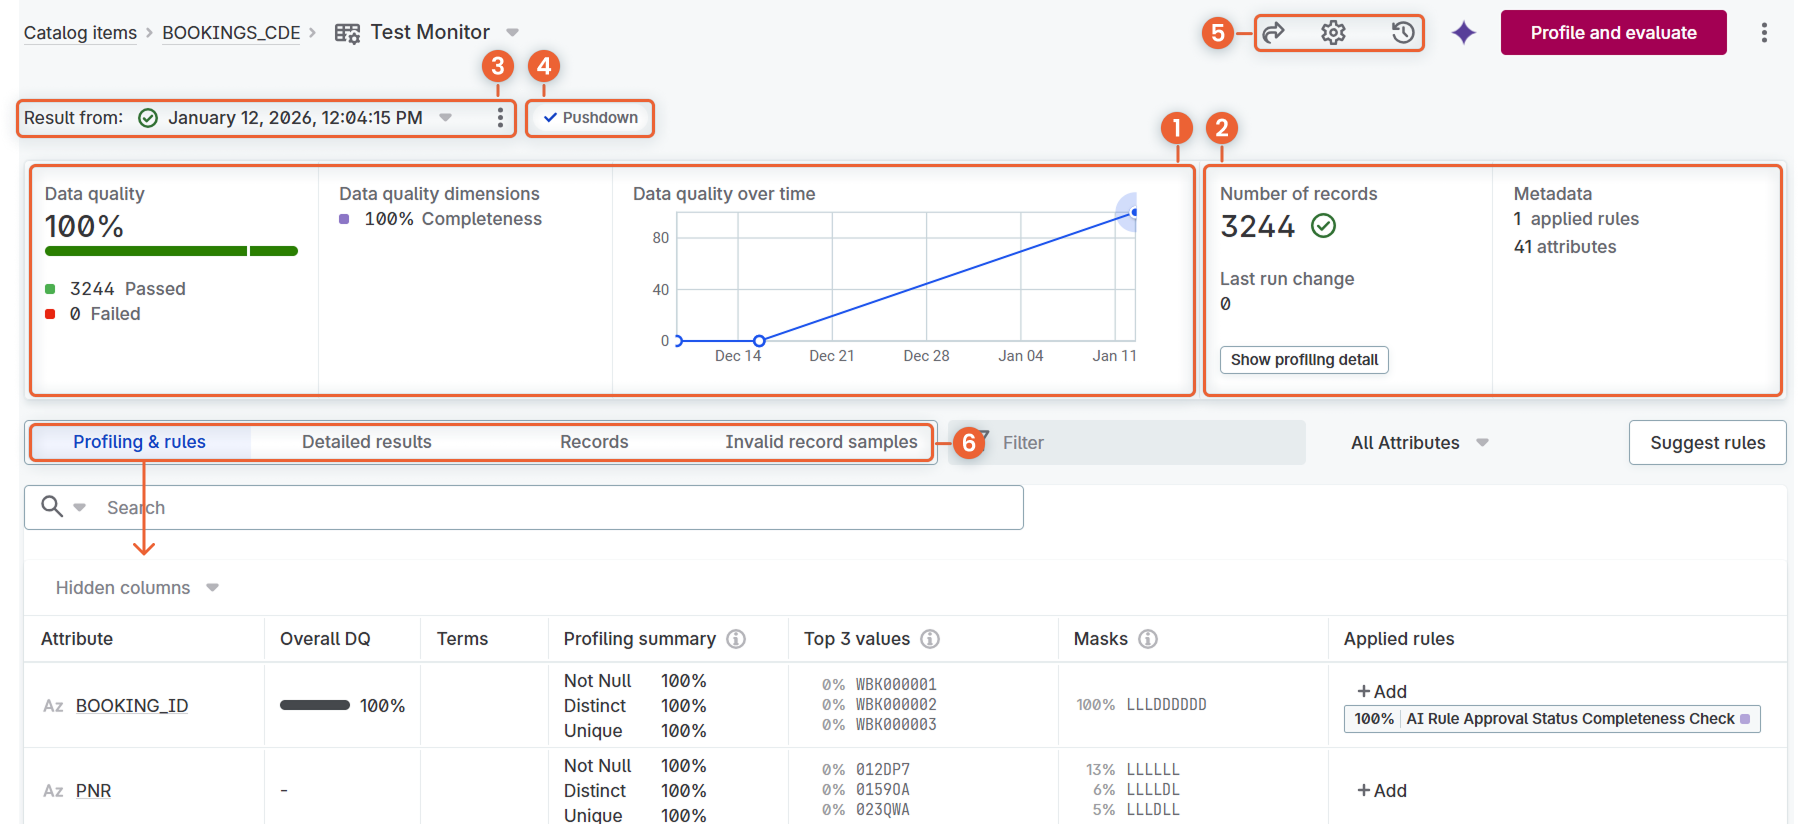
The monitor summary displays at-a-glance information and provides access to settings:
-
(1) DQ evaluation results: Overall data quality, passed and failed records, and quality trend over time. Visible after DQ evaluation runs.
-
(2) Monitor overview: Catalog item metrics (number of records and attributes), number of rules applied in this monitor, and a list of Data Quality Dashboards containing this monitor.
-
(3) Result from: View results from previous runs.
-
(4) Pushdown: Visible when pushdown processing is enabled on the source.
-
(5) Header icons:
-
Share: Share the monitor with other users.
-
Settings: Configure DQ evaluation, profiling, scheduling, invalid samples collection, and other processing options for this monitor.
-
History: View and restore previous monitor versions.
-
The monitor tabs (6) let you work with different aspects of your data:
-
Profiling & rules: View profiling results and apply DQ rules to attributes.
-
Detailed results: View DQ evaluation results and analyze data quality issues.
-
Records: View a sample of catalog item data.
-
Invalid records samples: View samples of invalid records (if configured).
Configure DQ monitor
| After making any changes, publish the monitor to make them effective. |
Select the Settings icon (gear) in the monitor header. You can configure:
-
Processing settings: Enable or disable DQ evaluation and profiling, set thresholds, and configure anomaly detection.
-
Scheduling: Automate regular runs of DQ evaluation and profiling.
-
Invalid samples: Collect examples of records that fail data quality checks.
-
Export of invalid records: Export failed records for further analysis or remediation.
If you enable DQ evaluation, also Apply DQ rules to catalog item attributes. Rules are applied only within this monitor.
Most monitors include both DQ evaluation and profiling. However, you can create specialized monitors that run only one of these processes for specific use cases.
Apply DQ rules
To apply DQ rules to attributes:
-
Go to the Profiling & rules tab.
-
Decide which DQ rules you want to apply:
You can do this based on:
-
Profiling results on the monitor Profiling & rules tab.
For example, if an attribute email frequently appears in an incorrect format, select a rule to validate that the email is in the correct format.
-
Rule suggestions:
-
(1) AI suggestions: Select Suggest rules in the Apply data quality rules widget to get rules recommended by the AI agent.
-
(2) Suggestions based on profiling results: Select Suggest rules on the Profiling & rules tab.
-
-
-
Apply rules to attributes:
-
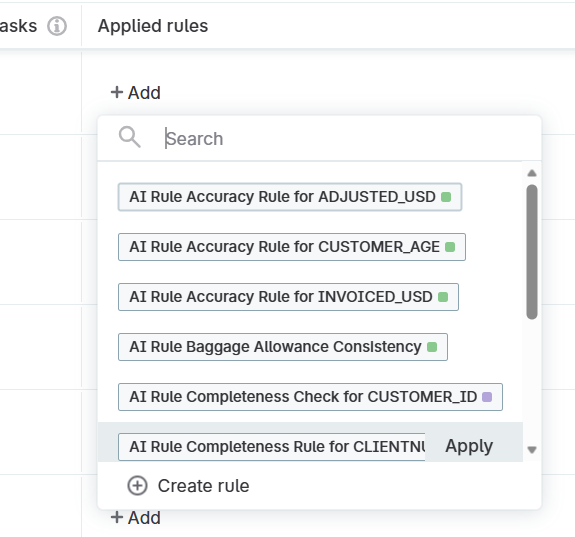
In the attribute list, select Add in the Applied Rules column. A dialog opens, showing all available rules.
Rules are filtered by the attribute’s data type: you can only see rules with the matching input data type.
-
Select Apply Rule next to each rule you want to use.
-
If the rule you need does not exist, you can create it. Select Create Rule and follow the instructions in DQ Rules.
-
Processing settings
Configure how DQ evaluation and profiling run for this monitor.
You can use the following settings:
-
DQ Evaluation: Enable DQ evaluation for this monitor.
-
Set DQ Threshold: Define acceptable levels for your data quality results. Results below this percentage are considered Critical and trigger alerts. Results at or above this threshold are Valid. For more information, see DQ Thresholds.
-
Profiling: Enable profiling for this monitor. Select the profiling type:
-
FULL: Analyzes all data in the catalog item. Use for regular monitoring of catalog items important for your use case.
-
SAMPLE: Analyzes a subset of data. Useful for large tables.
-
Limit number of profiled rows: Define how many records to include in sample profiling. Rows are selected randomly if the database supports this functionality. Otherwise, the set number of rows is selected, starting from the first row.
-
-
-
Detect anomalies: Enable anomaly detection to identify potential inconsistencies in your data. Recommended when you have scheduled profiling runs and want to detect changes in data between the runs, or for easier interpretation of data with seasonality (predictable fluctuations in data, for example, during weekends or holidays). See Anomaly detection.
-
Use pushdown: Enable to evaluate data quality using pushdown processing. Only results and invalid samples (if configured) are sent to ONE.
If a DQ monitor contains a complex rule that is not supported in pushdown mode, the rule is grayed-out in the list of applied rules and skipped during evaluation.
In such situations:
-
(Recommended) Rewrite the rule to make it compatible with pushdown processing.
-
Consider disabling pushdown processing for this monitor.
-
Scheduling
Automate DQ evaluation and profiling by setting up a schedule. Regular scheduled runs help identify issues early and track results over time.
When determining frequency, consider:
-
Catalog item update frequency: For items updated daily, run daily; for weekly updates, schedule weekly. This ensures up-to-date results while saving resources.
-
Reporting needs: How often you need to create reports based on the catalog item.
-
Issue resolution: How often you need the data for issue resolution.
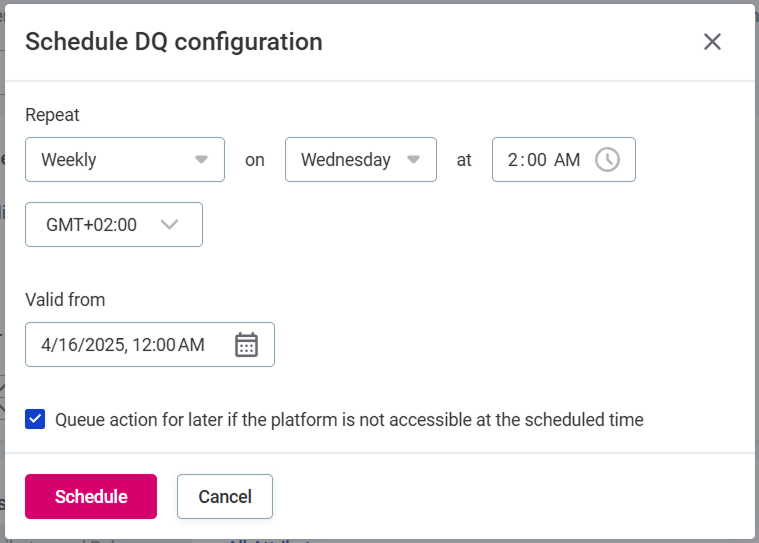
To configure a schedule:
-
Select Set schedule.
-
In Repeat, select how often the processes should run.
-
In At, specify the time and time zone.
-
If required, select Queue action for later if the platform is not accessible at the scheduled time.
-
In Valid from, define the start date.
-
Select Schedule to confirm.
Invalid samples
Select Collect invalid samples to save examples of records that fail data quality checks (recommended). These provide valuable insights into specific data issues.
You can view samples on the monitor Invalid records samples tab after running DQ evaluation.
|
To enable invalid samples collection for monitors, invalid samples must first be enabled globally in DQ retention settings. |
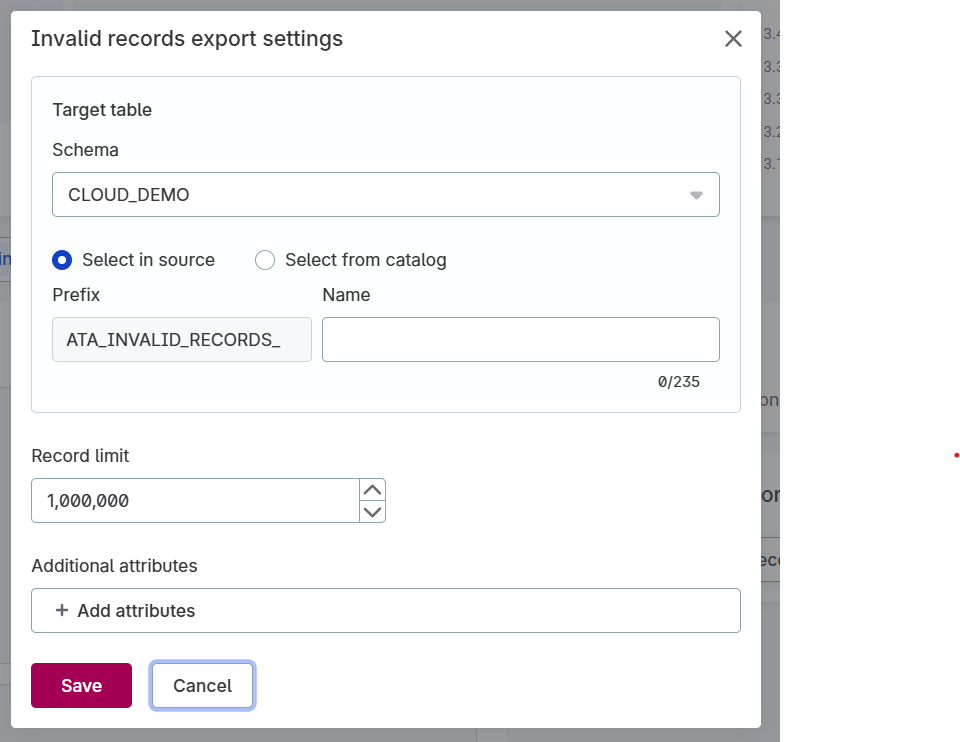
Export of invalid records
Export failed records for further analysis or remediation.
-
Select Set export of invalid records.
-
Configure the export settings. See export-invalid-records.adoc for details.
-
Select Save to confirm.
Set up multiple DQ monitors
Each catalog item has one primary (default) DQ monitor. In addition, you can create multiple secondary DQ monitors to:
-
Test different rule combinations.
-
Schedule different DQ evaluation frequencies for different use cases (for example, run sample profiling for daily monitoring and full profiling for monthly reports).
-
Run different types of profiling.
-
Share the monitor with specific privacy settings.
To create an additional monitor:
-
Open the catalog item.
-
In the Data quality and profile widget, select the three dots menu and then Create monitor.
-
Name the monitor and select Create to confirm.
Delete monitor
It is possible to delete only the secondary monitors.
To delete a DQ monitor:
-
Go to the monitor listing under Data quality > Monitors.
-
Select the monitors and Delete.
Alternatively, delete monitors for a specific catalog item:
-
Go to the monitor listing for catalog item in the Additional DQ monitors widget.
-
In the three dots menu, select Delete.
Next steps
After configuring the monitor, you’re ready to start analyzing your data:
-
Run your first analysis: Select Profile and Evaluate (or Profile, Evaluate, depending on your settings) in the monitor header.
-
Review results: Check DQ evaluation results for data quality metrics and profiling results for data structure and content.
-
Investigate issues: If problems are found, see Investigate DQ Issues.
Was this page useful?