
Bulk Profiling
The Bulk Profiling extension is useful for basic profiling of database sources that contain many tables.
Instead of configuring the analysis for each table separately, the extension allows you to import the data structures from the database dictionary and then automatically creates a profiling plan for each table. Finally, the tool creates an execution batch file that executes the individual plans.
The entire profiling process can be thus performed unattended, possibly overnight, or it can be executed at a given time using a task scheduler.
Create a bulk profiling project
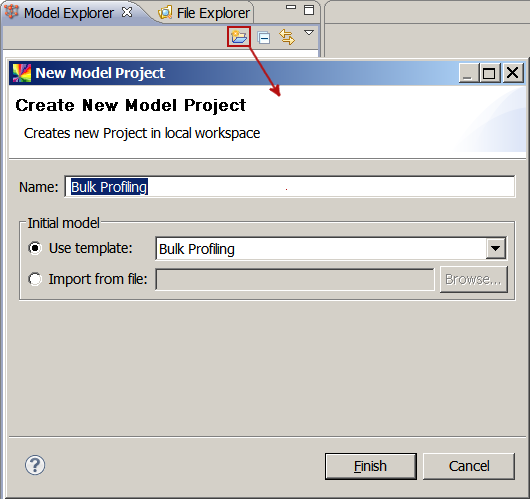
In the Model Explorer view, select New Model Project in the toolbar. Next, choose the Bulk Profiling model template and select Finish.
Set up a database connection
Switch to File Explorer view. Right-click the Databases and select New Database Connection.
In this case, we are connecting to an Oracle database. Use the Test Database Connection option to make sure that all parameters are filled in correctly. For more details, see Databases.
Note that drivers for some databases are not shipped with the product and have to be configured separately. For details, refer to Databases, section Install database connectivity drivers.
Import tables
Switch again to the Model Explorer view.
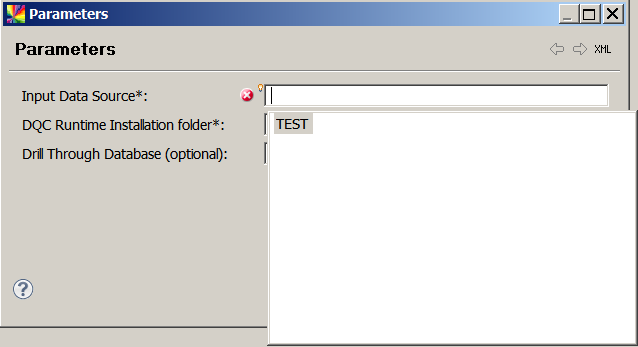
First, double-click the parameters node and select the data source to be profiled (that is, the database connection you have just created). If you want to store the drill-through information, choose the data source for that purpose.
Right-click the Tables node and select Import Database Metadata. Choose the tables that you want to profile.
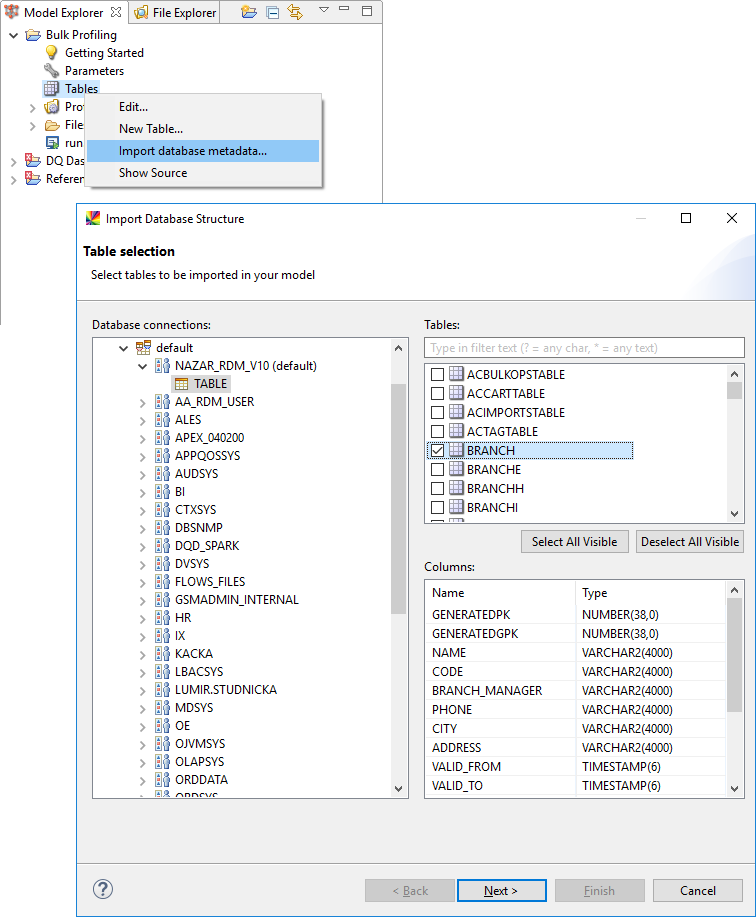
Next, select which columns should be imported.
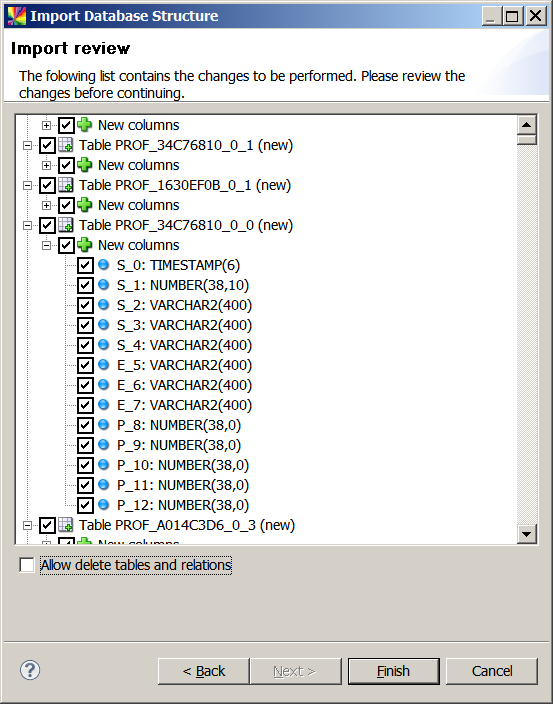
Select Finish.
Execute
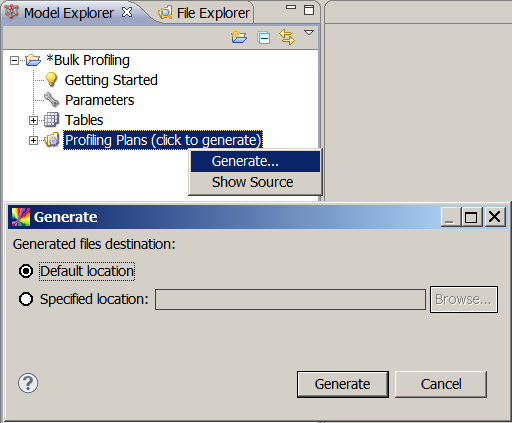
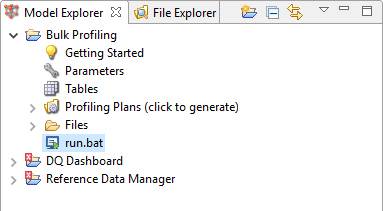
The previous step produced a folder Files, which contains the profiling plans, and a batch file run.bat, which runs the profiling plans.
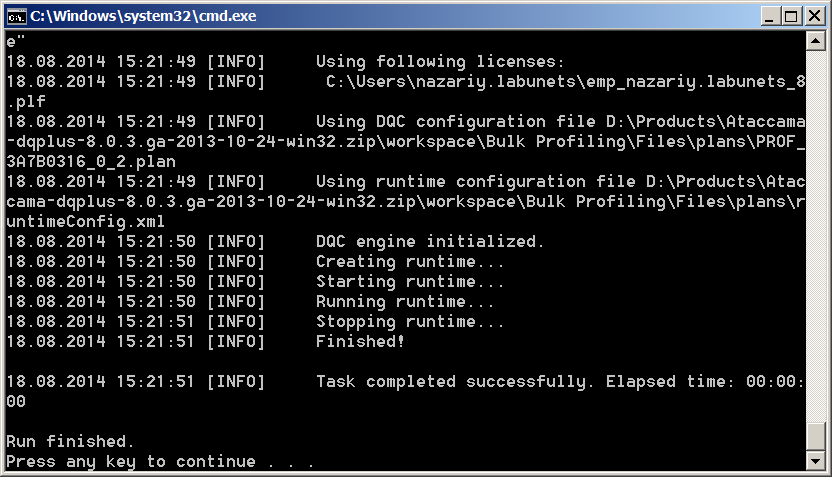
To execute the plans, double-click run.bat.
The profiling plans are run in a separate window. You can close the window once the run is complete.
You can also run the batch file from a command prompt or a task scheduler.
Browse results
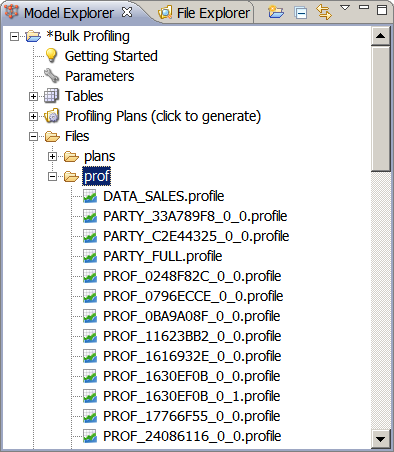
Once the run is finished, open the Files/prof folder and either press F5 or right-click and select Refresh.
This displays the computed profiles, which can be now viewed or exported as usual.
For more information about how to read profiles, see Read a Data Quality Profile.
Was this page useful?