
Monitoring Synchronization
Synchronization Monitoring is automatically enabled when you configure and deploy synchronization with external databases in RDM. For more information see Configuring Synchronization with External Databases.
Synchronization serves to propagate published data from the reference data repository to other company source systems or the data warehouse and optionally back to RDM.
Synchronization tab
You can monitor synchronization execution on the Synchronization tab of the Navigation Panel via two main nodes:
-
Process Runs: Each instance displays one occurrence of a synchronization process.
-
Processes: Lists all defined processes. A process can synchronize a single table or the whole source system, depending on the initial setting in the RDM application.
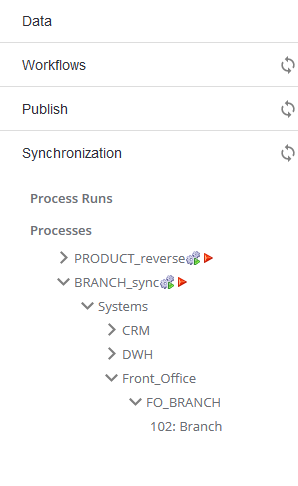
Synchronization indicators
There are two indicators used to track the outcome of synchronization processes.
The first indicator shows the state of synchronization processes, displayed by the following color-coded triangles that signal whether a process has been initiated:
-
Red triangle - The system is not synchronized: new records have been published in RDM since last synchronization.
-
Green triangle - The system is synchronized: no new records have been published in RDM since last synchronization.
The second indicator is applied to processes which have been already initiated and describes the result of the running (or finished) process:
-
Gear with a blue tick - Task has finished successfully.
-
Gear with a green triangle - Task is currently running and has not finished yet.
-
Gear with X - Task finished with an error. Error details are listed with the process details.
|
In the Processes node, the icons indicate process states as they are updated each time the process was run, therefore the indicators reflect the latest state only. In the Process Runs link, the icons display the state and result of every specific initiation of a given process. |
Each entry in the Process Runs link in the Navigation Panel represents an instance of a synchronization process of the same name. Process runs are listed in chronological order, displaying the latest instances at the top of the process runs list.
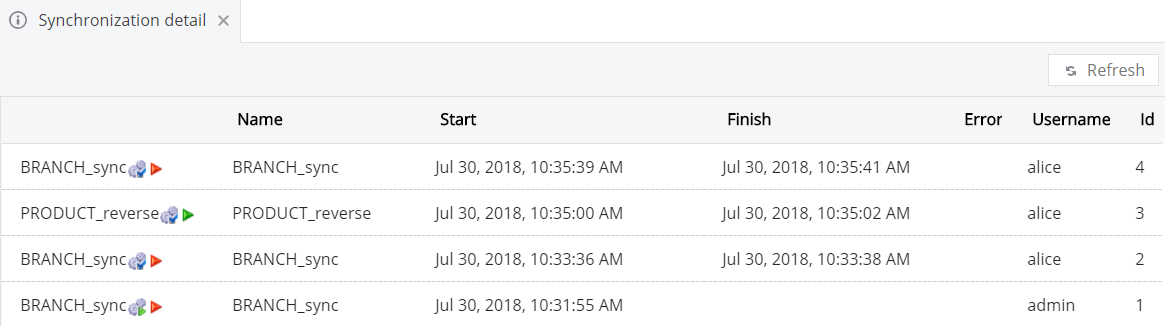
Browsing process runs details
To view the details of all process runs, select the Process Runs node.
A new tab opens in the Viewing Panel displaying a table that lists all process runs performed with the following fields:
-
Name - Process name.
-
Start - Date and time when the process was initiated.
-
Finish - Date and time when the process was terminated.
-
Error - Lists any errors that occurred during the synchronization process.
-
Username - Name of the user who initiated the process.
-
Id - Process instance ID.
| Double-clicking the Processes node instead opens the same table showing information about the latest process runs for each synchronization process. |
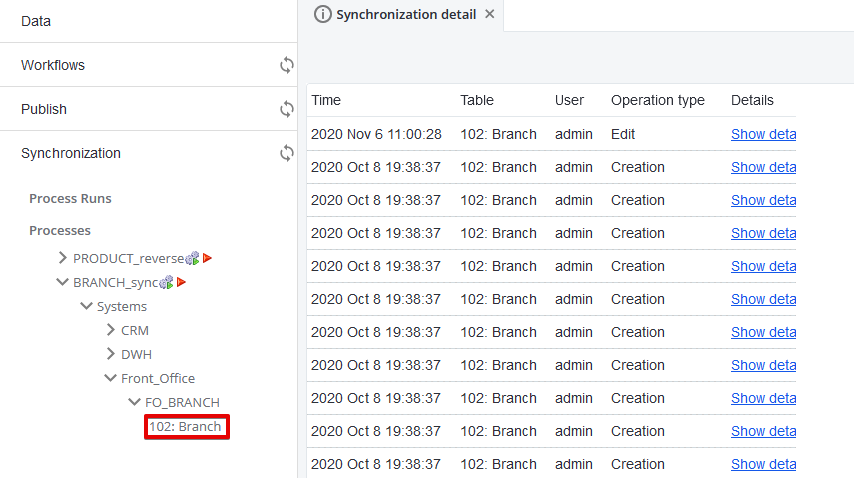
Viewing unsynchronized records
For processes that are marked as unsynchronized, it is possible to see the data changes which have not yet been propagated to the external system.
To do that, expand the Processes node to the last level containing RDM tables and select one of the tables. A new tab opens in the Viewing Panel displaying a table that lists all unsynchronized records.
Was this page useful?