Data Quality
There is no single definition of what makes data high quality: data quality is a measure of the condition of your data according to your needs. Evaluating data quality helps you identify issues in your dataset that need to be resolved.
In Ataccama ONE, you can define your needs and evaluate the data quality accordingly, using DQ evaluation rules.
How does it work?
The basic flow is as follows:
-
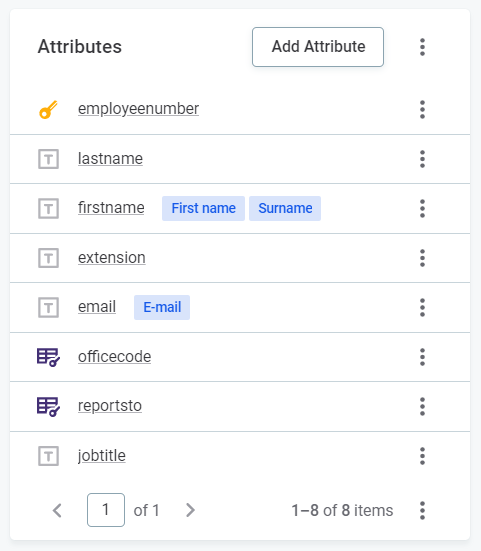
Terms from the glossary are assigned to catalog items through detection rules, AI, or manually.
-
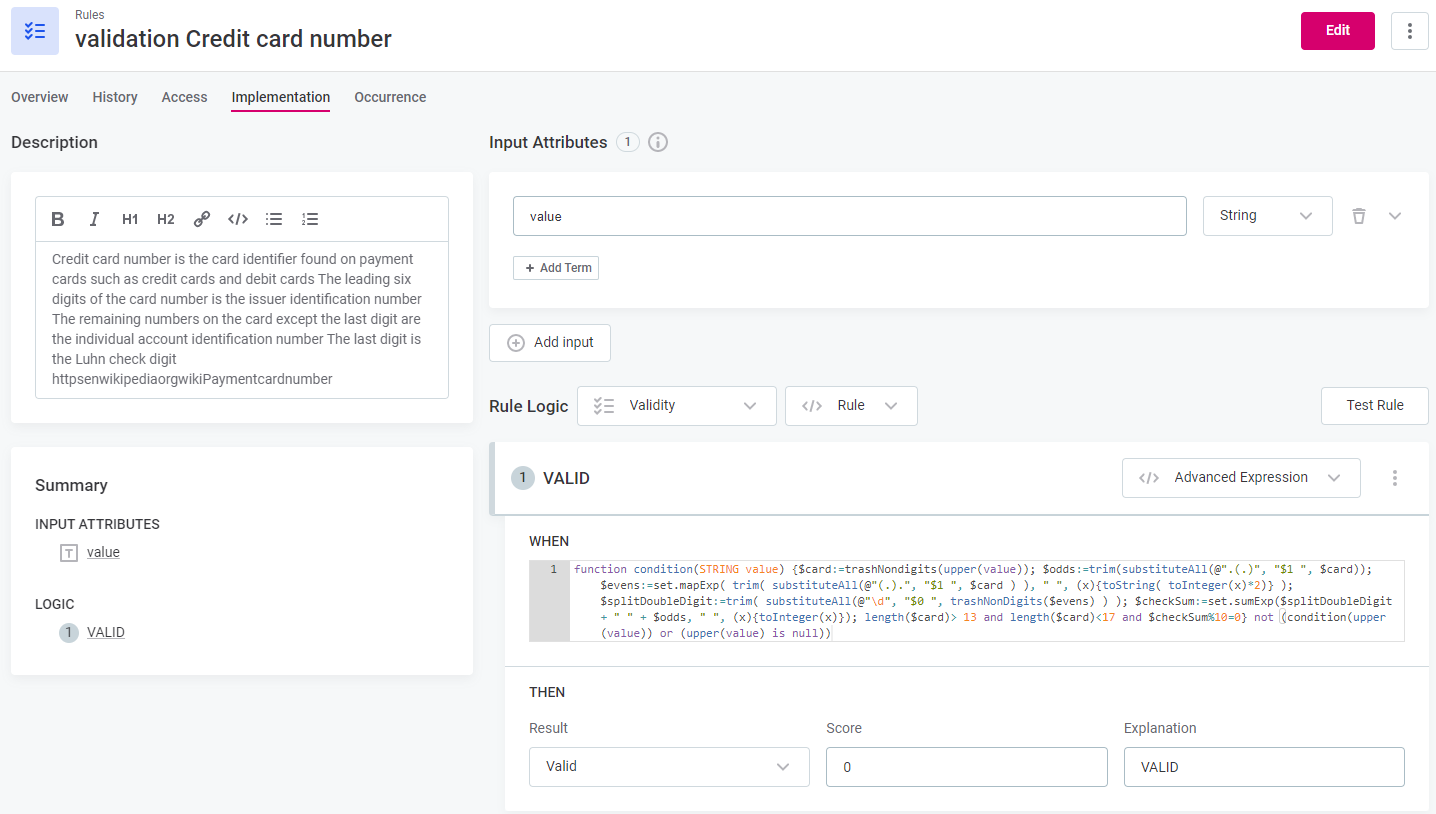
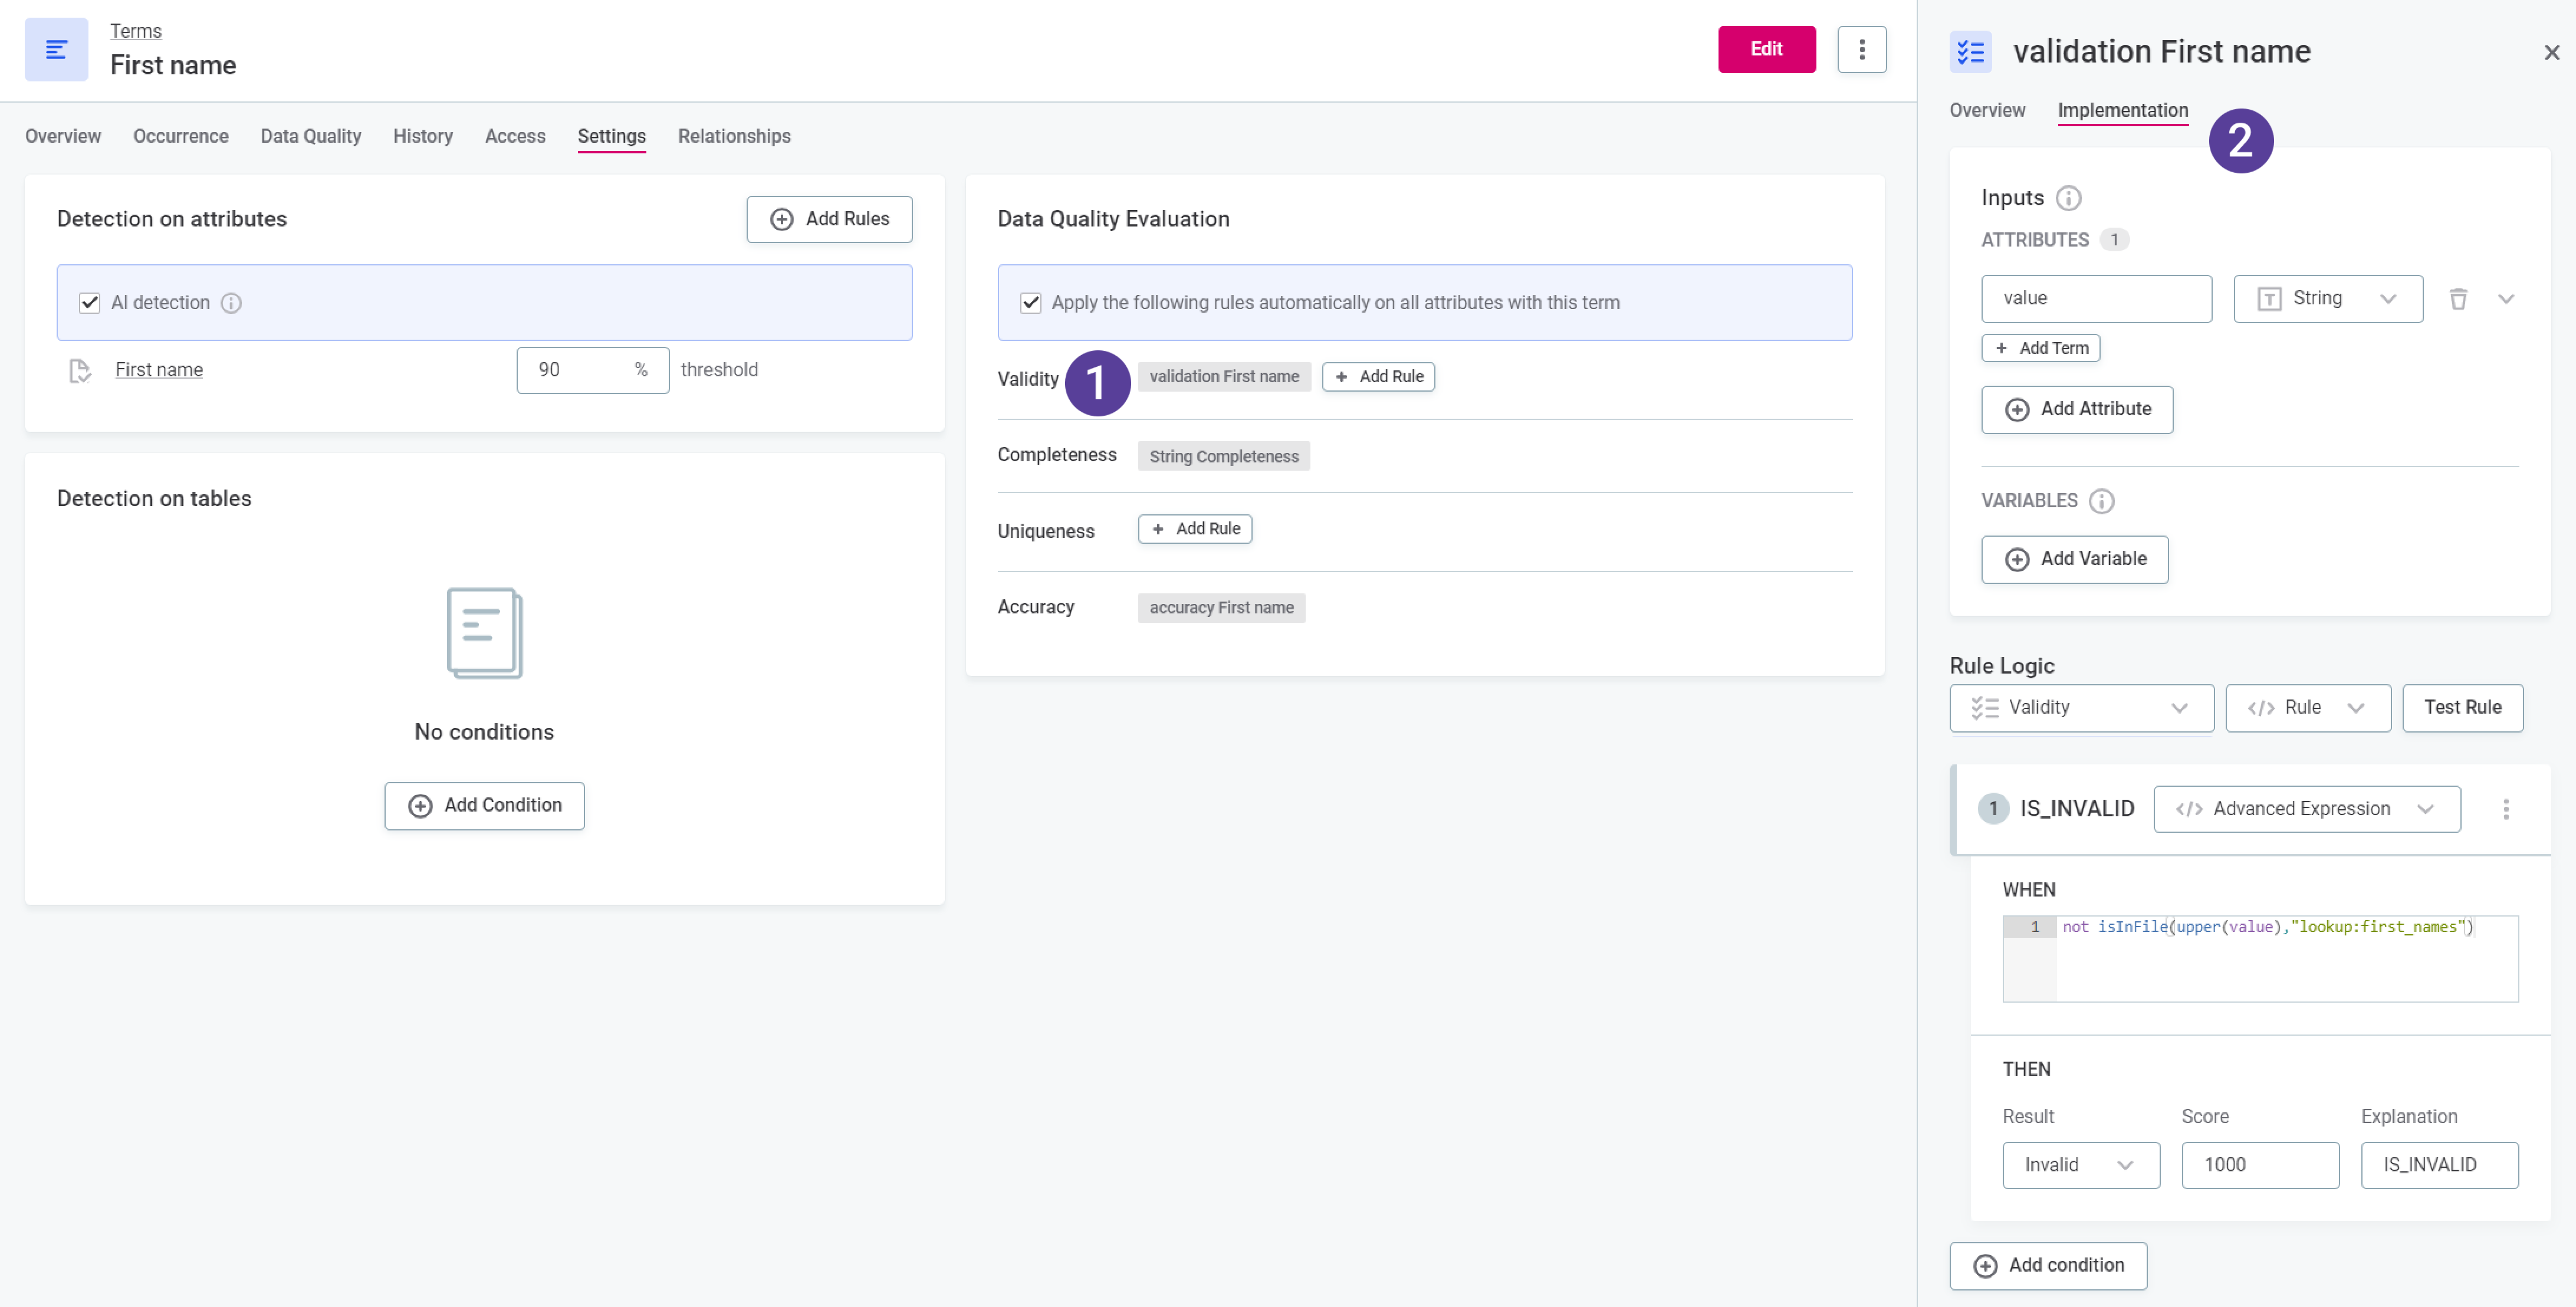
DQ evaluation rules are mapped to terms (1). These contain the conditions determining which values pass the DQ rules and which fail (2).
-
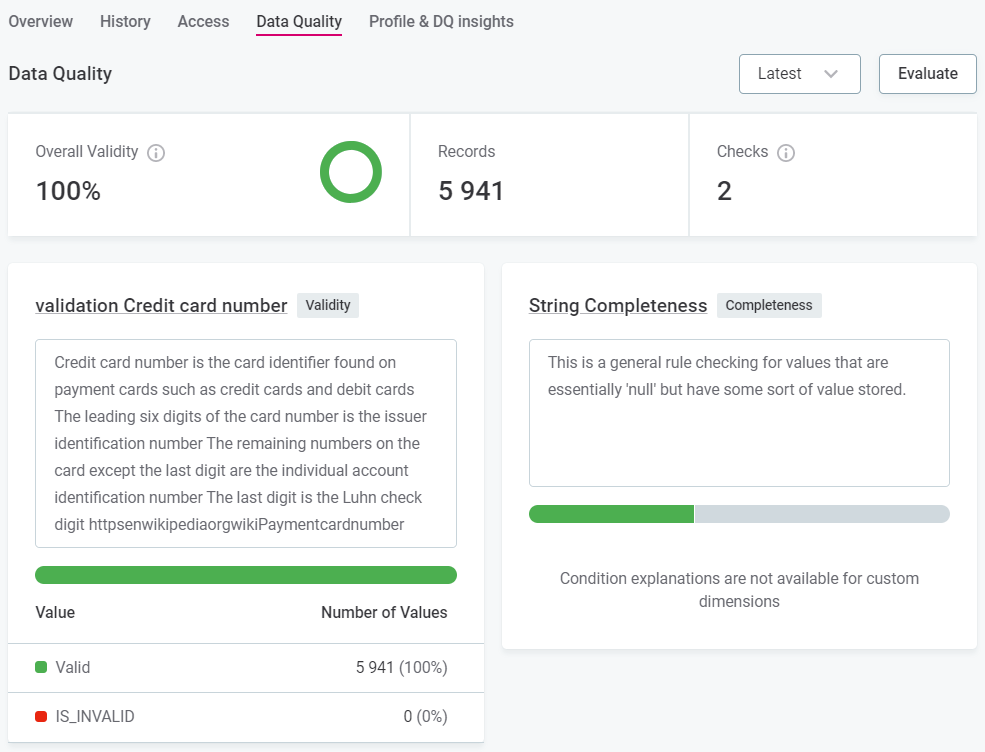
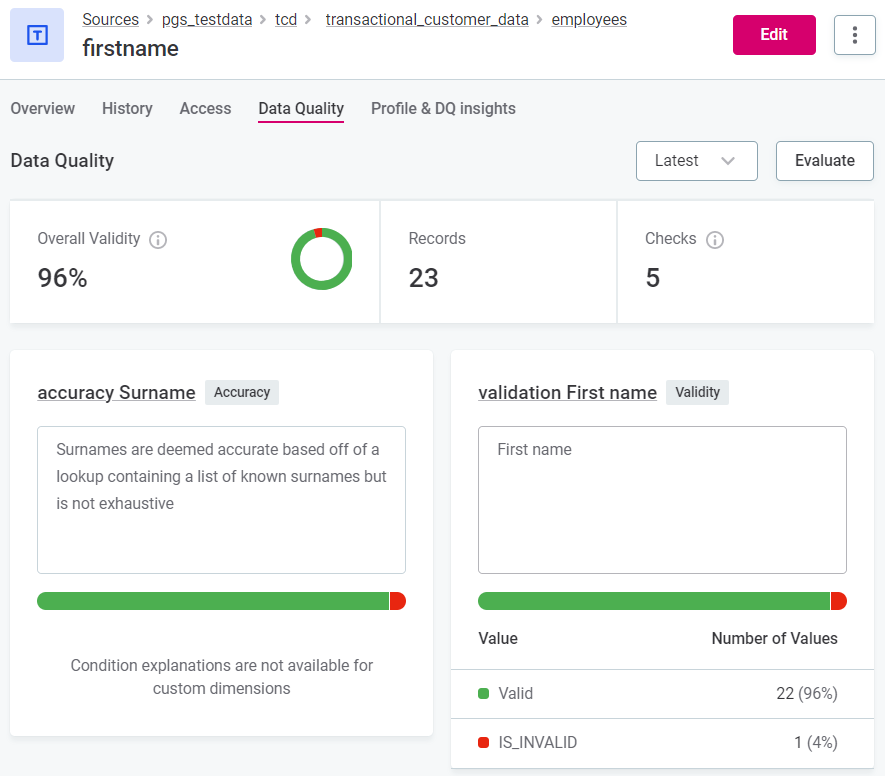
When you run DQ evaluation, the rules assigned to terms evaluate the quality of data containing those terms.
-
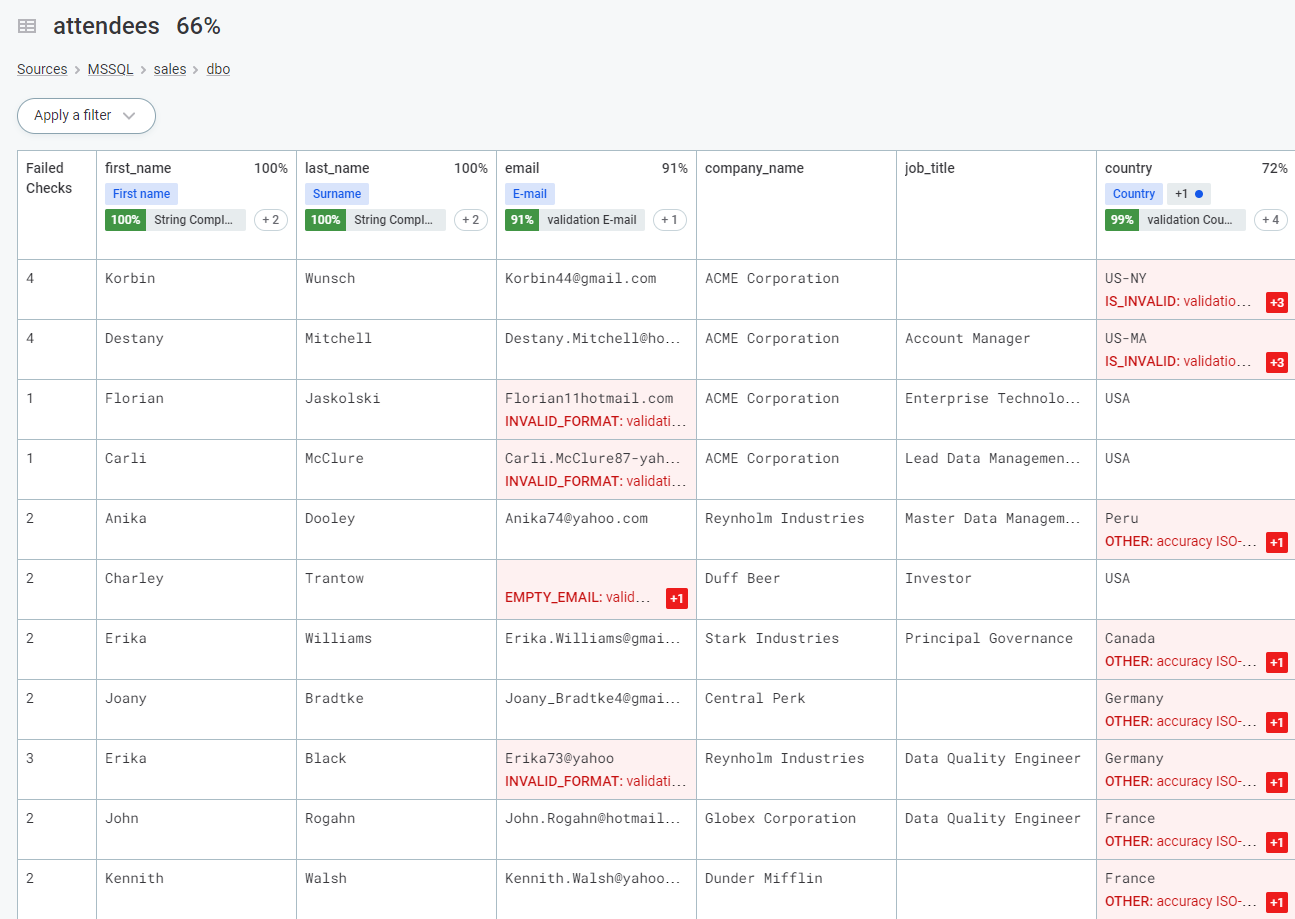
The result is a data quality percentage representing the number of records which passed all applied rules of the Validity dimension.
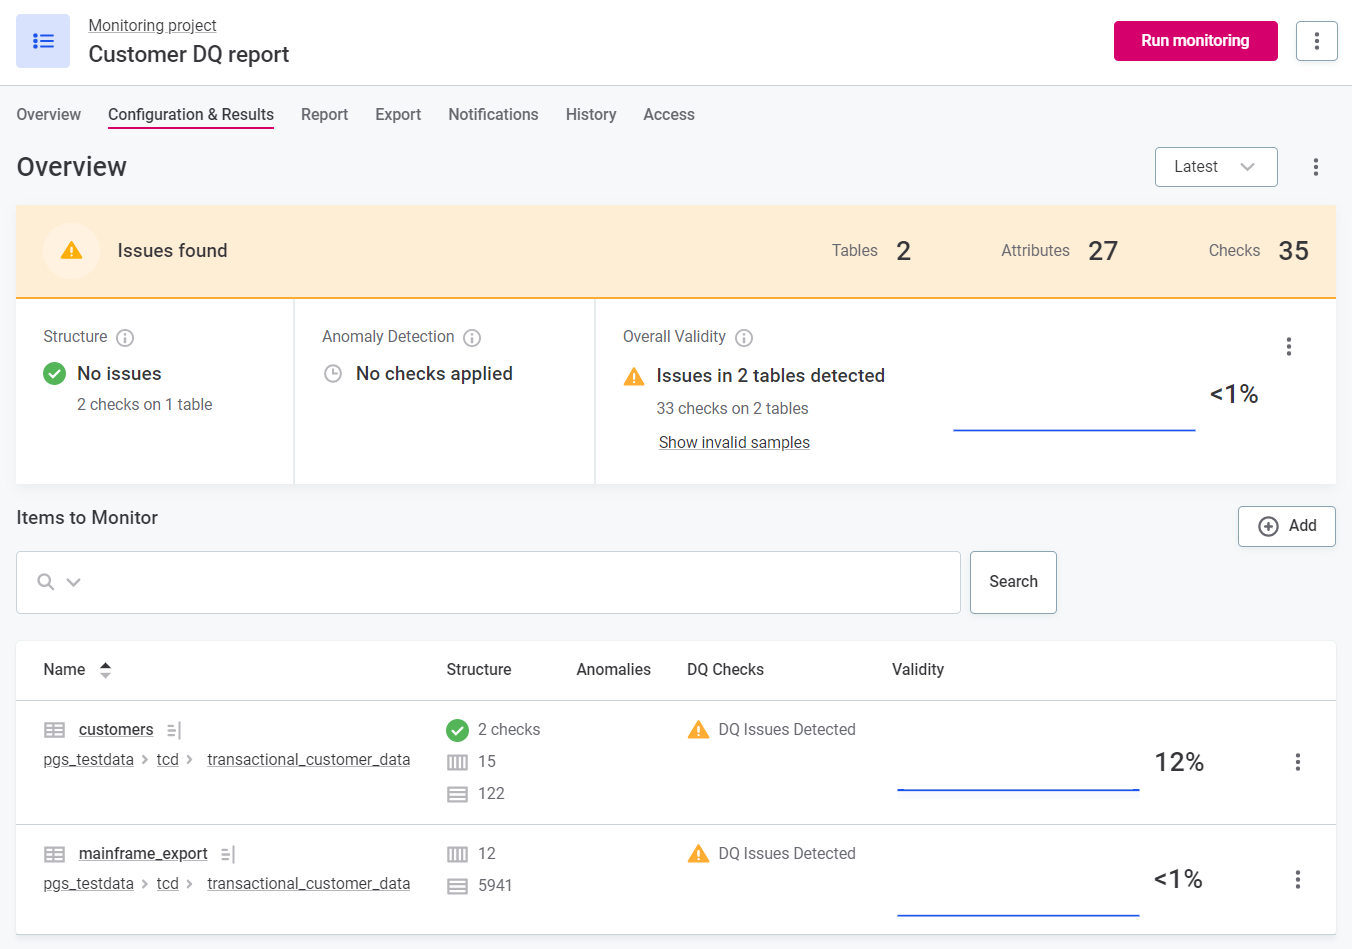
Additional data quality checks are available in monitoring projects: Structure checks and AI anomaly detection. However, these don’t contribute to the data quality metric (Overall Validity) itself.
The data quality metric is found throughout the application (for example, for sources and terms as well as individual catalog items and attributes).
| Rules of all DQ dimensions are evaluated, and results can be seen for each dimension, but only results on Validity rules contribute to the Overall Validity metric. This metric is replaced in version 14.1 by Overall Quality. |
When is data quality evaluated?
Data quality is evaluated during a number of processes, such as:
-
Ad hoc data quality evaluation on catalog items, attributes, or terms.
-
Profiling and DQ evaluation on catalog items.
-
The Document documentation flow on sources.
-
Monitoring project runs.
Key concepts
It is vital to understand the following concepts to understand data quality evaluation in Ataccama ONE.
Terms
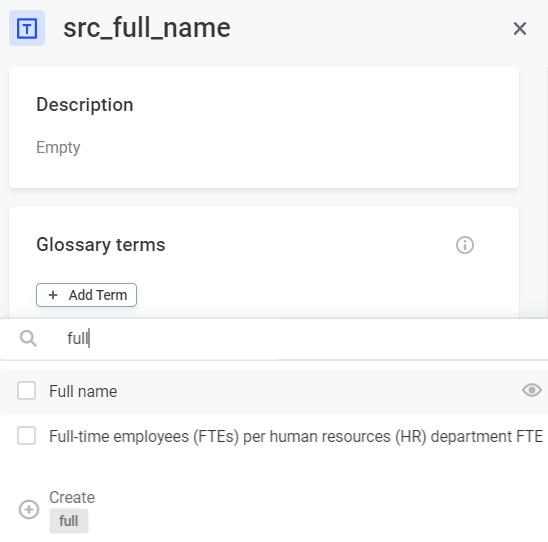
Terms, which are managed in the Glossary, are labels that are assigned to catalog items and attributes based on predefined conditions, either via detection rules or AI term suggestions. You can also manually assign terms on the attribute level.
They help you to organize and understand your dataset. Automatic mapping of terms and catalog items using system-derived detection rules is known as domain detection.
-
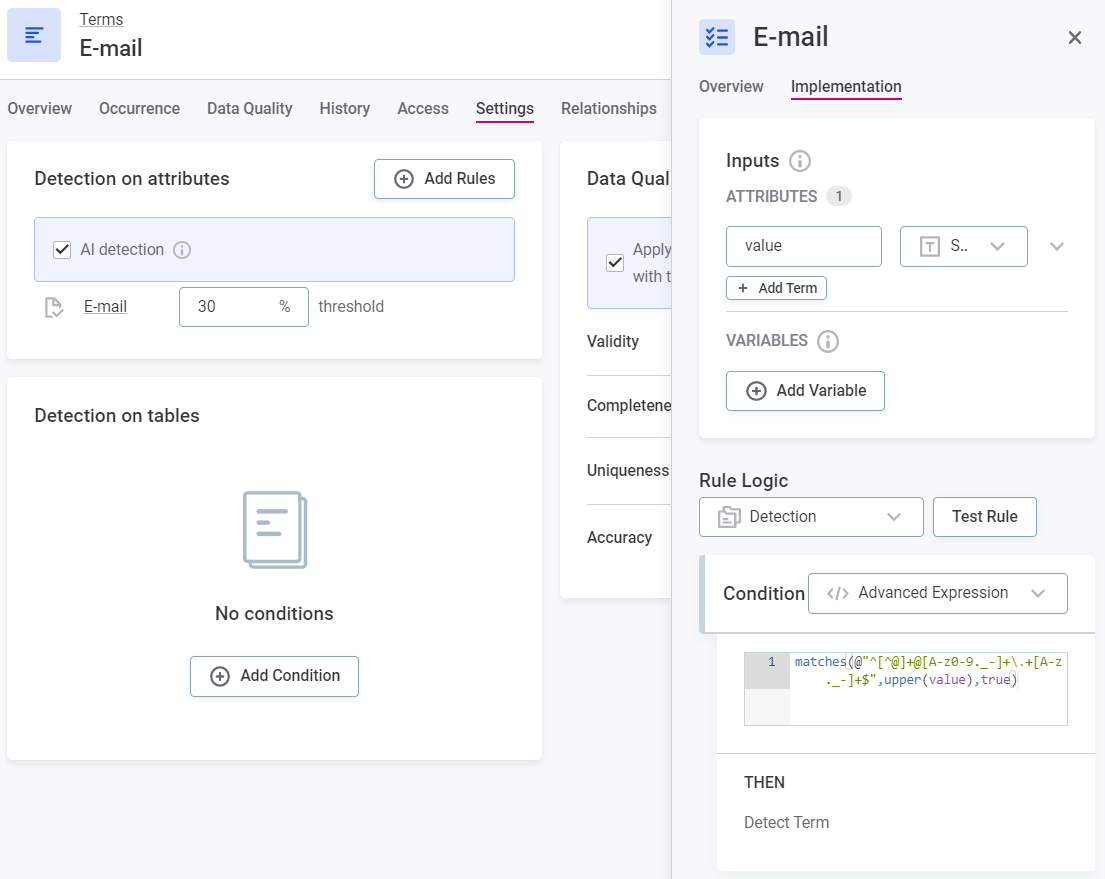
Term assignment via detection rules - Detection rules assign terms to catalog items and attributes according to the rule conditions. Both system-derived rules and user-created rules can be active in the application.
-
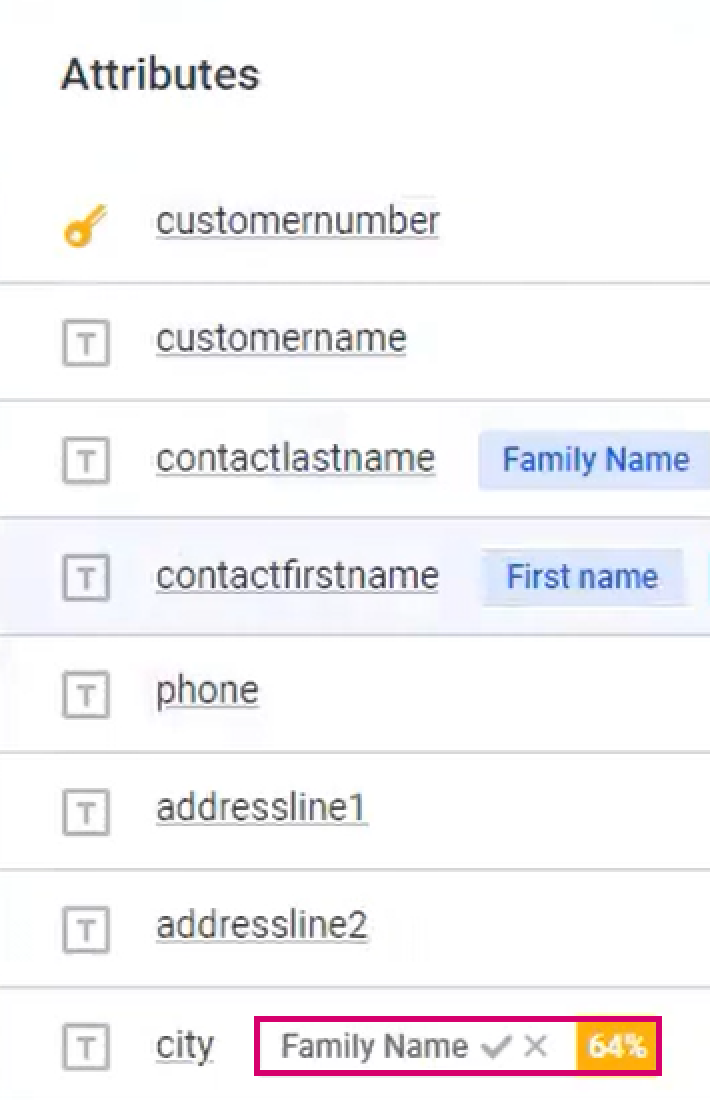
Term assignment via AI suggestions - AI suggests terms for catalog items and attributes after discovery of the data, either in the form of documentation flows or profiling (for more information, see xref:terms:term-suggestions.adoc). A confidence level is provided; you can accept or reject the suggestions accordingly.
-
Manual term assignment - Manually assign terms to attributes in the attribute sidebar or Overview tab.
Detection rules
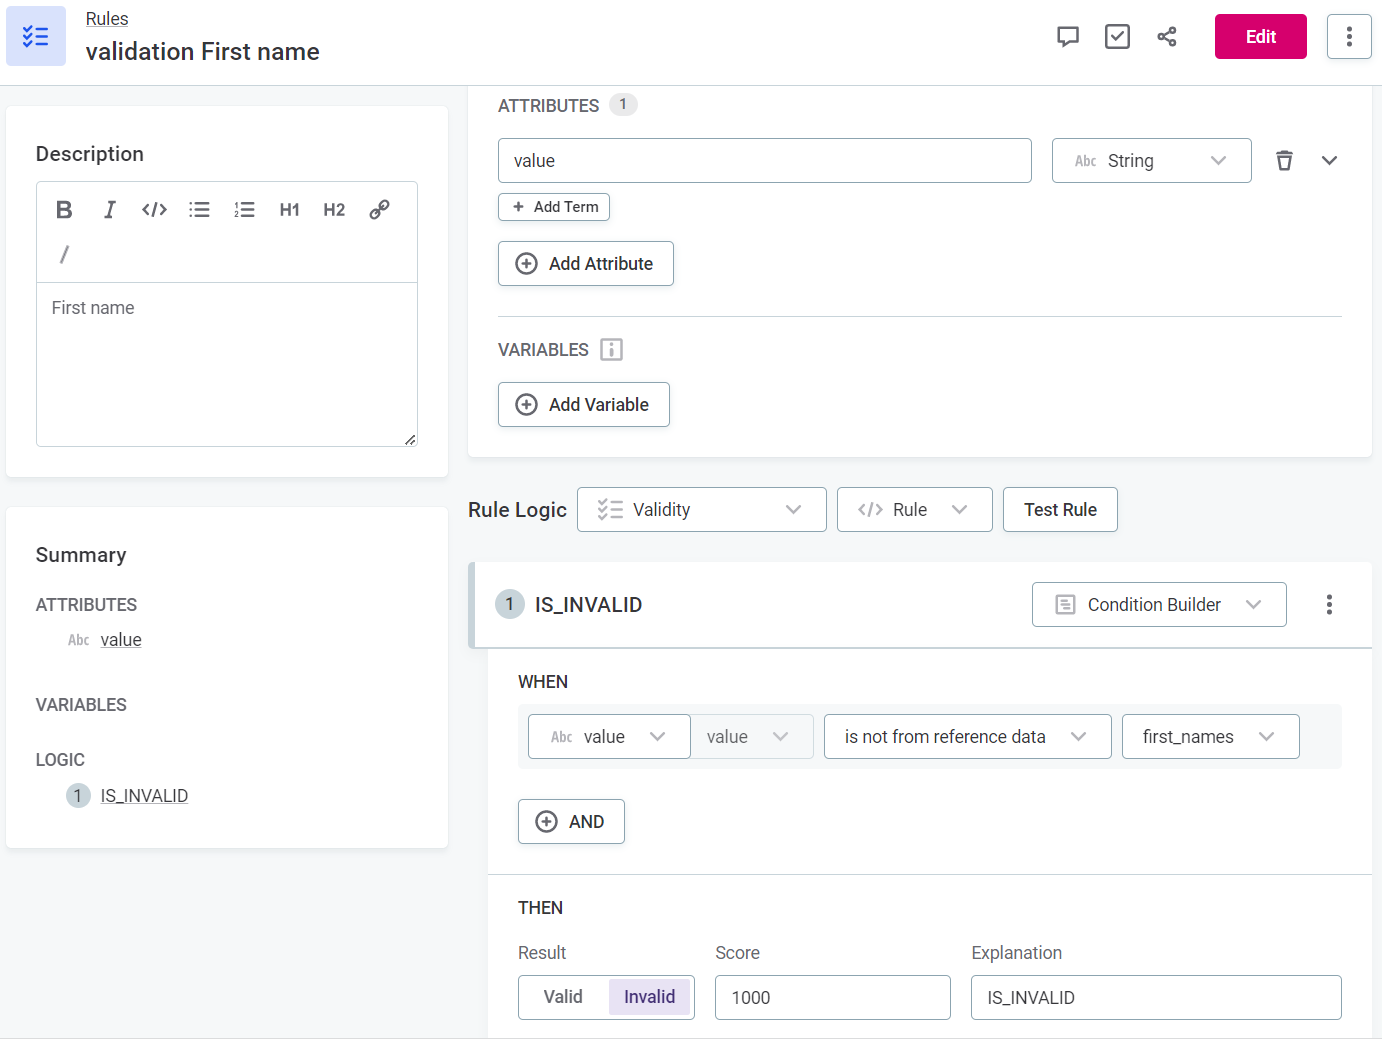
Detection rules assign terms to catalog items and attributes based on the rule conditions. Some detection rules exist by default in the application and allow initial data discovery.
You can also define specific detection rules for your dataset. To create and apply detection rules in your dataset, see Create Detection Rule.
Data quality evaluation rules
DQ evaluation rules allow you to evaluate the quality of catalog items and attributes according to the rule conditions. DQ evaluation rules are mapped to terms and evaluate the quality of catalog items and attributes containing those terms.
Ataccama ONE’s extensive rule implementation includes aggregation rules, component rules, and advanced expressions. DQ evaluation rules are further differentiated into rule dimensions, so you can indicate whether a value passes or fails according to different criteria, such as Accuracy or Completeness. Only the Validity dimension contributes to the metric Overall Validity. For more information, see Data Quality Dimensions.
DQ dimensions
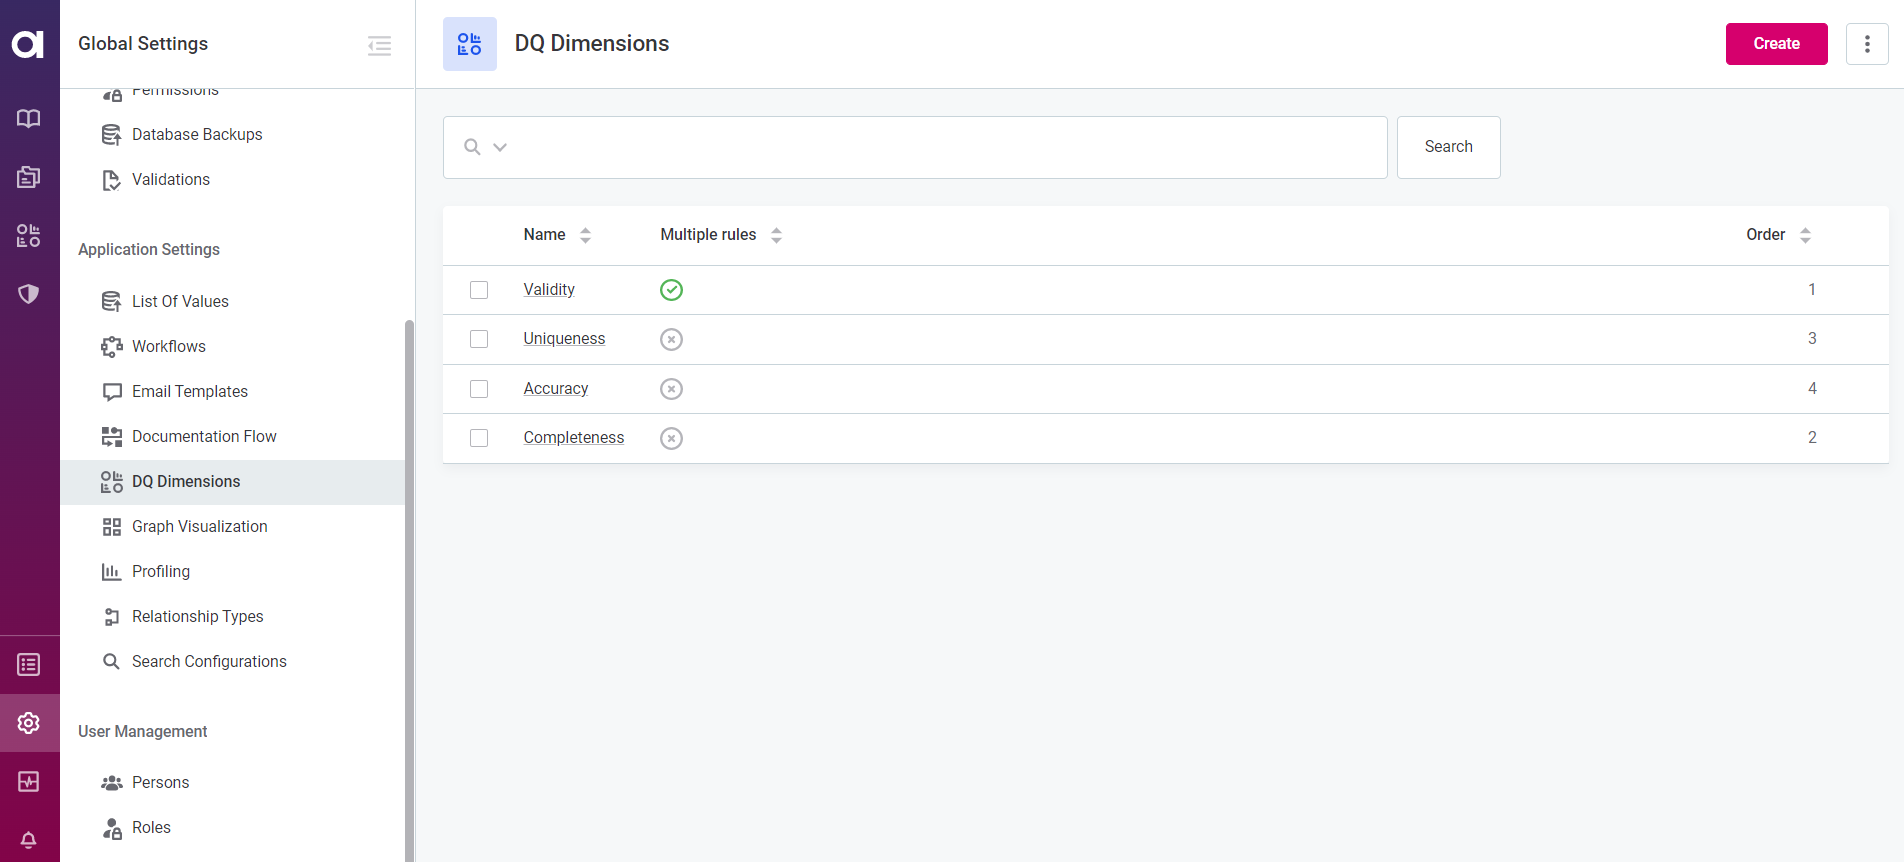
DQ dimensions allow you to see results for the data quality based on different criteria.
Four data quality dimensions exist in the application by default: Validity, Uniqueness, Accuracy, and Completeness. It is possible to modify these dimensions, remove them, or add new dimensions.
Use the preset dimensions or create your own, and define the results available for the dimension and whether they contribute positively or negatively to the data quality.
Overall validity
There is a metric found in DQ results that is known as Overall Validity. It is important to note that only results of rules of the dimension type Validity (one of the four default dimensions) count towards this metric. If a record has multiple validity rules assigned to it, if at least one of the rules is not passed, the record is counted as invalid. Records are only considered valid if they pass all validity rules assigned to them.
AI anomaly detection
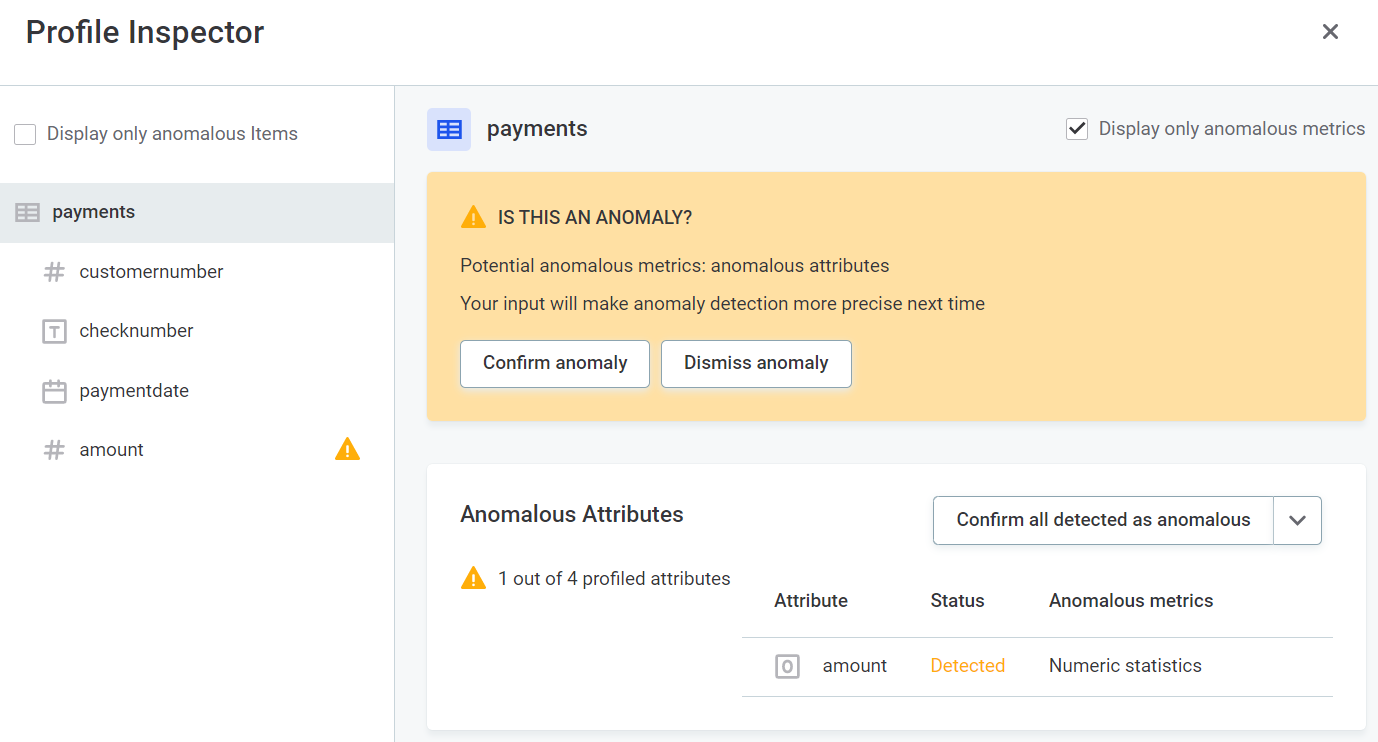
AI anomaly detection runs in the Document documentation flow, monitoring projects, profiling and DQ evaluation. AI alerts you of potential anomalies in the metadata. You can accept or reject detected anomalies.
An additional anomaly detection feature is available: Time Series Analysis for transaction data. However, this requires additional configuration and is not part of the standard processes. For more information, see Time Series Data.
Structure checks
Structure checks are carried out alongside data quality evaluation in monitoring projects and data observability and alert you, for example, if columns are missing or the data type changes.
Monitoring projects
Monitoring projects allow you to select a number of key catalog items, assign rules, run both scheduled and ad hoc monitoring, and configure notifications for issues. DQ reports are generated with detailed results and invalid results samples.
When you run monitoring projects, DQ rules are evaluated, structure checks are applied, and anomaly detection also runs.
DQ reports
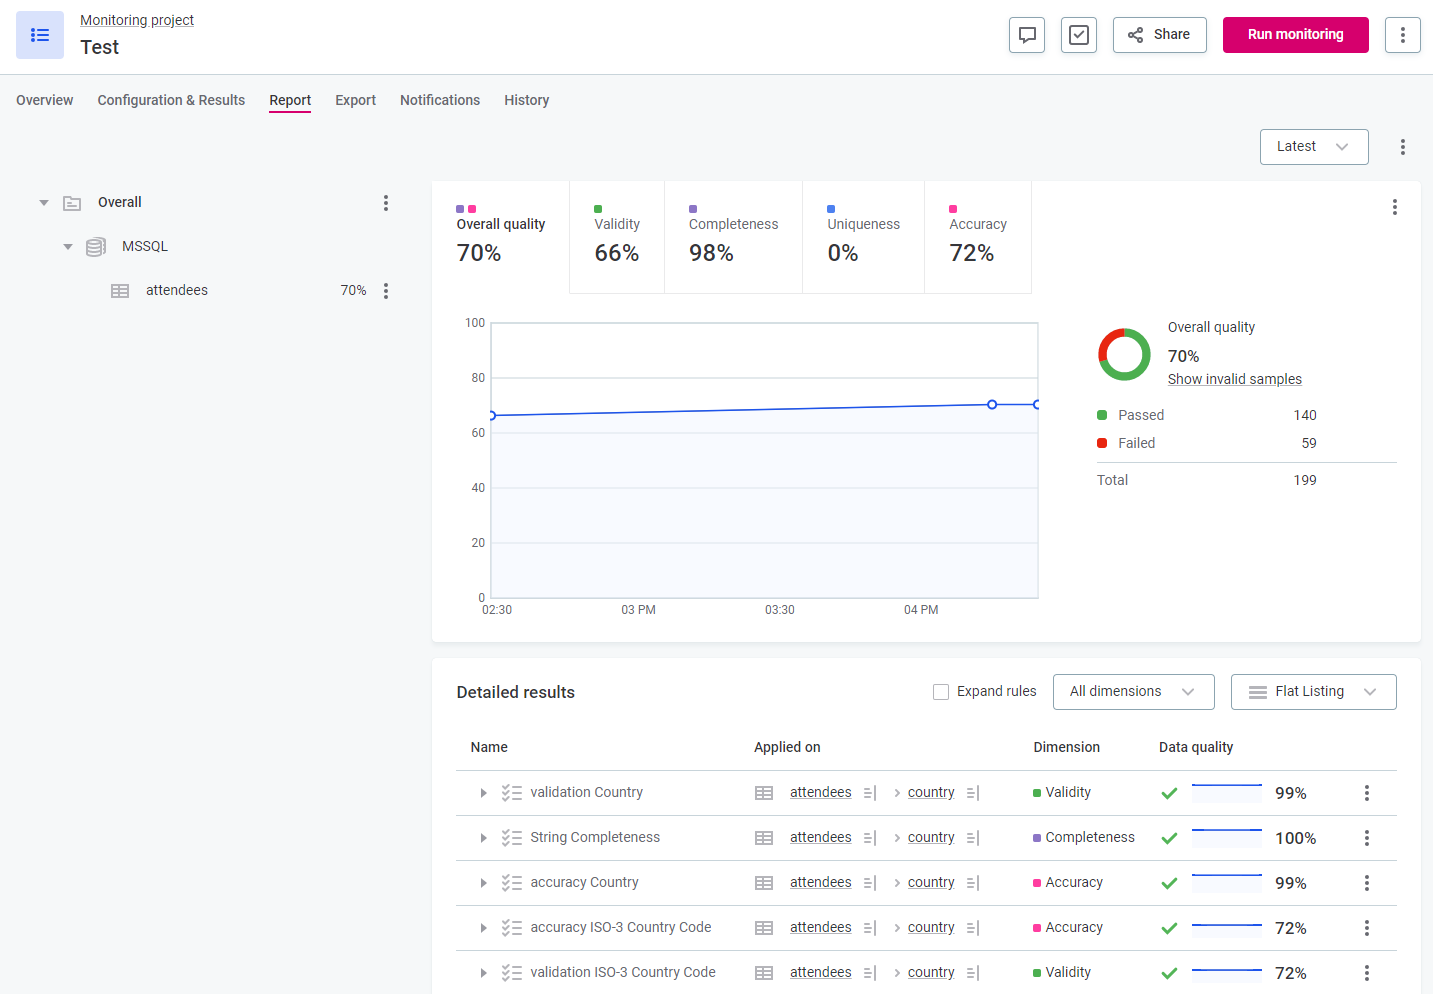
DQ reports are specific to monitoring projects. You can create filters for the reports, view detailed results, and configure custom alerts for data issues.
Post-processing plans
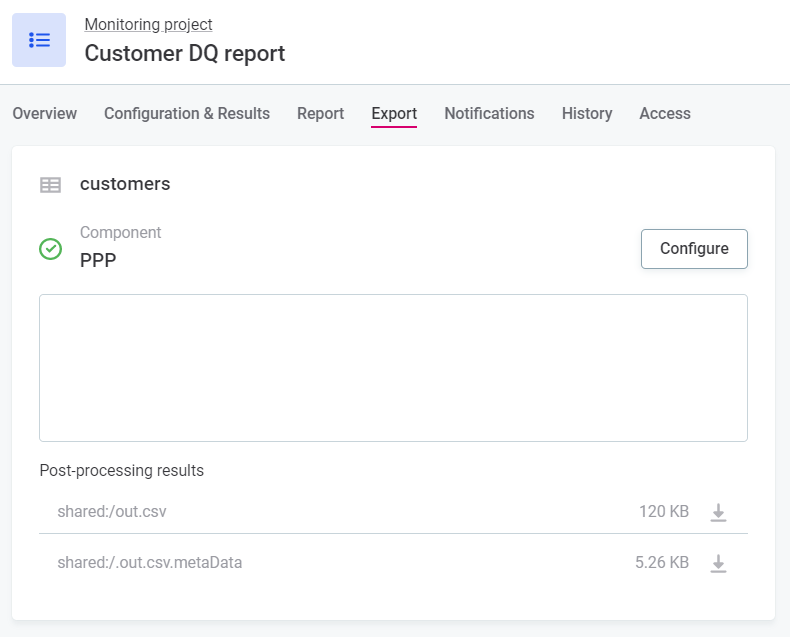
You can export the results from monitoring projects to be used in ONE Desktop, for post-processing, or into an external database or business intelligence tool.
Export the results by creating a post-processing plan in ONE Desktop, according to the instructions found in Post-Processing Plans.
Was this page useful?

