Read a Data Quality Profile
After you run a profiling plan or create a one-time profile), a file with a .profile extension appears in the File Explorer (it is immediately opened in the latter case).
Double-clicking such a file opens the Profile Viewer.
The Profile Viewer
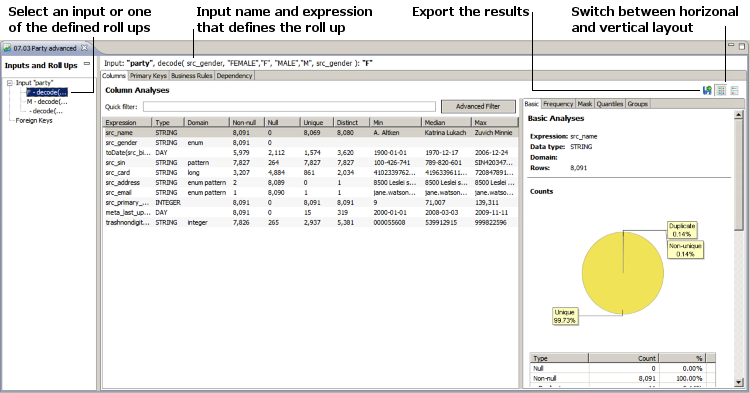
The Profile Viewer contains several tabs and windows, which are described in the following sections. The data can be exported to XML or HTML format by using the blue floppy disk icon a green arrow on it in the upper-right part of the Viewer.

Inputs and roll ups
The Profiling Step might take any number of inputs, which are shown in this panel (if there is more than one input). Additionally, each input can have any number of roll ups assigned to it - ways of grouping the data by specific parameters. For example, roll ups could be used to view data profiles by gender, department, or country.
|
For more information about adding multiple inputs and configuring roll ups, see Configure the Profiling Step, sections Input category and Roll ups respectively. For information about how to create a profile, see Create a Data Quality Profile. |
Understand the profile statistics
Depending on how it was configured, the profile contains a set of statistics, which can be divided into two categories:
-
Column Analyses - Learn how to read Basic, Frequency, Domain, Mask, Quantiles, and Group Frequency analyses.
-
Advanced Analyses - Learn how to read Primary Keys, Foreign Keys, Business Rules, and Dependency analyses.
Was this page useful?
